Estimated zip code population in 2022: 19,731 Zip code population in 2010: 17,421 Zip code population in 2000: 17,424
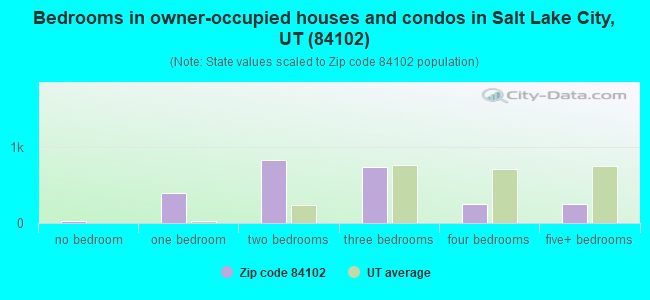
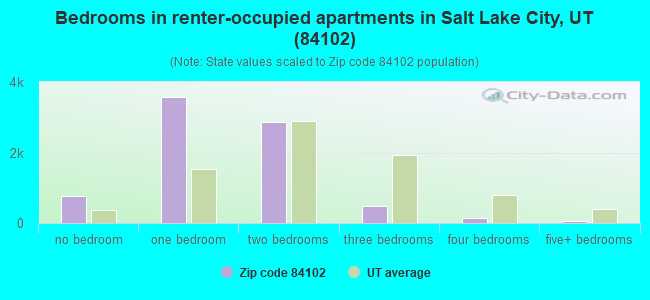
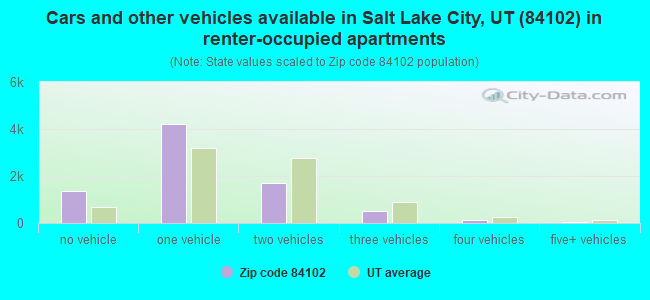
Houses and condos: 11,621 Renter-occupied apartments: 7,952
% of renters here:
76%
State:
29%
March 2022 cost of living index in zip code 84102: 97.7 (near average, U.S. average is 100)
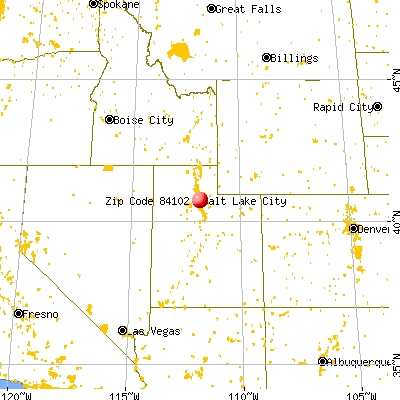
Land area: 1.8 sq. mi. Water area: 0.0 sq. mi.
Population density: 11,124 people per square mile
(high).
OSM Map
General Map
Google Map
MSN Map
OSM Map
General Map
Google Map
MSN Map
OSM Map
General Map
Google Map
MSN Map
OSM Map
General Map
Google Map
MSN Map
Please wait while loading the map...
Real estate property taxes paid for housing units in 2022:
This zip code:
0.5% ($2,706)
Utah:
0.5% ($2,376)
Median real estate property taxes paid for housing units with mortgages in 2022: $2,707 (0.5%) Median real estate property taxes paid for housing units with no mortgage in 2022: $2,707 (0.5%)
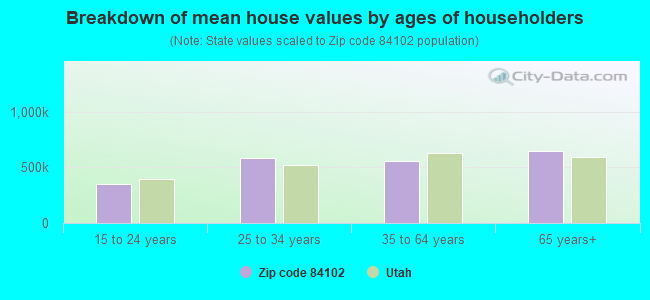
Estimated median house/condo value in 2022: $541,563
84102:
$541,563
Utah:
$499,500
According to our research of Utah and other state lists, there were 50 registered sex offenders living in 84102 zip code as of April 27, 2024. The ratio of all residents to sex offenders in zip code 84102 is 368 to 1. The ratio of registered sex offenders to all residents in this zip code is near the state average.
Median resident age:
This zip code:
29.4 years
Utah median age:
32.1 years
Average household size:
This zip code:
1.8 people
Utah:
3.0 people
Averages for the 2020 tax year for zip code 84102, filed in 2021:
Average Adjusted Gross Income (AGI) in 2020: $60,457 (Individual Income Tax Returns)
Here:
$60,457
State:
$81,660
Salary/wage: $49,427 (reported on 89.6% of returns)
Here:
$49,427
State:
$63,027
(% of AGI for various income ranges: 1223.3% for AGIs below $25k, 3998.3% for AGIs $25k-50k, 7396.4% for AGIs $50k-75k, 11082.0% for AGIs $75k-100k, 19872.6% for AGIs $100k-200k, 88795.5% for AGIs over 200k)
Taxable interest for individuals: $1,769 (reported on 23.6% of returns)
This zip code:
$1,769
Utah:
$2,255
(% of AGI for various income ranges: 6.9% for AGIs below $25k, 10.9% for AGIs $25k-50k, 31.1% for AGIs $50k-75k, 51.5% for AGIs $75k-100k, 189.5% for AGIs $100k-200k, 1970.9% for AGIs over 200k)
Ordinary dividends: $6,221 (reported on 19.3% of returns)
Here:
$6,221
State:
$7,362
(% of AGI for various income ranges: 15.3% for AGIs below $25k, 26.3% for AGIs $25k-50k, 77.4% for AGIs $50k-75k, 169.2% for AGIs $75k-100k, 554.2% for AGIs $100k-200k, 5892.7% for AGIs over 200k)
Net capital gain/loss in AGI: +$22,099 (reported on 19.2% of returns)
Here:
+$22,099
State:
+$43,433
(% of AGI for various income ranges: 16.4% for AGIs below $25k, 42.8% for AGIs $25k-50k, 113.8% for AGIs $50k-75k, 245.2% for AGIs $75k-100k, 854.9% for AGIs $100k-200k, 29720.0% for AGIs over 200k)
Profit/loss from business: +$10,119 (reported on 13.5% of returns)
Here:
+$10,119
State:
+$9,957
(% of AGI for various income ranges: 78.0% for AGIs below $25k, 102.2% for AGIs $25k-50k, 136.3% for AGIs $50k-75k, 316.5% for AGIs $75k-100k, 677.0% for AGIs $100k-200k, 2640.0% for AGIs over 200k)
Taxable individual retirement arrangement distribution: $19,331 (reported on 3.7% of returns)
84102:
$19,331
Utah:
$21,167
(% of AGI for various income ranges: 13.1% for AGIs below $25k, 37.3% for AGIs $25k-50k, 111.5% for AGIs $50k-75k, 252.0% for AGIs $75k-100k, 639.1% for AGIs $100k-200k, 737.3% for AGIs over 200k)
Self-employed (Keogh) retirement plans: $26,567 (reported on 0.3% of returns)
84102:
$26,567
Utah:
$29,069
(% of AGI for various income ranges: 185.3% for AGIs $100k-200k)
Total itemized deductions: $40,527 (reported on 7.2% of returns)
Here:
$40,527
State:
$41,056
(% of AGI for various income ranges: 17.8% for AGIs below $25k, 43.8% for AGIs $25k-50k, 208.2% for AGIs $50k-75k, 624.8% for AGIs $75k-100k, 1541.4% for AGIs $100k-200k, 13304.5% for AGIs over 200k)
Charity contributions: $17,225 (reported on 5.4% of returns)
Here:
$17,225
State:
$22,261
(% of AGI for various income ranges: 12.1% for AGIs $25k-50k, 38.0% for AGIs $50k-75k, 100.0% for AGIs $75k-100k, 362.1% for AGIs $100k-200k, 5656.4% for AGIs over 200k)
Taxes paid: $7,732 (reported on 7.1% of returns)
84102:
$7,732
State:
$7,985
(% of AGI for various income ranges: 3.4% for AGIs below $25k, 9.8% for AGIs $25k-50k, 55.2% for AGIs $50k-75k, 173.0% for AGIs $75k-100k, 470.7% for AGIs $100k-200k, 1423.6% for AGIs over 200k)
Earned income credit: $1,044 (reported on 9.0% of returns)
Here:
$1,044
State:
$2,169
(% of AGI for various income ranges: 19.4% for AGIs below $25k, 15.0% for AGIs $25k-50k)
Percentage of individuals using paid preparers for their 2020 taxes: 93.9%
Here:
94%
State:
94%
(% for various income ranges: 93.5% for AGIs below $25k, 94.1% for AGIs $25k-50k, 94.7% for AGIs $50k-75k, 93.7% for AGIs $75k-100k, 92.7% for AGIs $100k-200k, 97.0% for AGIs over 200k)
Averages for the 2012 tax year for zip code 84102, filed in 2013:
Average Adjusted Gross Income (AGI) in 2012: $44,249 (Individual Income Tax Returns)
Here:
$44,249
State:
$60,327
Salary/wage: $36,886 (reported on 89.7% of returns)
Here:
$36,886
State:
$48,762
(% of AGI for various income ranges: 88.0% for AGIs below $25k, 89.3% for AGIs $25k-50k, 85.8% for AGIs $50k-75k, 79.9% for AGIs $75k-100k, 74.5% for AGIs $100k-200k, 41.2% for AGIs over 200k)
Taxable interest for individuals: $1,320 (reported on 27.8% of returns)
This zip code:
$1,320
Utah:
$1,534
(% of AGI for various income ranges: 0.8% for AGIs below $25k, 0.3% for AGIs $25k-50k, 0.4% for AGIs $50k-75k, 0.4% for AGIs $75k-100k, 1.0% for AGIs $100k-200k, 1.7% for AGIs over 200k)
Ordinary dividends: $5,552 (reported on 15.8% of returns)
Here:
$5,552
State:
$5,711
(% of AGI for various income ranges: 1.1% for AGIs below $25k, 0.9% for AGIs $25k-50k, 1.5% for AGIs $50k-75k, 1.8% for AGIs $75k-100k, 2.8% for AGIs $100k-200k, 3.4% for AGIs over 200k)
Net capital gain/loss in AGI: +$9,661 (reported on 13.3% of returns)
Here:
+$9,661
State:
+$23,734
(% of AGI for various income ranges: 0.2% for AGIs below $25k, 0.3% for AGIs $25k-50k, 0.4% for AGIs $50k-75k, 0.8% for AGIs $75k-100k, 2.9% for AGIs $100k-200k, 10.2% for AGIs over 200k)
Profit/loss from business: +$9,363 (reported on 12.7% of returns)
Here:
+$9,363
State:
+$8,845
(% of AGI for various income ranges: 5.0% for AGIs below $25k, 2.3% for AGIs $25k-50k, 1.8% for AGIs $50k-75k, 3.1% for AGIs $75k-100k, 2.2% for AGIs $100k-200k, 2.4% for AGIs over 200k)
Taxable individual retirement arrangement distribution: $15,198 (reported on 4.9% of returns)
84102:
$15,198
Utah:
$15,565
(% of AGI for various income ranges: 1.1% for AGIs below $25k, 1.1% for AGIs $25k-50k, 0.9% for AGIs $50k-75k, 2.7% for AGIs $75k-100k, 3.4% for AGIs $100k-200k, 1.3% for AGIs over 200k)
Self-employment retirement plans: $14,233 (reported on 0.4% of returns)
84102:
$14,233
Utah:
$22,655
Total itemized deductions: $20,523 (19% of AGI, reported on 21.1% of returns)
Here:
$20,523
State:
$25,197
Here:
19.2% of AGI
State:
22.4% of AGI
(% of AGI for various income ranges: 4.8% for AGIs below $25k, 6.4% for AGIs $25k-50k, 11.5% for AGIs $50k-75k, 12.5% for AGIs $75k-100k, 14.9% for AGIs $100k-200k, 9.6% for AGIs over 200k)
Charity contributions: $4,835 (reported on 16.6% of returns)
Here:
$4,835
State:
$8,502
(% of AGI for various income ranges: 0.5% for AGIs below $25k, 1.0% for AGIs $25k-50k, 1.6% for AGIs $50k-75k, 2.7% for AGIs $75k-100k, 3.1% for AGIs $100k-200k, 2.2% for AGIs over 200k)
Taxes paid: $7,165 (reported on 20.9% of returns)
84102:
$7,165
State:
$7,001
(% of AGI for various income ranges: 0.8% for AGIs below $25k, 1.4% for AGIs $25k-50k, 3.1% for AGIs $50k-75k, 4.1% for AGIs $75k-100k, 5.6% for AGIs $100k-200k, 5.0% for AGIs over 200k)
Earned income credit: $1,139 (reported on 13.8% of returns)
Here:
$1,139
State:
$2,259
(% of AGI for various income ranges: 2.1% for AGIs below $25k, 0.3% for AGIs $25k-50k)
Percentage of individuals using paid preparers for their 2012 taxes: 36.8%
Here:
37%
State:
51%
(% for various income ranges: 31.9% for AGIs below $25k, 34.9% for AGIs $25k-50k, 41.8% for AGIs $50k-75k, 47.7% for AGIs $75k-100k, 57.1% for AGIs $100k-200k, 69.2% for AGIs over 200k)
Averages for the 2004 tax year for zip code 84102, filed in 2005:
Average Adjusted Gross Income (AGI) in 2004: $32,862 (Individual Income Tax Returns)
Here:
$32,862
State:
$45,498
Salary/wage: $29,080 (reported on 87.6% of returns)
Here:
$29,080
State:
$38,975
(% of AGI for various income ranges: 181.0% for AGIs below $10k, 89.1% for AGIs $10k-25k, 88.5% for AGIs $25k-50k, 81.6% for AGIs $50k-75k, 74.8% for AGIs $75k-100k, 51.9% for AGIs over 100k)
Taxable interest for individuals: $1,521 (reported on 36.3% of returns)
This zip code:
$1,521
Utah:
$1,445
(% of AGI for various income ranges: 4.3% for AGIs below $10k, 1.3% for AGIs $10k-25k, 1.2% for AGIs $25k-50k, 1.5% for AGIs $50k-75k, 2.5% for AGIs $75k-100k, 2.1% for AGIs over 100k)
Taxable dividends: $3,974 (reported on 18.2% of returns)
Here:
$3,974
State:
$3,152
(% of AGI for various income ranges: 4.9% for AGIs below $10k, 1.1% for AGIs $10k-25k, 0.9% for AGIs $25k-50k, 1.7% for AGIs $50k-75k, 2.6% for AGIs $75k-100k, 4.0% for AGIs over 100k)
Net capital gain/loss: +$6,651 (reported on 15.9% of returns)
Here:
+$6,651
State:
+$14,059
(% of AGI for various income ranges: -1.0% for AGIs below $10k, 0.6% for AGIs $10k-25k, 0.9% for AGIs $25k-50k, 1.6% for AGIs $50k-75k, 2.9% for AGIs $75k-100k, 8.2% for AGIs over 100k)
Profit/loss from business: +$5,452 (reported on 12.4% of returns)
Here:
+$5,452
State:
+$6,903
(% of AGI for various income ranges: 5.0% for AGIs below $10k, 2.0% for AGIs $10k-25k, 1.8% for AGIs $25k-50k, 2.1% for AGIs $50k-75k, 1.0% for AGIs $75k-100k, 2.4% for AGIs over 100k)
IRA payment deduction: $2,571 (reported on 2.0% of returns)
84102:
$2,571
Utah:
$2,970
(% of AGI for various income ranges: 0.2% for AGIs $10k-25k, 0.2% for AGIs $25k-50k, 0.1% for AGIs $50k-75k, 0.2% for AGIs $75k-100k, 0.1% for AGIs over 100k)
Self-employed pension: $6,083 (reported on 0.3% of returns)
Here:
$6,083
Utah:
$14,916
Total itemized deductions: $16,973 (23% of AGI, reported on 24.3% of returns)
Here:
$16,973
State:
$20,312
Here:
22.8% of AGI
State:
24.9% of AGI
(% of AGI for various income ranges: 17.0% for AGIs below $10k, 5.9% for AGIs $10k-25k, 9.3% for AGIs $25k-50k, 15.8% for AGIs $50k-75k, 18.7% for AGIs $75k-100k, 15.6% for AGIs over 100k)
Charity contributions deductions: $4,654 (5% of AGI, reported on 18.9% of returns)
Here:
$4,654
State:
$6,250
Here:
5.4% of AGI
State:
7.4% of AGI
(% of AGI for various income ranges: 1.2% for AGIs below $10k, 0.8% for AGIs $10k-25k, 1.5% for AGIs $25k-50k, 3.0% for AGIs $50k-75k, 4.1% for AGIs $75k-100k, 4.4% for AGIs over 100k)
Total tax: $4,874 (reported on 72.2% of returns)
84102:
$4,874
State:
$6,523
(% of AGI for various income ranges: 4.1% for AGIs below $10k, 4.4% for AGIs $10k-25k, 7.9% for AGIs $25k-50k, 10.6% for AGIs $50k-75k, 11.5% for AGIs $75k-100k, 17.2% for AGIs over 100k)
Earned income credit: $1,067 (reported on 12.4% of returns)
Here:
$1,067
State:
$1,703
Percentage of individuals using paid preparers for their 2004 taxes: 42.5%
Here:
42%
State:
53%
(% for various income ranges: 39.3% for AGIs below $10k, 40.7% for AGIs $10k-25k, 39.4% for AGIs $25k-50k, 49.2% for AGIs $50k-75k, 59.8% for AGIs $75k-100k, 67.4% for AGIs over 100k)
Likely homosexual households (counted as self-reported same-sex unmarried-partner households)
Lesbian couples: 0.2% of all households
Gay men: 0.4% of all households
Household received Food Stamps/SNAP in the past 12 months: 480 Household did not receive Food Stamps/SNAP in the past 12 months: 10,110
Women who had a birth in the past 12 months: 74 (66 now married, 8 unmarried) Women who did not have a birth in the past 12 months: 7,336 (1,145 now married, 6,273 unmarried)
Housing units in zip code 84102 with a mortgage: 1,803 (253 second mortgage, 248 both second mortgage and home equity loan) Houses without a mortgage: 44
Median monthly owner costs for units with a mortgage: $1,933 Median monthly owner costs for units without a mortgage: $559
Residents with income below the poverty level in 2022:
This zip code:
27.3%
Whole state:
8.2%
Residents with income below 50% of the poverty level in 2022:
This zip code:
11.3%
Whole state:
4.3%
Median number of rooms in houses and condos:
Here:
5.6
State:
7.6
Median number of rooms in apartments:
Here:
3.3
State:
4.3
Notable locations in this zip code not listed on our city pages
Notable locations in zip code 84102: Trolley Square (A), Cancer Wellness House (B), Salt Lake City Fire Department Station 5 (C), Kennecott Building (D), Salt Lake City Fire Department Station 1 (E), Salt Lake City Fire Station Number 5 (F), University of Utah Child Care Coordinating Services (G). Display/hide their locations on the map
Churches in zip code 84102 include: Metropolitan Community Church (A), Newman Center (B), Presbytery of Utah (C), Soka Gakkai International Church (D), Capital Church in the City (E), Calvary Baptist Church (F), Calvary Chapel (G), Central Seventh Day Adventist Church (H), First Baptist Church (I). Display/hide their locations on the map
Tourist attractions (not listed on the city page) : Tourism Consultants (5020 Fairbrook Lane), Su Casa Mexican Restaurant (516 East 300 Street), For Most West (Tours & Charters; 770 East South Temple Uppr).
654 married couples with children.
244 single-parent households (51 men, 193 women).
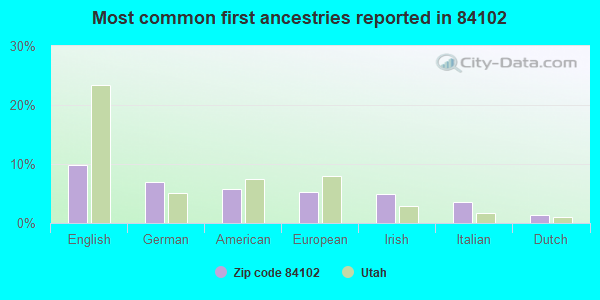
84.2% of residents of 84102 zip code speak English at home.
6.0% of residents speak Spanish at home (81% very well, 10% well, 6% not well, 4% not at all).
4.1% of residents speak other Indo-European language at home (85% very well, 14% well, 1% not at all).
4.9% of residents speak Asian or Pacific Island language at home (80% very well, 16% well, 4% not well).
0.8% of residents speak other language at home (92% very well, 8% well).
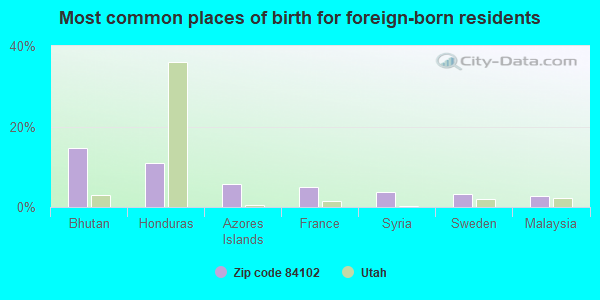
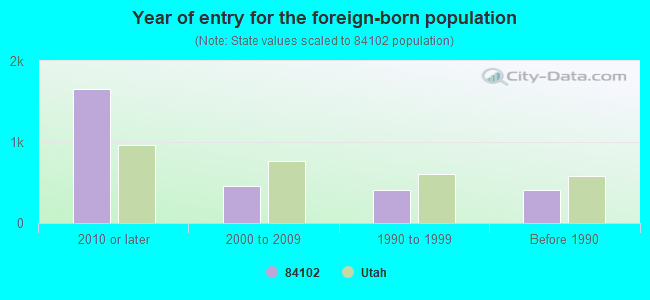
Foreign born population: 2,529 (12.8%) (32.3% of them are naturalized citizens)
Major facilities with environmental interests located in this zip code:
JIFFY LUBE #1224 (804 E 400 S in SALT LAKE CITY, UT)
STATE MASTER (Utah compliance and permitting operations) - USED OIL TRACKING SY-2, USED OIL PROGRAM Small Quantity Generators, between 100 kg and 1000 kg of hazardous waste/month (Resource Conservation and Recovery Act (tracking hazardous waste)) - notification Organizations: OILWELL INC (CONTACT/OWNER)
BRYANT MIDDLE (40 S 800 E in SALT LAKE CITY, UT)
(National Center for Education Statistics) - STATE ID-36 404 Organizations: SALT LAKE CITY SCHOOL DISTRICT (SCHOOL DISTRICT)
INTERSTATE BRANDS CORPORATION (734 EAST 400 SOUTH in SALT LAKE CITY, UT)
AIR SYNTHETIC MINOR (AIRS/AFS) ENFORCEMENT/COMPLIANCE ACTIVITY (Integrated Compliance Information System) COMPLIANCE ACTIVITY (Tracking inspections of insecticide, fungicide, and rodenticide, and toxic substances) CRITERIA AND HAZARDOUS AIR POLLUTANT INVENTORY (Inventory of air pollution sources) Conditionally Exempt Small Quantity Generators, less than 100 kg/month of hazardous waste (Resource Conservation and Recovery Act (tracking hazardous waste)) Business SIC classification: BREAD AND OTHER BAKERY PRODUCTS, EXCEPT COOKIES AND CRACKERS Alternative names: CONTINENTAL BAKERY, INC., CONTINENTAL BAKING COMPANY SALT LAKE, HOSTESS CAKE WONDER BREAD, INTERSTATE BAKING COMPANY - SALT LAKE, INTERSTATE BRANDS CORPORATION RALSTON PARINA, INTERSTATE BRANDS CORP/RALSTON PARINA, INTERSTATE BRANDS (RALSTON PURINA), WONDER BREAD HOSTESS CAKE MAIN OFFICE
MOUNT OLIVET CEMETERY (1342 EAST 500 SOUTH in SALT LAKE CITY, UT)
SUPERFUND (Superfund database) STATE MASTER (Utah compliance and permitting operations) - UST DATABASE-4, UNDERGROUND STORAGE TANK PROGRAM Alternative names: ARMY NATIONAL GUARD, MOUNT OLIVET CEMETARY ASSOC, MOUNT OLIVET CEMETERY PLUME, MOUNT OLIVET CEMETEY PLUME, OLD DUMP/FILL SITE
M LYNN BENNION ELEM SCH (429 S 800 E in SALT LAKE CITY, UT)
(National Center for Education Statistics) - STATE ID-36 204 Organizations: SALT LAKE CITY SCHOOL DISTRICT (SCHOOL DISTRICT)
LITTLE AMERICA REFINING (550 EAST SOUTH TEMPLE in SALT LAKE CITY, UT)
(Integrated Compliance Information System) - ICIS-HQ-1992-5343, FORMAL ENFORCEMENT ACTION
HOLY CROSS HOSPITAL (1045 EAST 1ST SOUTH in SALT LAKE CITY, UT)
AIR MINOR (AIRS/AFS) COMPLIANCE ACTIVITY (Tracking inspections of insecticide, fungicide, and rodenticide, and toxic substances) Small Quantity Generators, between 100 kg and 1000 kg of hazardous waste/month (Resource Conservation and Recovery Act (tracking hazardous waste)) - notification Business SIC classification: GENERAL MEDICAL AND SURGICAL HOSPITALS Organizations: SISTERS OF THE HOLY CROSS ORDER (CONTACT/OWNER)
BONANZA CLEANERS (702 SOUTH 700 EAST in SALT LAKE CITY, UT)
(Resource Conservation and Recovery Act (tracking hazardous waste)) Organizations: KERRY JACKSON (CONTACT/OWNER)
FENDALL ICE CREAM COMPANY (470 SOUTH 700 EAST in SALT LAKE CITY, UT)
AIR MINOR (AIRS/AFS) ENFORCEMENT/COMPLIANCE ACTIVITY (Integrated Compliance Information System) Business SIC classification: ICE CREAM AND FROZEN DESSERTS; EATING PLACES
HALE'S MARKET (511 EAST 500 SOUTH in SALT LAKE CITY, UT)
AIR MINOR (AIRS/AFS) ENFORCEMENT/COMPLIANCE ACTIVITY (Integrated Compliance Information System) Business SIC classification: GROCERY STORES
INTERWEST ENDOCRINE LABORATORIES (857 EAST 200 SOUTH SUITE 103 in SALT LAKE CITY, UT)
CHEVRON USA INC 72872 NOLAN SLAUGH (210 SOUTH 700 EAST in SALT LAKE CITY, UT)
Conditionally Exempt Small Quantity Generators, less than 100 kg/month of hazardous waste (Resource Conservation and Recovery Act (tracking hazardous waste)) - notification
HARRIS APARTMENTS (836 SOUTH 500 EAST in SALT LAKE CITY, UT)
ENFORCEMENT/COMPLIANCE ACTIVITY (Integrated Compliance Information System) COMPLIANCE ACTIVITY (Tracking inspections of insecticide, fungicide, and rodenticide, and toxic substances) Business SIC classification: OPERATORS OF APARTMENT BUILDINGS
Housing units lacking complete plumbing facilities: 1.4% Housing units lacking complete kitchen facilities: 1.2%
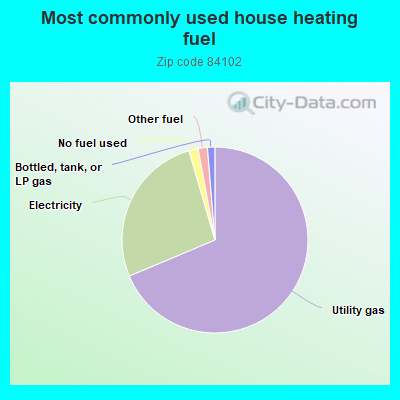
68.6%Utility gas
26.8%Electricity
1.6%No fuel used
1.6%Other fuel
1.3%Bottled, tank, or LP gas
Population in 1990: 15,367. Population change in the 1990s: +2,057 (+13.4%).
Place of birth for U.S.-born residents:
This state: 7,363
Northeast: 1,313
Midwest: 2,049
South: 1,788
West: 4,602
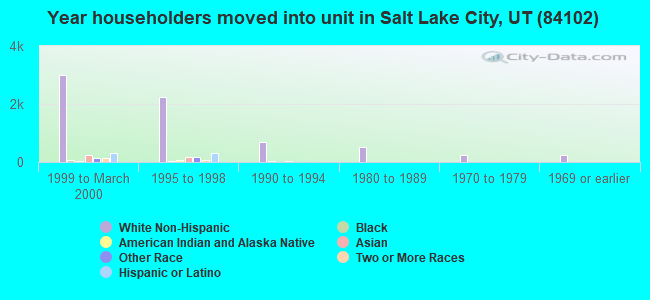
27% of the 84102 zip code residents lived in the same house 5 years ago. Out of people who lived in different houses, 52% lived in this county. Out of people who lived in different counties, 50% lived in Utah.
76% of the 84102 zip code residents lived in the same house 1 year ago. Out of people who lived in different houses, 58% moved from this county. Out of people who lived in different houses, 12% moved from different county within same state. Out of people who lived in different houses, 20% moved from different state. Out of people who lived in different houses, 5% moved from abroad.
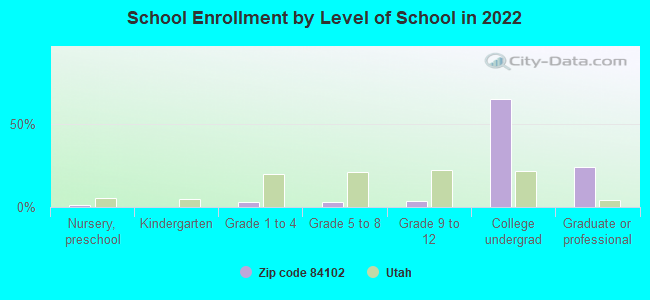
Private vs. public school enrollment:
Students in private schools in grades 1 to 8 (elementary and middle school): 45
Here:
12.2%
Utah:
7.2%
Students in private schools in grades 9 to 12 (high school): 27
Here:
10.7%
Utah:
5.3%
Students in private undergraduate colleges: 302
Here:
7.0%
Utah:
26.7%
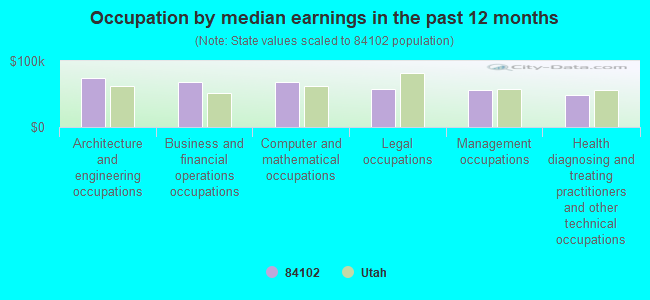
Occupation by median earnings in the past 12 months ($)
74,783Architecture and engineering occupations
68,054Business and financial operations occupations
67,644Computer and mathematical occupations
57,557Legal occupations
56,023Management occupations
47,952Health diagnosing and treating practitioners and other technical occupations
Companies with biggest federal contracts located in this zip code (SALT LAKE CITY, UT):
SINCLAIR OIL CORPORATION (550E SOUTH TEMPLE) : $92,889,271 in 6 contractsfrom 2000 to 2005
Contracts for Liquid Propellants and Fuels, Petroleum Base by Defense Logistics Agency Signed by year:2000: $1,015,065; 2001: $31,862,593; 2002: $18,649,748; 2003: $0; 2004: $0; 2005: $41,361,865; 2006: $0.
Biggest contracts:
$41,361,865 with Defense Logistics Agency for Liquid Propellants and Fuels, Petroleum Base. Taking place in WY. Signed on 2005-09-13. Completion date: 2006-10-30.
$31,783,333 with Defense Logistics Agency for Liquid Propellants and Fuels, Petroleum Base. Signed on 2001-09-21. Completion date: 2002-10-30.
$18,649,748 with Defense Logistics Agency for Liquid Propellants and Fuels, Petroleum Base. Taking place in WY. Signed on 2002-09-06. Completion date: 2003-09-30.
$1,015,065, same as above.Signed on 2000-10-10. Completion date: 2001-01-31.
BLACKSMITH MANAGEMENT GROUP (510 S 600 E; small business) : $38,039,435 in 91 contractsfrom 2002 to 2006
Contracts for Construction of Structures and Facilities -- Other Industrial Buildings, Construction of Structures and Facilities -- Other Administrative Facilities and Service Buildings, Maintenance, Repair or Alteration of Real Property -- Other Administrative Facilities and Service Buildings, Maintenance, Repair or Alteration of Real Property -- Other Non-Building Facilities, and moreby Army, National Park Service, Air Force, U.S. Army Corps of Engineers - civil program financing only, and others Signed by year:2000: $0; 2001: $0; 2002: $15,698,099; 2003: $6,819,248; 2004: $14,541,534; 2005: $768,375; 2006: $212,179.
Biggest contracts:
$8,792,892 with Army for Construction of Structures and Facilities -- Other Industrial Buildings. Signed on 2002-03-26. Completion date: 2004-03-26.
$8,089,588 with Army for Construction of Structures and Facilities -- Other Administrative Facilities and Service Buildings. Taking place in TN. Signed on 2004-03-31. Completion date: 2007-01-30.
$6,062,500 with National Park Service for Construction of Structures and Facilities -- Other Administrative Facilities and Service Buildings. Taking place in AZ. Signed on 2004-06-09. Completion date: 2005-06-30.
$4,063,700 with Air Force for Maintenance, Repair or Alteration of Real Property -- Other Administrative Facilities and Service Buildings. Signed on 2003-03-04. Completion date: 2004-03-01.
HK SYSTEMS, INC (515 EAST 100 SOUTH; small business) : $9,514,338 in 62 contractsfrom 1999 to 2006
Contracts for Winches, Hoists, Cranes, and Derricks, Maintenance, Repair and Rebuilding of Equipment -- Materials Handling Equipment, Miscellaneous Materials Handling Equipment, Material Handling Equipment, Nonself-Propelled, and moreby Defense Logistics Agency, Army, Navy, Air Force, and others Signed by year:2000: $734,674; 2001: $1,917,033; 2002: $3,489,202; 2003: $1,003,262; 2004: $994,860; 2005: $1,255,890; 2006: $52,958.
Biggest contracts:
$3,222,376 with Defense Logistics Agency for Winches, Hoists, Cranes, and Derricks. Signed on 2002-06-21. Completion date: 2003-01-19.
$898,336 with Army for Maintenance, Repair and Rebuilding of Equipment -- Materials Handling Equipment. Taking place in TX. Signed on 2005-12-22. Completion date: 2009-12-31.
$781,000, same as above.Signed on 2004-12-30. Completion date: 2009-12-31.
$626,000, same as above.Signed on 2003-12-17. Completion date: 2004-12-31.
PSC DEVELOPMENT COMPANY, INC (132 SOUTH 600 EAST) : $8,713,030 in 131 contractsfrom 2001 to 2006
Contracts for Technical Assistance, Housing and Community Development Studies by Air Force Signed by year:2000: $0; 2001: $1,422,151; 2002: $2,505,457; 2003: $2,227,784; 2004: $1,803,382; 2005: $592,128; 2006: $162,128.
Biggest contracts:
$920,315 with Air Force for Technical Assistance. Signed on 2003-12-18. Completion date: 2005-03-31.
$534,410, same as above.Signed on 2002-06-26. Completion date: 2004-02-10.
$464,387, same as above.Signed on 2004-08-23. Completion date: 2005-03-31.
$399,970, same as above.Signed on 2005-04-11. Completion date: 2006-09-30.
COGNITECH CORPORATION (1060 EAST 100 SOUTH; small business) : $2,419,903 in 15 contractsfrom 2000 to 2004
Contracts for Other Research and Development -- Basic Research (R&D), Defense Electronics and Communication Equipment -- Management and Support (R&D), Defense Electronics and Communication Equipment -- Operational Systems Development (R&D), Miscellaneous Defense Hard Goods -- Operational Systems Development (R&D), and moreby National Institutes of Health, Air Force, Navy, Army, and others Signed by year:2000: $100,000; 2001: $675,000; 2002: $1,050,000; 2003: $524,904; 2004: $69,999; 2005: $0; 2006: $0.
Biggest contracts:
$375,017 with National Institutes of Health for Other Research and Development -- Basic Research (R&D). Signed on 2003-06-15. Completion date: 2004-09-15.
$375,000, same as above.Signed on 2002-09-15. Completion date: 2004-09-15.
$375,000 with Air Force for Defense Electronics and Communication Equipment -- Management and Support (R&D). Signed on 2002-04-25. Completion date: 2003-08-18.
$375,000, same as above.Signed on 2001-04-11. Completion date: 2001-03-20.
RICHINS INC (479 SOUTH 7TH EAST) : $1,496,568 in 7 contractsfrom 2000 to 2002
Contracts for Maintenance, Repair and Rebuilding of Equipment -- Miscellaneous, Installation of Equipment -- Furniture by Air Force Signed by year:2000: $25,231; 2001: $49,483; 2002: $1,421,854; 2003: $0; 2004: $0; 2005: $0; 2006: $0.
Biggest contracts:
$489,380 with Air Force for Maintenance, Repair and Rebuilding of Equipment -- Miscellaneous. Signed on 2002-09-30. Completion date: 2003-08-31.
$339,970, same as above.Signed on 2002-09-27. Completion date: 2002-12-31.
$253,479, same as above.Signed on 2002-09-30. Completion date: 2002-12-30.
$173,592, same as above.Signed on 2002-09-30. Completion date: 2003-03-31.
ALSCO INC (505 E SOUTH TEMPLE) : $464,168 in 36 contractsfrom 2001 to 2006
Contracts for Miscellaneous Service and Trade Equipment, Laundry and DryCleaning Services, , Carpet Laying and Cleaning, and moreby Army, National Oceanic and Atmospheric Administration/Under Secretary for Oceans and Atmosphere, National Institute of Standards and Technology, Department of Defense, and others Signed by year:2000: $0; 2001: $65,021; 2002: $105,281; 2003: $183,977; 2004: $51,416; 2005: $60,532; 2006: -$2,059.
Biggest contracts:
$87,000 with Army for Miscellaneous Service and Trade Equipment. Taking place in GA. Signed on 2003-05-16. Completion date: 2004-04-30.
$65,021, same as above.Signed on 2002-05-01. Completion date: 2003-04-30.
$65,021, same as above.Signed on 2001-07-10. Completion date: 2004-04-30.
$37,740 with National Oceanic and Atmospheric Administration/Under Secretary for Oceans and Atmosphere for Laundry and DryCleaning Services. Taking place in CO. Signed on 2003-10-01. Completion date: 2004-09-30.
XEROX CORPORATION (675 E 500 S)
$181,000 with Air Force for Maintenance, Repair and Rebuilding of Equipment -- Miscellaneous. Signed on 1999-12-06. Completion date: 2000-09-30.
MODERN DISPLAY SERVICE INC (424 SOUTH 700 EAST; small business) : $64,087 in 8 contractsfrom 2002 to 2006
Contracts for Construction of Structures and Facilities -- Exhibit Design (Non-Building), Lease or Rental of Equipment -- Training Aids and Devices, Facilities Operations Support Services, Draperies, Awnings, and Shades, and moreby Army Signed by year:2000: $0; 2001: $0; 2002: $12,812; 2003: $4,451; 2004: $23,513; 2005: $12,388; 2006: $10,923.
Biggest contracts:
$12,812 with Army for Construction of Structures and Facilities -- Exhibit Design (Non-Building). Signed on 2002-04-12. Completion date: 2002-04-15.
$12,388 with Army for Lease or Rental of Equipment -- Training Aids and Devices. Signed on 2005-03-02. Completion date: 2005-04-04.
$10,923 with Army for Facilities Operations Support Services. Signed on 2006-03-13. Completion date: 2006-04-04.
$10,768 with Army for Draperies, Awnings, and Shades. Signed on 2004-09-28. Completion date: 2004-11-17.
SALT LAKE CITY CHASE SUITES (765 E 400 S; small business)
$3,842 with Army for Lodging - Hotel/Motel. Signed on 2005-09-01. Completion date: 2005-09-23.
Top industries in this zip code by the number of employees in 2005:
2002 - 2018 National Fire Incident Reporting System (NFIRS) incidents
According to the data from the years 2002 - 2018 the average number of fire incidents per year is 38. The highest number of fires - 70 took place in 2008, and the least - 12 in 2017. The data has a declining trend.
When looking into fire subcategories, the most reports belonged to: Structure Fires (43.4%), and Outside Fires (38.8%).
Fire incident types reported to NFIRS in Zip Code 84102


 Nearest zip codes: 84111, 84105, 84112, 84144, 84113, 84101.


 According to the data from the years 2002 - 2018 the average number of fire incidents per year is 38. The highest number of fires - 70 took place in 2008, and the least - 12 in 2017. The data has a declining trend.
 When looking into fire subcategories, the most reports belonged to: Structure Fires (43.4%), and Outside Fires (38.8%).