Estimated zip code population in 2022: 23,470 Zip code population in 2010: 22,140 Zip code population in 2000: 22,363
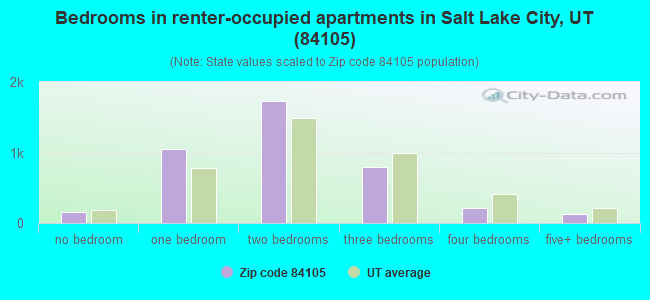
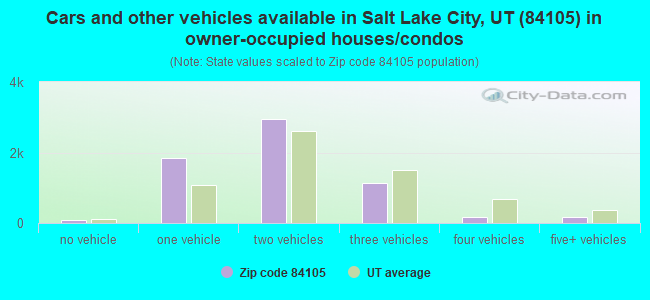
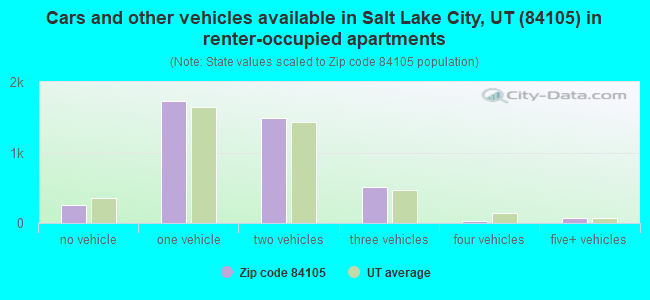
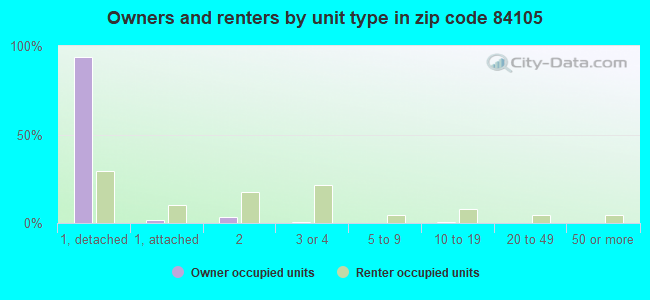
Houses and condos: 11,223 Renter-occupied apartments: 4,092
% of renters here:
39%
State:
29%
March 2022 cost of living index in zip code 84105: 95.6 (near average, U.S. average is 100)
Land area: 3.0 sq. mi. Water area: 0.0 sq. mi.
Population density: 7,721 people per square mile
(high).
OSM Map
General Map
Google Map
MSN Map
OSM Map
General Map
Google Map
MSN Map
OSM Map
General Map
Google Map
MSN Map
OSM Map
General Map
Google Map
MSN Map
Please wait while loading the map...
Real estate property taxes paid for housing units in 2022:
This zip code:
0.4% ($3,243)
Utah:
0.5% ($2,376)
Median real estate property taxes paid for housing units with mortgages in 2022: $3,146 (0.4%) Median real estate property taxes paid for housing units with no mortgage in 2022: $3,428 (0.5%)
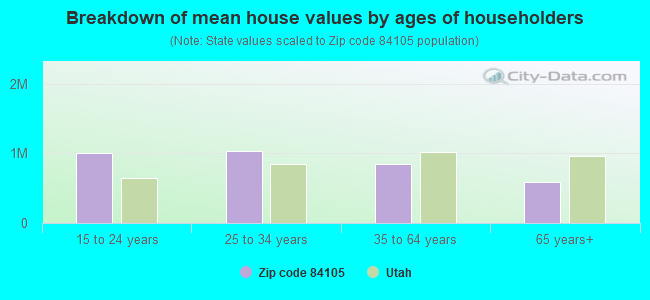
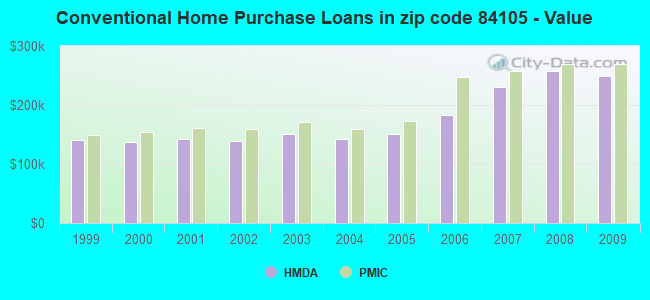
Estimated median house/condo value in 2022: $736,105
84105:
$736,105
Utah:
$499,500
According to our research of Utah and other state lists, there were 33 registered sex offenders living in 84105 zip code as of April 27, 2024. The ratio of all residents to sex offenders in zip code 84105 is 675 to 1. The ratio of registered sex offenders to all residents in this zip code is lower than the state average.
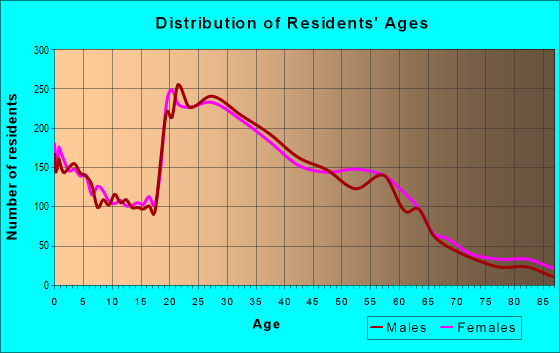
Median resident age:
This zip code:
36.0 years
Utah median age:
32.1 years
Average household size:
This zip code:
2.2 people
Utah:
3.0 people
Averages for the 2020 tax year for zip code 84105, filed in 2021:
Average Adjusted Gross Income (AGI) in 2020: $97,513 (Individual Income Tax Returns)
Here:
$97,513
State:
$81,660
Salary/wage: $81,881 (reported on 86.4% of returns)
Here:
$81,881
State:
$63,027
(% of AGI for various income ranges: 1274.2% for AGIs below $25k, 3921.9% for AGIs $25k-50k, 7008.8% for AGIs $50k-75k, 10624.5% for AGIs $75k-100k, 20511.7% for AGIs $100k-200k, 76735.0% for AGIs over 200k)
Taxable interest for individuals: $1,546 (reported on 38.5% of returns)
This zip code:
$1,546
Utah:
$2,255
(% of AGI for various income ranges: 18.1% for AGIs below $25k, 25.2% for AGIs $25k-50k, 44.4% for AGIs $50k-75k, 54.4% for AGIs $75k-100k, 176.6% for AGIs $100k-200k, 737.6% for AGIs over 200k)
Ordinary dividends: $5,730 (reported on 30.5% of returns)
Here:
$5,730
State:
$7,362
(% of AGI for various income ranges: 38.6% for AGIs below $25k, 62.4% for AGIs $25k-50k, 123.3% for AGIs $50k-75k, 178.2% for AGIs $75k-100k, 474.0% for AGIs $100k-200k, 2390.0% for AGIs over 200k)
Net capital gain/loss in AGI: +$23,298 (reported on 29.0% of returns)
Here:
+$23,298
State:
+$43,433
(% of AGI for various income ranges: 35.5% for AGIs below $25k, 79.3% for AGIs $25k-50k, 101.2% for AGIs $50k-75k, 264.7% for AGIs $75k-100k, 780.6% for AGIs $100k-200k, 15027.9% for AGIs over 200k)
Profit/loss from business: +$15,836 (reported on 17.8% of returns)
Here:
+$15,836
State:
+$9,957
(% of AGI for various income ranges: 124.3% for AGIs below $25k, 177.4% for AGIs $25k-50k, 279.3% for AGIs $50k-75k, 456.2% for AGIs $75k-100k, 667.0% for AGIs $100k-200k, 2923.8% for AGIs over 200k)
Taxable individual retirement arrangement distribution: $23,120 (reported on 7.6% of returns)
84105:
$23,120
Utah:
$21,167
(% of AGI for various income ranges: 39.7% for AGIs below $25k, 86.5% for AGIs $25k-50k, 164.0% for AGIs $50k-75k, 303.6% for AGIs $75k-100k, 600.8% for AGIs $100k-200k, 1618.3% for AGIs over 200k)
Self-employed (Keogh) retirement plans: $19,275 (reported on 1.1% of returns)
84105:
$19,275
Utah:
$29,069
(% of AGI for various income ranges: 23.2% for AGIs $50k-75k, 57.7% for AGIs $100k-200k, 335.5% for AGIs over 200k)
Total itemized deductions: $32,065 (reported on 14.9% of returns)
Here:
$32,065
State:
$41,056
(% of AGI for various income ranges: 55.7% for AGIs below $25k, 120.2% for AGIs $25k-50k, 325.5% for AGIs $50k-75k, 674.1% for AGIs $75k-100k, 1468.1% for AGIs $100k-200k, 6222.1% for AGIs over 200k)
Charity contributions: $11,818 (reported on 12.0% of returns)
Here:
$11,818
State:
$22,261
(% of AGI for various income ranges: 2.8% for AGIs below $25k, 17.2% for AGIs $25k-50k, 46.9% for AGIs $50k-75k, 109.5% for AGIs $75k-100k, 316.4% for AGIs $100k-200k, 2599.0% for AGIs over 200k)
Taxes paid: $8,333 (reported on 14.9% of returns)
84105:
$8,333
State:
$7,985
(% of AGI for various income ranges: 6.7% for AGIs below $25k, 22.7% for AGIs $25k-50k, 92.7% for AGIs $50k-75k, 218.5% for AGIs $75k-100k, 477.6% for AGIs $100k-200k, 1346.7% for AGIs over 200k)
Earned income credit: $1,260 (reported on 6.8% of returns)
Here:
$1,260
State:
$2,169
(% of AGI for various income ranges: 29.1% for AGIs below $25k, 20.4% for AGIs $25k-50k)
Percentage of individuals using paid preparers for their 2020 taxes: 94.5%
Here:
94%
State:
94%
(% for various income ranges: 92.7% for AGIs below $25k, 94.7% for AGIs $25k-50k, 95.4% for AGIs $50k-75k, 94.8% for AGIs $75k-100k, 94.6% for AGIs $100k-200k, 96.6% for AGIs over 200k)
Averages for the 2012 tax year for zip code 84105, filed in 2013:
Average Adjusted Gross Income (AGI) in 2012: $71,074 (Individual Income Tax Returns)
Here:
$71,074
State:
$60,327
Salary/wage: $58,061 (reported on 88.6% of returns)
Here:
$58,061
State:
$48,762
(% of AGI for various income ranges: 81.0% for AGIs below $25k, 84.7% for AGIs $25k-50k, 83.5% for AGIs $50k-75k, 80.8% for AGIs $75k-100k, 81.6% for AGIs $100k-200k, 51.6% for AGIs over 200k)
Taxable interest for individuals: $975 (reported on 40.3% of returns)
This zip code:
$975
Utah:
$1,534
(% of AGI for various income ranges: 1.0% for AGIs below $25k, 0.5% for AGIs $25k-50k, 0.5% for AGIs $50k-75k, 0.5% for AGIs $75k-100k, 0.6% for AGIs $100k-200k, 0.5% for AGIs over 200k)
Ordinary dividends: $4,251 (reported on 24.2% of returns)
Here:
$4,251
State:
$5,711
(% of AGI for various income ranges: 1.6% for AGIs below $25k, 1.1% for AGIs $25k-50k, 1.1% for AGIs $50k-75k, 1.2% for AGIs $75k-100k, 1.6% for AGIs $100k-200k, 1.6% for AGIs over 200k)
Net capital gain/loss in AGI: +$8,851 (reported on 20.7% of returns)
Here:
+$8,851
State:
+$23,734
(% of AGI for various income ranges: 0.4% for AGIs below $25k, 0.3% for AGIs $25k-50k, 0.8% for AGIs $50k-75k, 0.8% for AGIs $75k-100k, 1.9% for AGIs $100k-200k, 5.7% for AGIs over 200k)
Profit/loss from business: +$14,047 (reported on 17.7% of returns)
Here:
+$14,047
State:
+$8,845
(% of AGI for various income ranges: 7.8% for AGIs below $25k, 3.5% for AGIs $25k-50k, 3.0% for AGIs $50k-75k, 3.1% for AGIs $75k-100k, 2.8% for AGIs $100k-200k, 3.5% for AGIs over 200k)
Taxable individual retirement arrangement distribution: $14,261 (reported on 7.6% of returns)
84105:
$14,261
Utah:
$15,565
(% of AGI for various income ranges: 2.0% for AGIs below $25k, 1.4% for AGIs $25k-50k, 1.6% for AGIs $50k-75k, 1.7% for AGIs $75k-100k, 2.0% for AGIs $100k-200k, 1.0% for AGIs over 200k)
Self-employment retirement plans: $21,289 (reported on 0.8% of returns)
84105:
$21,289
Utah:
$22,655
(% of AGI for various income ranges: 0.2% for AGIs $25k-50k, 0.2% for AGIs $100k-200k, 0.5% for AGIs over 200k)
Total itemized deductions: $22,024 (17% of AGI, reported on 39.2% of returns)
Here:
$22,024
State:
$25,197
Here:
16.8% of AGI
State:
22.4% of AGI
(% of AGI for various income ranges: 8.2% for AGIs below $25k, 10.2% for AGIs $25k-50k, 14.8% for AGIs $50k-75k, 14.7% for AGIs $75k-100k, 15.9% for AGIs $100k-200k, 8.8% for AGIs over 200k)
Charity contributions: $4,293 (reported on 32.6% of returns)
Here:
$4,293
State:
$8,502
(% of AGI for various income ranges: 0.8% for AGIs below $25k, 1.3% for AGIs $25k-50k, 2.1% for AGIs $50k-75k, 2.4% for AGIs $75k-100k, 2.4% for AGIs $100k-200k, 1.9% for AGIs over 200k)
Taxes paid: $8,041 (reported on 39.2% of returns)
84105:
$8,041
State:
$7,001
(% of AGI for various income ranges: 1.5% for AGIs below $25k, 2.5% for AGIs $25k-50k, 4.5% for AGIs $50k-75k, 4.9% for AGIs $75k-100k, 6.0% for AGIs $100k-200k, 4.3% for AGIs over 200k)
Earned income credit: $1,504 (reported on 11.3% of returns)
Here:
$1,504
State:
$2,259
(% of AGI for various income ranges: 3.0% for AGIs below $25k, 0.5% for AGIs $25k-50k)
Percentage of individuals using paid preparers for their 2012 taxes: 45.3%
Here:
45%
State:
51%
(% for various income ranges: 38.8% for AGIs below $25k, 40.9% for AGIs $25k-50k, 47.4% for AGIs $50k-75k, 48.5% for AGIs $75k-100k, 55.9% for AGIs $100k-200k, 73.5% for AGIs over 200k)
Averages for the 2004 tax year for zip code 84105, filed in 2005:
Average Adjusted Gross Income (AGI) in 2004: $46,969 (Individual Income Tax Returns)
Here:
$46,969
State:
$45,498
Salary/wage: $43,784 (reported on 87.9% of returns)
Here:
$43,784
State:
$38,975
(% of AGI for various income ranges: 192.3% for AGIs below $10k, 82.1% for AGIs $10k-25k, 88.0% for AGIs $25k-50k, 86.8% for AGIs $50k-75k, 85.1% for AGIs $75k-100k, 72.6% for AGIs over 100k)
Taxable interest for individuals: $925 (reported on 49.5% of returns)
This zip code:
$925
Utah:
$1,445
(% of AGI for various income ranges: 9.3% for AGIs below $10k, 1.4% for AGIs $10k-25k, 0.9% for AGIs $25k-50k, 0.9% for AGIs $50k-75k, 1.0% for AGIs $75k-100k, 0.8% for AGIs over 100k)
Taxable dividends: $2,922 (reported on 25.8% of returns)
Here:
$2,922
State:
$3,152
(% of AGI for various income ranges: 10.6% for AGIs below $10k, 1.4% for AGIs $10k-25k, 0.8% for AGIs $25k-50k, 0.8% for AGIs $50k-75k, 1.0% for AGIs $75k-100k, 2.5% for AGIs over 100k)
Net capital gain/loss: +$7,992 (reported on 22.4% of returns)
Here:
+$7,992
State:
+$14,059
(% of AGI for various income ranges: -4.9% for AGIs below $10k, 0.3% for AGIs $10k-25k, 0.4% for AGIs $25k-50k, 0.7% for AGIs $50k-75k, 1.8% for AGIs $75k-100k, 8.8% for AGIs over 100k)
Profit/loss from business: +$9,635 (reported on 17.0% of returns)
Here:
+$9,635
State:
+$6,903
(% of AGI for various income ranges: 9.3% for AGIs below $10k, 5.2% for AGIs $10k-25k, 2.6% for AGIs $25k-50k, 1.8% for AGIs $50k-75k, 2.7% for AGIs $75k-100k, 4.5% for AGIs over 100k)
Profit/loss from farming: +$2,800 (reported on 0.1% of returns)
Here:
+$2,800
State:
-$6,601
IRA payment deduction: $2,834 (reported on 3.0% of returns)
84105:
$2,834
Utah:
$2,970
(% of AGI for various income ranges: 0.7% for AGIs below $10k, 0.3% for AGIs $10k-25k, 0.3% for AGIs $25k-50k, 0.2% for AGIs $50k-75k, 0.1% for AGIs $75k-100k, 0.1% for AGIs over 100k)
Self-employed pension: $11,717 (reported on 1.2% of returns)
Here:
$11,717
Utah:
$14,916
(% of AGI for various income ranges: 0.2% for AGIs $25k-50k, 0.1% for AGIs $50k-75k, 0.2% for AGIs $75k-100k, 0.5% for AGIs over 100k)
Total itemized deductions: $17,869 (22% of AGI, reported on 41.8% of returns)
Here:
$17,869
State:
$20,312
Here:
22.0% of AGI
State:
24.9% of AGI
(% of AGI for various income ranges: 31.8% for AGIs below $10k, 11.5% for AGIs $10k-25k, 13.9% for AGIs $25k-50k, 19.1% for AGIs $50k-75k, 18.4% for AGIs $75k-100k, 15.2% for AGIs over 100k)
Charity contributions deductions: $3,622 (4% of AGI, reported on 37.0% of returns)
Here:
$3,622
State:
$6,250
Here:
4.3% of AGI
State:
7.4% of AGI
(% of AGI for various income ranges: 2.3% for AGIs below $10k, 1.5% for AGIs $10k-25k, 2.0% for AGIs $25k-50k, 2.7% for AGIs $50k-75k, 2.8% for AGIs $75k-100k, 3.7% for AGIs over 100k)
Total tax: $7,185 (reported on 79.6% of returns)
84105:
$7,185
State:
$6,523
(% of AGI for various income ranges: 5.1% for AGIs below $10k, 4.8% for AGIs $10k-25k, 7.8% for AGIs $25k-50k, 9.5% for AGIs $50k-75k, 11.1% for AGIs $75k-100k, 18.1% for AGIs over 100k)
Earned income credit: $1,244 (reported on 10.3% of returns)
Here:
$1,244
State:
$1,703
Percentage of individuals using paid preparers for their 2004 taxes: 47.7%
Here:
48%
State:
53%
(% for various income ranges: 42.7% for AGIs below $10k, 46.5% for AGIs $10k-25k, 44.1% for AGIs $25k-50k, 52.0% for AGIs $50k-75k, 51.4% for AGIs $75k-100k, 60.7% for AGIs over 100k)
Likely homosexual households (counted as self-reported same-sex unmarried-partner households)
Lesbian couples: 0.3% of all households
Gay men: 0.1% of all households
Household received Food Stamps/SNAP in the past 12 months: 277 Household did not receive Food Stamps/SNAP in the past 12 months: 10,229
Women who had a birth in the past 12 months: 243 (183 now married, 56 unmarried) Women who did not have a birth in the past 12 months: 6,522 (2,580 now married, 3,962 unmarried)
Housing units in zip code 84105 with a mortgage: 4,248 (512 second mortgage, 54 home equity loan, 440 both second mortgage and home equity loan) Houses without a mortgage: 34
Median monthly owner costs for units with a mortgage: $2,128 Median monthly owner costs for units without a mortgage: $561
Residents with income below the poverty level in 2022:
This zip code:
8.3%
Whole state:
8.2%
Residents with income below 50% of the poverty level in 2022:
This zip code:
4.4%
Whole state:
4.3%
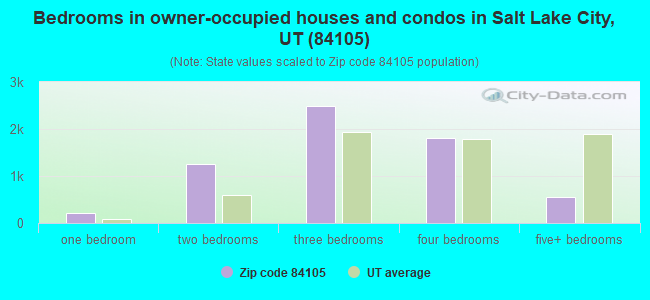
Median number of rooms in houses and condos:
Here:
7.2
State:
7.6
Median number of rooms in apartments:
Here:
4.2
State:
4.3
Notable locations in this zip code not listed on our city pages
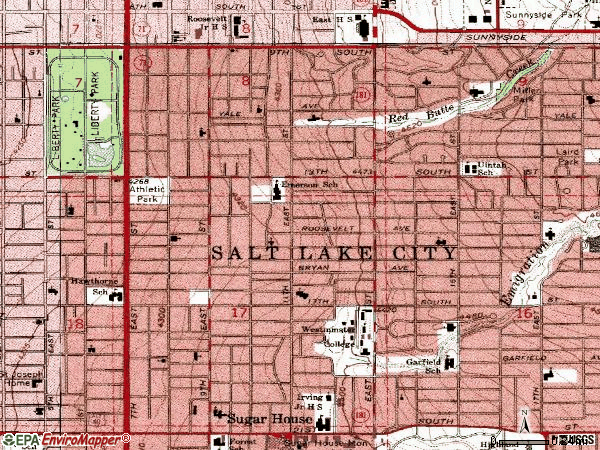
Notable locations in zip code 84105: Bill and Vieve Gore School of Buisness (A), Carleson Hall (B), Converse Circle (C), Converse Hall (D), Cornell Duplex (E), Coyner House (F), Dick Science Building (G), Dolores Dore Eccles Ceramic Center (H), Dolores Dore Eccles Health Wellness and Athletic Center (I), Dolores Dore Eccles Plaza (J), Duddy Duplex (K), Foster Hall (L), Giovale Library (M), Hoffman House (N), Hogle Hall (O), Jewett Center for the Performing Arts and Emma Eccles Jones Conservatory (P), Kim T Adamson Alumni House (Q), Malouf Hall (R), Museum of Utah Folk Art (S), Nightingale Hall (T). Display/hide their locations on the map
Churches in zip code 84105 include: The Church of Jesus Christ of Latter Day Saints (A), New Song Church of Salt Lake (B), Liberty Park Foursquare Church (C), Bethel Baptist Church (D), Church of Christ (E), First Christian Reformed Church (F), Full Gospel Assembly Church (G), Indian Christian Center (H), The Church of Jesus Christ of Latter Day Saints (I). Display/hide their locations on the map
Tourist attractions (not listed on the city page) : Liberty Park - Amusement Park and Cocessions (Amusement & Theme Parks; 900 South 700 East), Go Utah Travel (1390 South 1100 East Suite 201), Ultimate Vacations (1568 South 1100 East), The Tracy Aviary (Arcades & Amusements; 589 E 1300 S), Clawson Shields Tours (Tours & Charters; 1495 East 900 South), Mountain West Travel (Tours & Charters; 1390 South 1100 East Suite 104), Elggren John E Jr & Mary (Tours & Charters; 1495 East 900 South).
3,047 married couples with children.
849 single-parent households (257 men, 592 women).
90.3% of residents of 84105 zip code speak English at home.
2.7% of residents speak Spanish at home (79% very well, 21% well).
3.9% of residents speak other Indo-European language at home (87% very well, 11% well, 2% not at all).
2.4% of residents speak Asian or Pacific Island language at home (62% very well, 30% well, 7% not well, 1% not at all).
0.4% of residents speak other language at home (63% very well, 9% well, 28% not well).
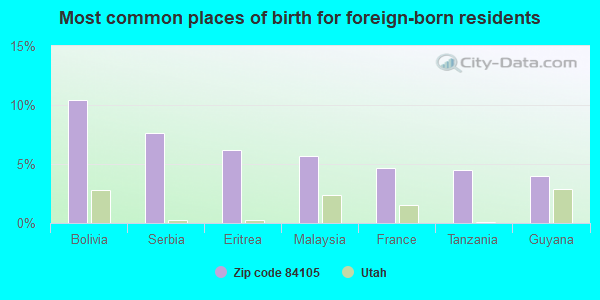
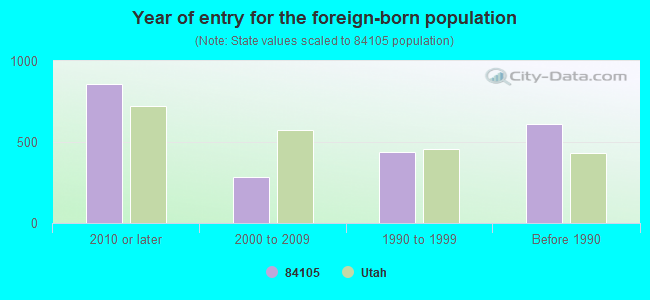
Foreign born population: 1,840 (7.8%) (59.0% of them are naturalized citizens)
Major facilities with environmental interests located in this zip code:
EAST HIGH SCHOOL (840 S 1300 E in SALT LAKE CITY, UT)
STATE MASTER (Utah compliance and permitting operations) - UST DATABASE-4, UNDERGROUND STORAGE TANK PROGRAM ENFORCEMENT/COMPLIANCE ACTIVITY (Integrated Compliance Information System) COMPLIANCE ACTIVITY (Tracking inspections of insecticide, fungicide, and rodenticide, and toxic substances) Conditionally Exempt Small Quantity Generators, less than 100 kg/month of hazardous waste (Resource Conservation and Recovery Act (tracking hazardous waste)) - notification Business SIC classification: ELEMENTARY AND SECONDARY SCHOOLS Organizations: SALT LAKE SCHOOL DISTRICT (CONTACT/OWNER)
Alternative names: EAST HS
EMERSON ELEM SCH (1017 E HARRISON AVE in SALT LAKE CITY, UT)
(National Center for Education Statistics) - STATE ID-36 136 Organizations: SALT LAKE CITY SCHOOL DISTRICT (SCHOOL DISTRICT)
HAWTHORNE ELEM SCH (1675 S 600 E in SALT LAKE CITY, UT)
(National Center for Education Statistics) - STATE ID-36 176 Organizations: SALT LAKE CITY SCHOOL DISTRICT (SCHOOL DISTRICT)
EMIGRATION CREEK WATER DUMP (LOCATION NOT A FACILITY in SALT LAKE CITY, UT)
National Pollutant Discharge Elimination System NON-MAJOR (Tracking pollutant discharge elimination systems) - permit Business SIC classification: NONCLASSIFIABLE ESTABLISHMENTS
LEAVES BLOWN INTO STREET (1840 SOUTH 1300 EAST in SALT LAKE CITY, UT)
National Pollutant Discharge Elimination System NON-MAJOR (Tracking pollutant discharge elimination systems) - permit Business SIC classification: NONCLASSIFIABLE ESTABLISHMENTS
JIFFY LUBE (2097 SOUTH 1200 EAST in SALT LAKE CITY, UT)
Small Quantity Generators, between 100 kg and 1000 kg of hazardous waste/month (Resource Conservation and Recovery Act (tracking hazardous waste)) - notification Organizations: OIL WELL INC (CONTACT/OWNER)
1129 LAKE ST (1129 LAKE ST in SALT LAKE CITY, UT)
ENFORCEMENT/COMPLIANCE ACTIVITY (Integrated Compliance Information System)
1193 KENSINGTON AVE (1193 KENSINGTON AVE in SALE LAKE CITY, UT)
ENFORCEMENT/COMPLIANCE ACTIVITY (Integrated Compliance Information System)
1257 -1265 LAKE STREET (1257-1265 LAKE STREET in SALT LAKE CITY, UT)
ENFORCEMENT/COMPLIANCE ACTIVITY (Integrated Compliance Information System)
1510 EAST GLEN ARBOR ST (1510 EAST GLEN ARBOR ST in SLAT LAKE CITY, UT)
ENFORCEMENT/COMPLIANCE ACTIVITY (Integrated Compliance Information System)
523 EAST BROWNING AVE (523 EAST BROWNING AVE in SALT LAKE CITY, UT)
ENFORCEMENT/COMPLIANCE ACTIVITY (Integrated Compliance Information System)
527 EAST BROWNING AVE (527 EAST BROWNING AVE in SALT LAKE CITY, UT)
ENFORCEMENT/COMPLIANCE ACTIVITY (Integrated Compliance Information System)
751,753,755 PRINCETON AVE (751,753,755 PRINCETON AVE in SALT LAKE CITY, UT)
ENFORCEMENT/COMPLIANCE ACTIVITY (Integrated Compliance Information System)
Housing units lacking complete plumbing facilities: 0.3% Housing units lacking complete kitchen facilities: 0.7%
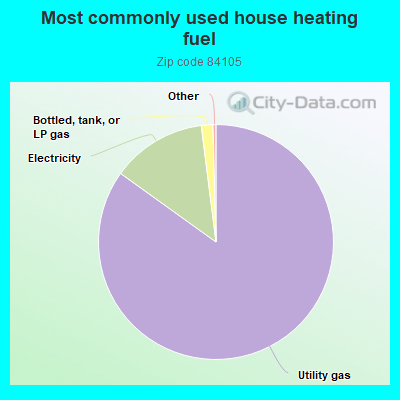
85.0%Utility gas
13.1%Electricity
1.6%Bottled, tank, or LP gas
Population in 1990: 22,228. Population change in the 1990s: +135 (+0.6%).
Place of birth for U.S.-born residents:
This state: 11,328
Northeast: 1,879
Midwest: 2,061
South: 1,898
West: 4,287
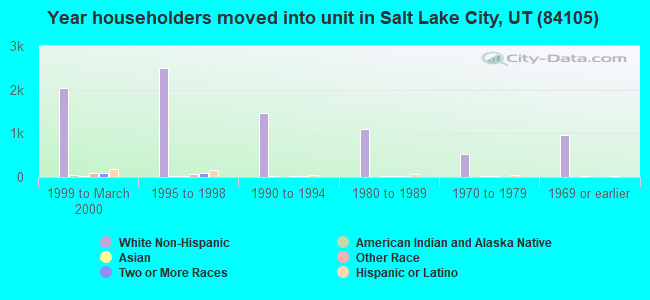
50% of the 84105 zip code residents lived in the same house 5 years ago. Out of people who lived in different houses, 57% lived in this county. Out of people who lived in different counties, 50% lived in Utah.
83% of the 84105 zip code residents lived in the same house 1 year ago. Out of people who lived in different houses, 51% moved from this county. Out of people who lived in different houses, 16% moved from different county within same state. Out of people who lived in different houses, 26% moved from different state. Out of people who lived in different houses, 5% moved from abroad.
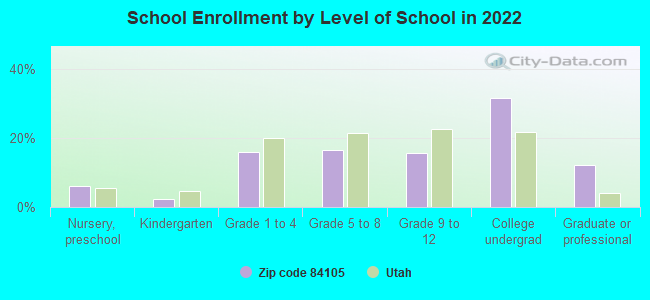
Private vs. public school enrollment:
Students in private schools in grades 1 to 8 (elementary and middle school): 371
Here:
20.7%
Utah:
7.2%
Students in private schools in grades 9 to 12 (high school): 88
Here:
10.3%
Utah:
5.3%
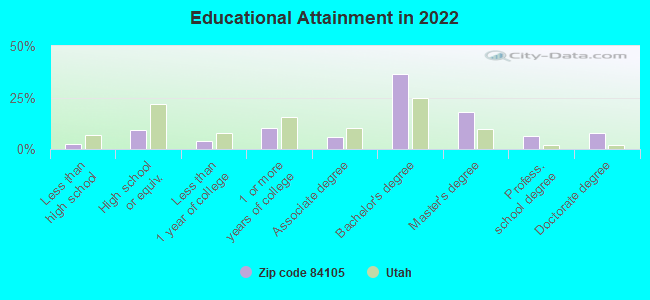
Students in private undergraduate colleges: 498
Here:
28.4%
Utah:
26.7%
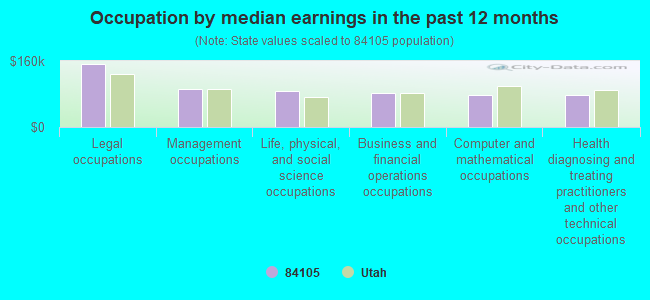
Occupation by median earnings in the past 12 months ($)
151,635Legal occupations
91,173Management occupations
86,413Life, physical, and social science occupations
81,492Business and financial operations occupations
78,697Computer and mathematical occupations
76,868Health diagnosing and treating practitioners and other technical occupations
Companies with federal contracts located in this zip code (SALT LAKE CITY, UT):
SHELEY, DAVID W (1145 PRINCETON AVE; small business)
$40,000 with Army for Other Natural Resources and Conservation Services. Signed on 2000-04-26. Completion date: 2000-06-23.
INTRADE, LTD (1399 SOUTH 700 EAST; small business) : $38,947 in 2 contractsfrom 2001 to 2003
$159,003 with Army for Miscellaneous Ship and Marine Equipment. Taking place in VA. Signed on 2001-09-20. Completion date: 2002-01-19.
-$120,056, same as above.Signed on 2003-04-08. Completion date: 2002-01-19.
RED ROCK ANALOG DESIGN (1218 EMERSON AVE; small business)
$18,150 with Army for Miscellaneous Electrical and Electronic Components. Signed on 2004-09-22. Completion date: 2004-10-07.
IGAGE (1545 S 1100 E #3; small business) : $6,154 in 2 contractsfrom 2002 to 2003
$3,506 with Army for ADP Software. Signed on 2003-09-17. Completion date: 2003-10-17.
$2,648 with U.S. Army Corps of Engineers - civil program financing only for ADP Software. Signed on 2002-09-18. Completion date: 2002-08-28.
JAYNE H DAVIS (1610 S 1200 E; small business)
$2,850 with National Institutes of Health for . Taking place in MD. Signed on 2006-02-10. Effective on 2006-02-09. Completion date: 2006-03-03.
Top industries in this zip code by the number of employees in 2005:
Educational Services: Colleges, Universities, and Professional Schools (500-999 employees: 1 establishment)
Professional, Scientific, and Technical Services: Research and Development in the Physical, Engineering, and Life Sciences (100-249: 1, 5-9: 1, 1-4: 1)
Administrative and Support and Waste Management and Remediation Services: Security Guards and Patrol Services (100-249: 1)
Health Care and Social Assistance: Offices of Dentists (10-19: 1, 5-9: 14, 1-4: 8)
Health Care and Social Assistance: Nursing Care Facilities (50-99: 1, 20-49: 1, 10-19: 1)
2002 - 2018 National Fire Incident Reporting System (NFIRS) incidents
According to the data from the years 2002 - 2018 the average number of fires per year is 42. The highest number of reported fire incidents - 63 took place in 2002, and the least - 16 in 2011. The data has a declining trend.
When looking into fire subcategories, the most reports belonged to: Outside Fires (42.5%), and Structure Fires (39.9%).
Fire incident types reported to NFIRS in Zip Code 84105


+$2,800
-$6,601
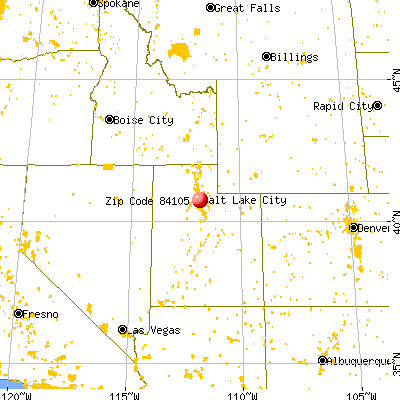
 Nearest zip codes: 84102, 84111, 84106, 84112, 84113, 84115.
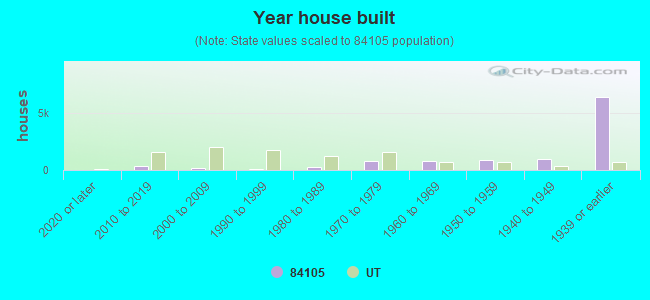


 According to the data from the years 2002 - 2018 the average number of fires per year is 42. The highest number of reported fire incidents - 63 took place in 2002, and the least - 16 in 2011. The data has a declining trend.
 When looking into fire subcategories, the most reports belonged to: Outside Fires (42.5%), and Structure Fires (39.9%).