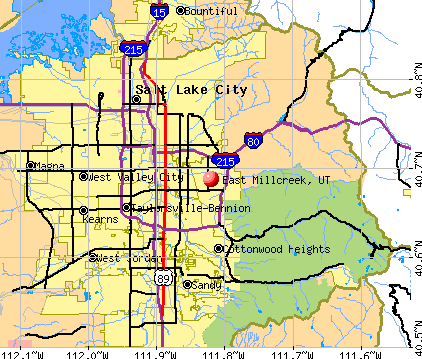
East Millcreek, Utah
East Millcreek
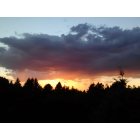
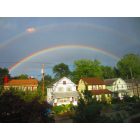
East Millcreek: Picture of Sunday Sunset.
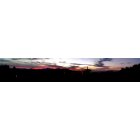
East Millcreek: Panoramic picture of Sunday Sunset.
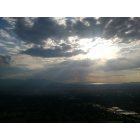
East Millcreek: Picture of Sunbreak through the clouds.
- add
your
Submit your own pictures of this place and show them to the world
- OSM Map
- General Map
- Google Map
- MSN Map
| Males: 11,547 | |
| Females: 12,243 |
| Median resident age: | 37.5 years |
| Utah median age: | 27.1 years |
Zip codes: 84109.
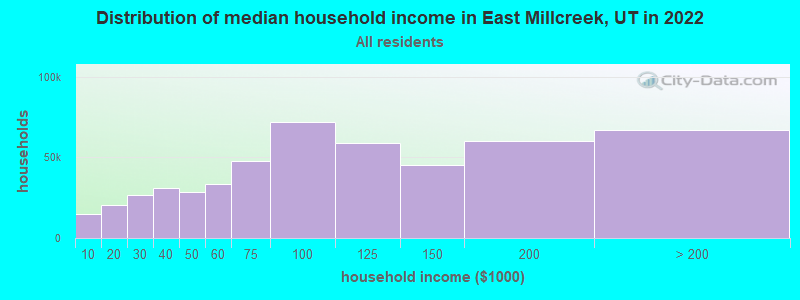
| East Millcreek: | $109,606 |
| UT: | $89,168 |
Estimated per capita income in 2022: $52,749 (it was $25,206 in 2000)
East Millcreek CDP income, earnings, and wages data
Estimated median house or condo value in 2022: $714,865 (it was $204,800 in 2000)
| East Millcreek: | $714,865 |
| UT: | $499,500 |
Mean prices in 2022: all housing units: $599,446; detached houses: $646,664; townhouses or other attached units: $438,665; in 2-unit structures: $468,515; in 3-to-4-unit structures: $333,219; in 5-or-more-unit structures: $403,097; mobile homes: $113,165
East Millcreek, UT residents, houses, and apartments details
Detailed information about poverty and poor residents in East Millcreek, UT
Compare current foreclosures near East Millcreek, UT:
| Photo | Address | Area | Beds / Baths | Price | Details |
|---|---|---|---|---|---|

|
#1
E Downington Ave
Salt Lake City, UT 84108
|
2,580 sq. feet
|
2 baths 1 beds |
$949,900
|
show details |

|
#2
S Holladay Cir
Salt Lake City, UT 84117
|
2,440 sq. feet
|
2 baths 4 beds |
$799,900
|
show details |

|
#3
S Willow Ln Apt D
Salt Lake City, UT 84107
|
780 sq. feet
|
1 baths 2 beds |
show details | |

|
#4
S 2200 W Apt 61
Salt Lake City, UT 84119
|
888 sq. feet
|
1 baths 2 beds |
show details | |

|
#5
W Heath Ave
Salt Lake City, UT 84118
|
979 sq. feet
|
1 baths 5 beds |
show details | |

|
#6
W 3500 S Ste 5040w
Salt Lake City, UT 84119
|
736 sq. feet
|
2 baths 3 beds |
show details | |

|
#7
W 300 S
Salt Lake City, UT 84104
|
1,313 sq. feet
|
1 baths 3 beds |
show details | |

|
#8
S Sorrento Way
West Jordan, UT 84081
|
1,332 sq. feet
|
2 baths 4 beds |
show details | |

|
#9
W Meadowbrook Dr
Salt Lake City, UT 84119
|
1,533 sq. feet
|
1 baths 3 beds |
show details | |

|
#10
W Aspen Springs Dr
Herriman, UT 84096
|
1,334 sq. feet
|
2 baths 2 beds |
show details |
| Photo | Address | Area | Beds / Baths | Price | Details |
|---|---|---|---|---|---|

|
#11
W 3800 S
Salt Lake City, UT 84119
|
2,050 sq. feet
|
2 baths 3 beds |
show details | |

|
#12
Ashley Ridge Rd
Sandy, UT 84092
|
2,661 sq. feet
|
2 baths 6 beds |
show details | |

|
#13
E Evelyn Dr
Salt Lake City, UT 84124
|
2,560 sq. feet
|
4 baths 4 beds |
show details | |

|
#14
S Solano Cir
Salt Lake City, UT 84120
|
1,009 sq. feet
|
2 baths 5 beds |
show details | |

|
#15
W 3500 S
Salt Lake City, UT 84120
|
1,104 sq. feet
|
1 baths 3 beds |
show details | |

|
#16
S 1500 W
Woods Cross, UT 84087
|
1,228 sq. feet
|
3 baths 5 beds |
show details | |

|
#17
S Slalom Way
West Jordan, UT 84084
|
1,410 sq. feet
|
2 baths 3 beds |
show details | |

|
#18
Eagle Crest Dr
Draper, UT 84020
|
3,711 sq. feet
|
4 baths 4 beds |
show details | |

|
#19
Jerema Ct
Draper, UT 84020
|
3,996 sq. feet
|
4 baths 6 beds |
show details | |

|
#20
W Winter Creek Cir
South Jordan, UT 84095
|
2,533 sq. feet
|
3 baths 6 beds |
show details |
| Photo | Address | Area | Beds / Baths | Price | Details |
|---|---|---|---|---|---|

|
#21
E Wilson Ave
Salt Lake City, UT 84105
|
950 sq. feet
|
1 baths 3 beds |
show details | |

|
#22
E Village Crest Dr
Draper, UT 84020
|
1,855 sq. feet
|
2 baths 4 beds |
show details | |

|
#23
S Cascade Way
Salt Lake City, UT 84109
|
1,185 sq. feet
|
1 baths 5 beds |
show details | |

|
#24
Moreland Cir
West Jordan, UT 84084
|
1,677 sq. feet
|
2 baths 4 beds |
show details | |

|
#25
S Manhattan Ct
Salt Lake City, UT 84120
|
1,569 sq. feet
|
1 baths 3 beds |
show details | |

|
#26
S 4170 W
Salt Lake City, UT 84118
|
960 sq. feet
|
1 baths 2 beds |
show details | |

|
#27
S Aquarius Dr
Salt Lake City, UT 84118
|
962 sq. feet
|
1 baths 2 beds |
show details | |

|
#28
S Lorna Dr
Salt Lake City, UT 84120
|
1,853 sq. feet
|
1 baths 4 beds |
show details | |

|
#29
W 3980 S
Salt Lake City, UT 84120
|
1,998 sq. feet
|
3 baths 4 beds |
show details | |

|
#30
W Mansfield Cir
West Jordan, UT 84084
|
1,620 sq. feet
|
1 baths 4 beds |
show details |
| Photo | Address | Area | Beds / Baths | Price | Details |
|---|---|---|---|---|---|

|
#31
W 5655 S
Salt Lake City, UT 84118
|
1,002 sq. feet
|
1 baths 2 beds |
show details | |

|
#32
W Sun Dr
Salt Lake City, UT 84118
|
924 sq. feet
|
1 baths 2 beds |
show details | |

|
#33
W 1200 N
Salt Lake City, UT 84116
|
1,683 sq. feet
|
2 baths 3 beds |
show details | |

|
#34
W 4715 S
Salt Lake City, UT 84118
|
1,857 sq. feet
|
2 baths 4 beds |
show details | |

|
#35
S Shayla Dr
West Jordan, UT 84088
|
1,462 sq. feet
|
1 baths 3 beds |
show details | |

|
#36
S Marylebone Rd
West Jordan, UT 84084
|
2,141 sq. feet
|
2 baths 4 beds |
show details | |

|
#37
S 4270 W
Salt Lake City, UT 84118
|
1,002 sq. feet
|
1 baths 3 beds |
show details | |

|
#38
W 8250 S
West Jordan, UT 84088
|
1,519 sq. feet
|
1 baths 3 beds |
show details | |

|
#39
W 1000 N
Salt Lake City, UT 84116
|
2,868 sq. feet
|
3 baths 7 beds |
show details | |

|
#40
W Misty Cir
Salt Lake City, UT 84129
|
1,599 sq. feet
|
1 baths 4 beds |
show details |
| Photo | Address | Area | Beds / Baths | Price | Details |
|---|---|---|---|---|---|

|
#41
W 5855 S
Salt Lake City, UT 84118
|
1,887 sq. feet
|
2 baths 4 beds |
show details | |

|
#42
S Manhatten Dr
Salt Lake City, UT 84120
|
1,527 sq. feet
|
1 baths 4 beds |
show details | |

|
#43
W 5700 S
Salt Lake City, UT 84118
|
1,602 sq. feet
|
1 baths 4 beds |
show details | |

|
#44
S Dartmouth Dr
Salt Lake City, UT 84120
|
1,388 sq. feet
|
1 baths 4 beds |
show details | |

|
#45
S 465 E
Sandy, UT 84070
|
1,530 sq. feet
|
1 baths 2 beds |
show details | |

|
#46
S 930 E
Sandy, UT 84094
|
2,460 sq. feet
|
4 baths 6 beds |
show details | |

|
#47
W 5255 S
Salt Lake City, UT 84118
|
2,022 sq. feet
|
2 baths 2 beds |
show details | |

|
#48
S 1500 W
West Jordan, UT 84088
|
1,095 sq. feet
|
1 baths 3 beds |
show details | |

|
#49
S Carrington St
Sandy, UT 84094
|
1,915 sq. feet
|
3 baths 4 beds |
show details | |

|
Check over 1 million property listings on Foreclosure.com!
|
browse all offers | |||

- 20,00893.6%White alone
- 5862.7%Hispanic
- 3061.4%Asian alone
- 2941.4%Two or more races
- 890.4%Black alone
- 530.2%Native Hawaiian and Other
Pacific Islander alone - 280.1%American Indian alone
- 210.10%Other race alone
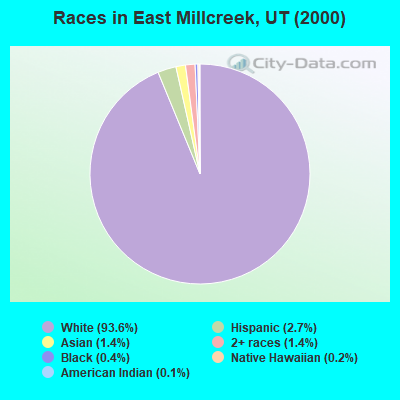
Races in East Millcreek detailed stats: ancestries, foreign born residents, place of birth
 Recent articles from our blog. Our writers, many of them Ph.D. graduates or candidates, create easy-to-read articles on a wide variety of topics.

 | Black in SLC (154 replies) |
| Weighing whether to stay (72 replies) |
| Which neighborhoods to tour before a potential move (33 replies) |
| Philly to SLC Relocation - Best LIBERAL places to live (16 replies) |
| Transfer from Atlanta to SLC (40 replies) |
| Possible relocation to Salt Lake Citt area. (10 replies) |
Latest news from East Millcreek, UT collected exclusively by city-data.com from local newspapers, TV, and radio stations
Ancestries: English (38.4%), German (14.7%), Danish (9.7%), Swedish (7.5%), Irish (6.1%), Scottish (4.8%).
Current Local Time: MST time zone
Elevation: 4800 feet
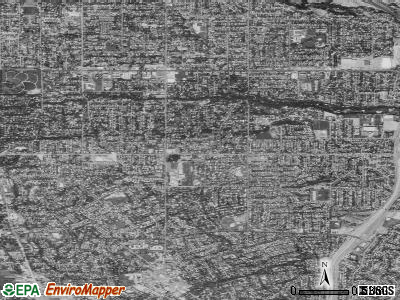
Land area: 4.45 square miles.
Population density: 5,342 people per square mile (average).
1,043 residents are foreign born (2.7% Europe, 1.2% Asia, 0.6% Latin America).
| This place: | 4.9% |
| Utah: | 7.1% |
| East Millcreek CDP: | 0.7% ($1,475) |
| Utah: | 0.7% ($956) |
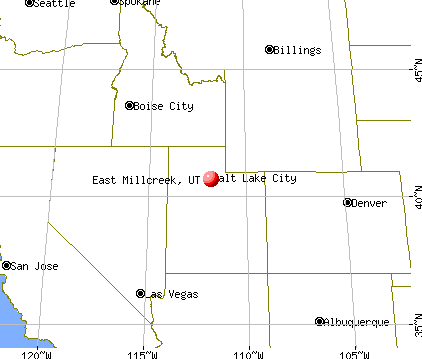
Nearest city with pop. 50,000+: Salt Lake City, UT  (6.0 miles , pop. 181,743).
Nearest city with pop. 200,000+: Northeast Jefferson, CO (360.4 miles , pop. 450,166).
Nearest city with pop. 1,000,000+: Phoenix, AZ (495.4 miles , pop. 1,321,045).
Nearest cities:
), ), ), ), ), ), ), )Latitude: 40.69 N, Longitude: 111.82 W
Daytime population change due to commuting: -6,347 (-29.7%)
Workers who live and work in this place: 1,089 (11.0%)
Area code commonly used in this area: 801
| Here: | 2.5% |
| Utah: | 2.5% |
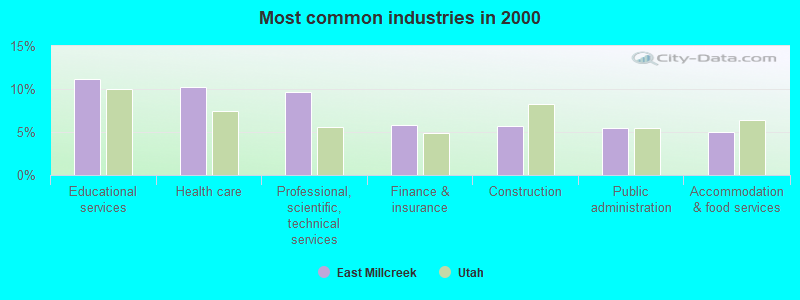
- Educational services (11.1%)
- Health care (10.3%)
- Professional, scientific, technical services (9.6%)
- Finance & insurance (5.9%)
- Construction (5.7%)
- Public administration (5.4%)
- Accommodation & food services (5.0%)
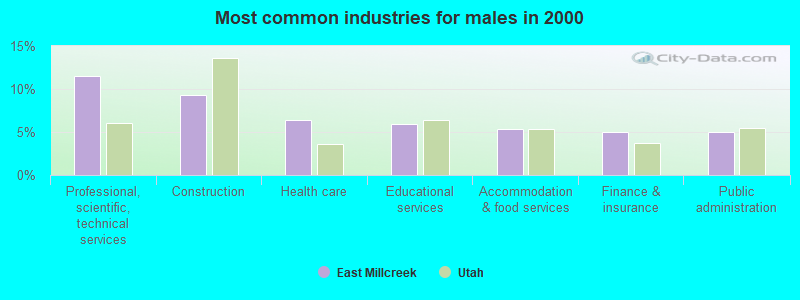
- Professional, scientific, technical services (11.5%)
- Construction (9.3%)
- Health care (6.4%)
- Educational services (5.9%)
- Accommodation & food services (5.3%)
- Finance & insurance (5.0%)
- Public administration (5.0%)
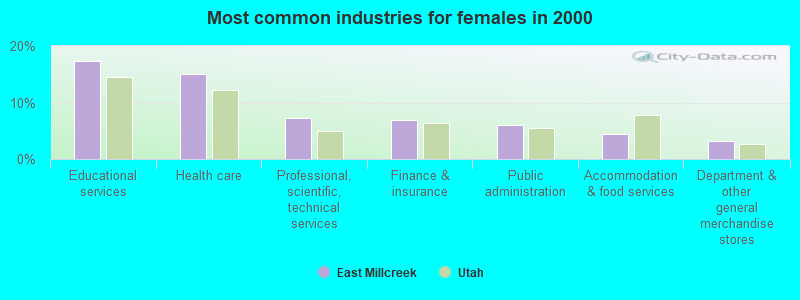
- Educational services (17.4%)
- Health care (15.0%)
- Professional, scientific, technical services (7.3%)
- Finance & insurance (6.9%)
- Public administration (6.0%)
- Accommodation & food services (4.5%)
- Department & other general merchandise stores (3.2%)
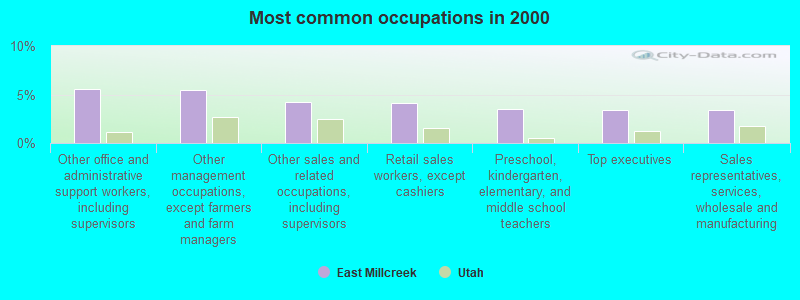
- Other office and administrative support workers, including supervisors (5.6%)
- Other management occupations, except farmers and farm managers (5.5%)
- Other sales and related occupations, including supervisors (4.2%)
- Retail sales workers, except cashiers (4.1%)
- Preschool, kindergarten, elementary, and middle school teachers (3.5%)
- Top executives (3.4%)
- Sales representatives, services, wholesale and manufacturing (3.4%)
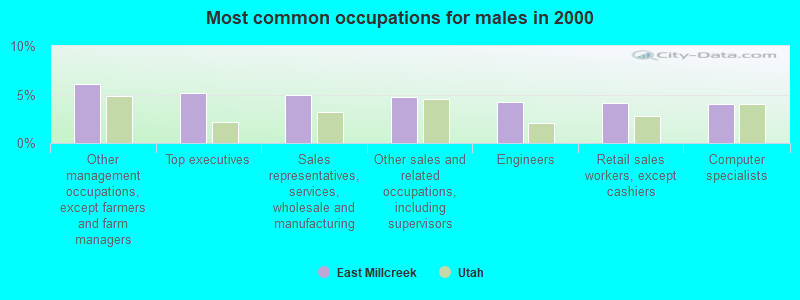
- Other management occupations, except farmers and farm managers (6.1%)
- Top executives (5.1%)
- Sales representatives, services, wholesale and manufacturing (4.9%)
- Other sales and related occupations, including supervisors (4.7%)
- Engineers (4.2%)
- Retail sales workers, except cashiers (4.1%)
- Computer specialists (4.0%)

- Other office and administrative support workers, including supervisors (8.2%)
- Preschool, kindergarten, elementary, and middle school teachers (7.0%)
- Secretaries and administrative assistants (6.2%)
- Information and record clerks, except customer service representatives (5.5%)
- Other management occupations, except farmers and farm managers (4.7%)
- Retail sales workers, except cashiers (4.2%)
- Other teachers, instructors, education, training, and library occupations (4.0%)
Average climate in East Millcreek, Utah
Based on data reported by over 4,000 weather stations


|
|

(lower is better)
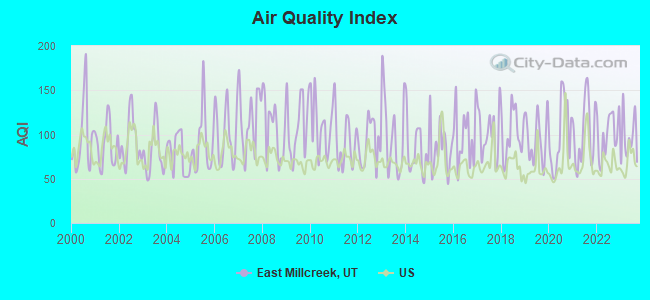
Air Quality Index (AQI) level in 2023 was 95.8. This is worse than average.
| City: | 95.8 |
| U.S.: | 72.6 |
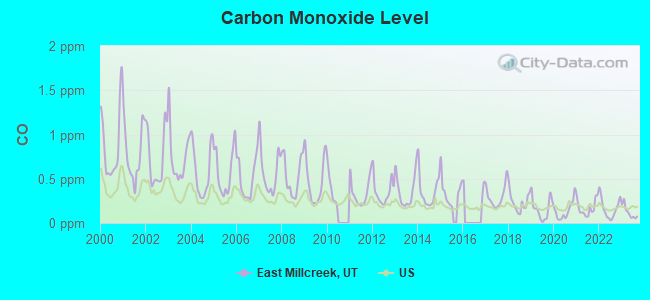
Carbon Monoxide (CO) [ppm] level in 2023 was 0.123. This is significantly better than average. Closest monitor was 3.2 miles away from the city center.
| City: | 0.123 |
| U.S.: | 0.251 |
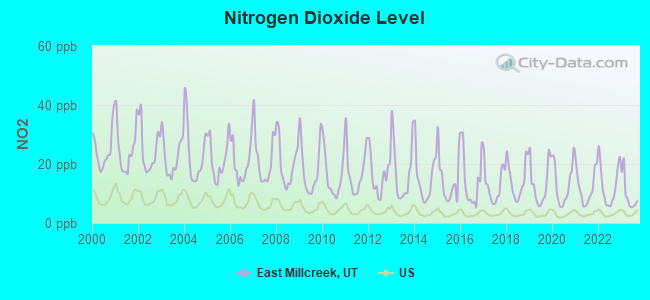
Nitrogen Dioxide (NO2) [ppb] level in 2023 was 9.70. This is significantly worse than average. Closest monitor was 3.2 miles away from the city center.
| City: | 9.70 |
| U.S.: | 5.11 |
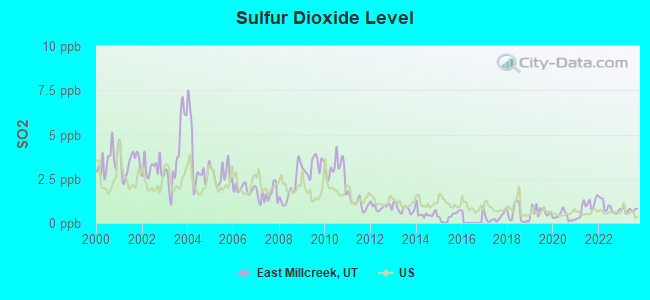
Sulfur Dioxide (SO2) [ppb] level in 2023 was 0.741. This is significantly better than average. Closest monitor was 4.3 miles away from the city center.
| City: | 0.741 |
| U.S.: | 1.515 |
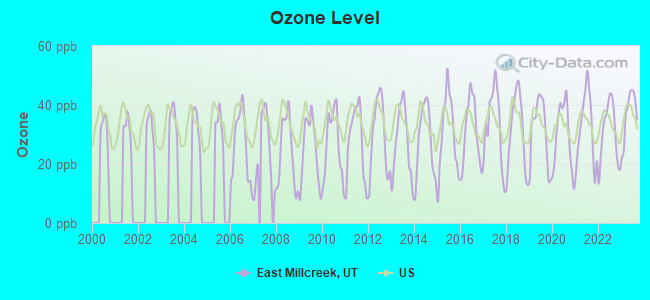
Ozone [ppb] level in 2023 was 36.9. This is about average. Closest monitor was 3.2 miles away from the city center.
| City: | 36.9 |
| U.S.: | 33.3 |
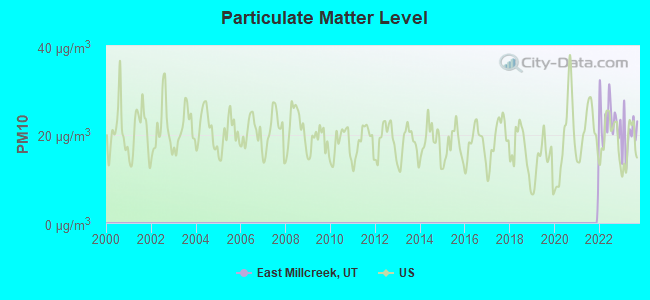
Particulate Matter (PM10) [µg/m3] level in 2023 was 19.7. This is about average. Closest monitor was 3.2 miles away from the city center.
| City: | 19.7 |
| U.S.: | 19.2 |
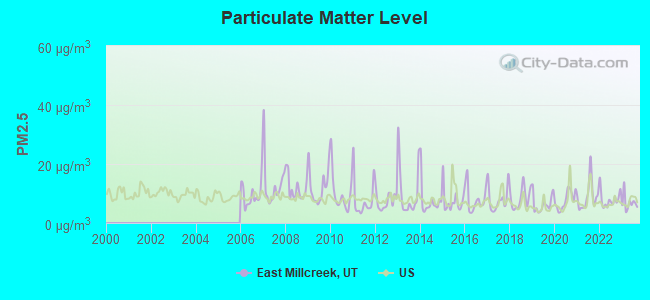
Particulate Matter (PM2.5) [µg/m3] level in 2023 was 6.84. This is about average. Closest monitor was 3.2 miles away from the city center.
| City: | 6.84 |
| U.S.: | 8.11 |
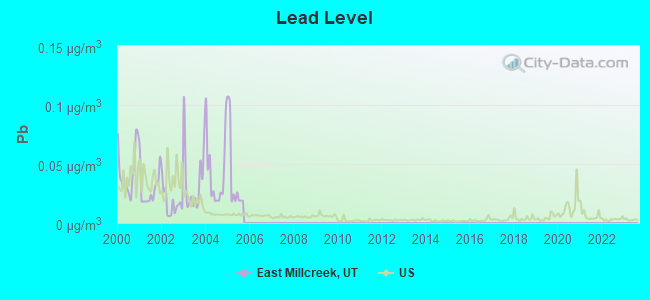
Lead (Pb) [µg/m3] level in 2005 was 0.0394. This is significantly worse than average. Closest monitor was 3.2 miles away from the city center.
| City: | 0.0394 |
| U.S.: | 0.0093 |
Earthquake activity:
East Millcreek-area historical earthquake activity is significantly above Utah state average. It is 2166% greater than the overall U.S. average.On 8/18/1959 at 06:37:13, a magnitude 7.7 (7.7 UK, Class: Major, Intensity: VIII - XII) earthquake occurred 274.7 miles away from East Millcreek center, causing $26,000,000 total damage
On 10/3/1915 at 06:52:48, a magnitude 7.6 (7.6 UK) earthquake occurred 298.5 miles away from the city center
On 10/28/1983 at 14:06:06, a magnitude 7.3 (6.2 MB, 7.3 MS, 7.0 MW) earthquake occurred 255.3 miles away from East Millcreek center, causing 2 deaths (2 shaking deaths) and 3 injuries, causing $15,000,000 total damage
On 3/28/1975 at 02:31:05, a magnitude 6.2 (6.1 MB, 6.0 MS, 6.2 ML, Class: Strong, Intensity: VII - IX) earthquake occurred 97.7 miles away from East Millcreek center
On 3/18/2020 at 13:09:31, a magnitude 5.7 (5.7 MW, Depth: 7.4 mi, Class: Moderate, Intensity: VI - VII) earthquake occurred 14.2 miles away from East Millcreek center
On 12/21/1932 at 06:10:09, a magnitude 7.2 (7.2 UK) earthquake occurred 366.1 miles away from East Millcreek center
Magnitude types: body-wave magnitude (MB), local magnitude (ML), surface-wave magnitude (MS), moment magnitude (MW)
Natural disasters:
The number of natural disasters in Salt Lake County (9) is smaller than the US average (15).Major Disasters (Presidential) Declared: 4
Emergencies Declared: 1
Causes of natural disasters: Floods: 3, Storms: 3, Fires: 2, Landslides: 2, Earthquake: 1, Hurricane: 1, Mudslide: 1, Tornado: 1, Other: 1 (Note: some incidents may be assigned to more than one category).

Hospitals and medical centers near East Millcreek:
- MT OLYMPUS REHABILITATION CENTER (Nursing Home, about 1 miles away; SALT LAKE CITY, UT)
- CANYON RIM CARE CENTER (Nursing Home, about 1 miles away; SALT LAKE CITY, UT)
- LIFE CARE AT HOME OF UTAH (Home Health Center, about 2 miles away; SALT LAKE CITY, UT)
- HIGHLAND CARE CENTER (Nursing Home, about 2 miles away; HOLLADAY, UT)
- FLEXCARE HOME HEALTH (Home Health Center, about 2 miles away; SALT LAKE CITY, UT)
- HOLLADAY HEALTHCARE CENTER (Nursing Home, about 2 miles away; SALT LAKE CITY, UT)
- SPRING CREEK HEALTHCARE CENTER (Nursing Home, about 2 miles away; HOLLADAY, UT)
Amtrak station near East Millcreek:
Colleges/universities with over 2000 students nearest to East Millcreek:
- Western Governors University (about 3 miles; Salt Lake City, UT; Full-time enrollment: 31,481)
- Westminster College (about 4 miles; Salt Lake City, UT; FT enrollment: 2,870)
- Stevens-Henager College-Murray (about 5 miles; Murray, UT; FT enrollment: 6,395)
- University of Utah (about 6 miles; Salt Lake City, UT; FT enrollment: 28,454)
- Salt Lake Community College (about 7 miles; Salt Lake City, UT; FT enrollment: 20,797)
- Latter-day Saints Business College (about 8 miles; Salt Lake City, UT; FT enrollment: 2,059)
- Utah Valley University (about 29 miles; Orem, UT; FT enrollment: 24,403)
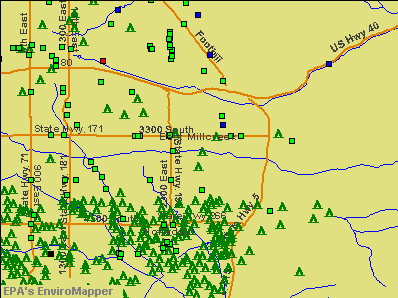
Points of interest:
Notable locations in East Millcreek: Carmelle Reception Center (A), Evergreen Library (B). Display/hide their locations on the map
Churches in East Millcreek include: The Church of Jesus Christ of Latter Day Saints (A), Salt Lake City Chinese Christian Church (B), The Church Of Jesus Christ Of Latter Day Saints (C), Faith Christian Fellowship (D), Holladay Baptist Church (E), Mount Olympus Presbyterian Church (F), Our Saviour Lutheran Church (G), The Church of Jesus Christ of Latter Day Saints (H). Display/hide their locations on the map
Cemetery: Wasatch Lawn Memorial Park (1). Display/hide its location on the map
Birthplace of: Barbara W. Winder - President of the Relief Society of the LDS church.
| This place: | 2.8 people |
| Utah: | 3.1 people |
| This place: | 74.4% |
| Whole state: | 77.0% |
| This place: | 2.6% |
| Whole state: | 3.4% |
Likely homosexual households (counted as self-reported same-sex unmarried-partner households)
- Lesbian couples: 0.3% of all households
- Gay men: 0.3% of all households
| This place: | 5.7% |
| Whole state: | 9.4% |
| This place: | 1.6% |
| Whole state: | 3.9% |
People in group quarters in East Millcreek in 2000:
- 267 people in nursing homes
- 8 people in other noninstitutional group quarters
- 5 people in homes for the mentally retarded
For population 15 years and over in East Millcreek:
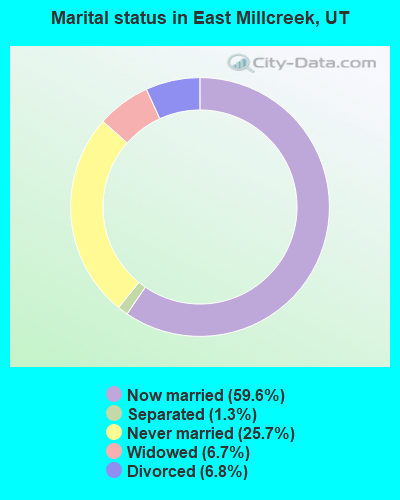
- Never married: 25.7%
- Now married: 59.6%
- Separated: 1.3%
- Widowed: 6.7%
- Divorced: 6.8%
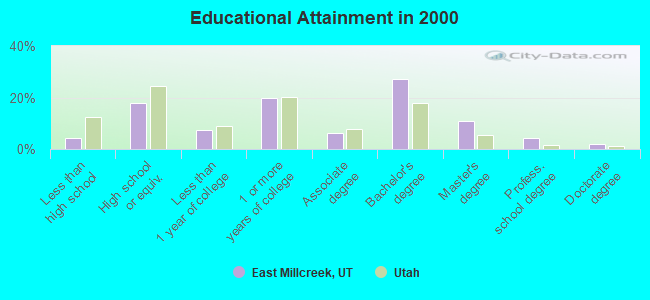
For population 25 years and over in East Millcreek:
- High school or higher: 95.6%
- Bachelor's degree or higher: 44.3%
- Graduate or professional degree: 16.9%
- Unemployed: 3.0%
- Mean travel time to work (commute): 20.8 minutes
| Here: | 9.5 |
| Utah average: | 10.5 |
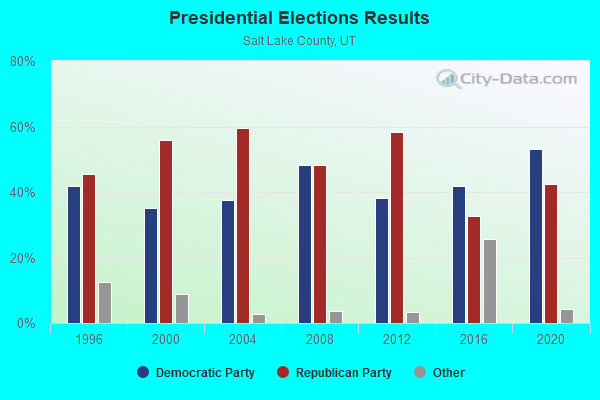
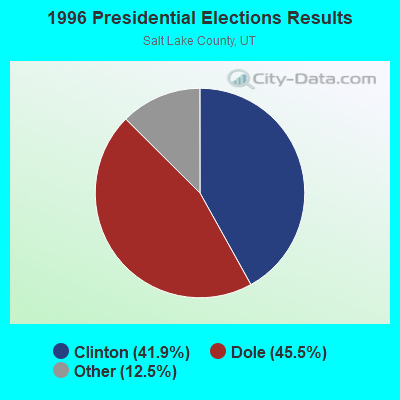
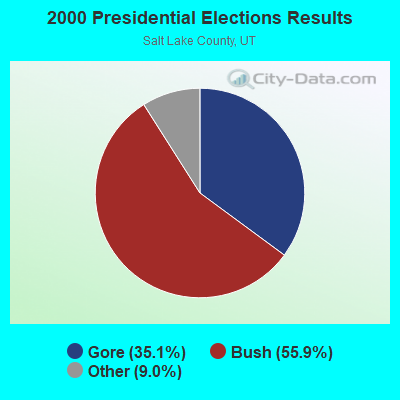
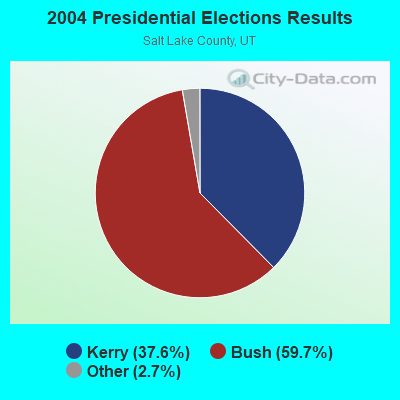
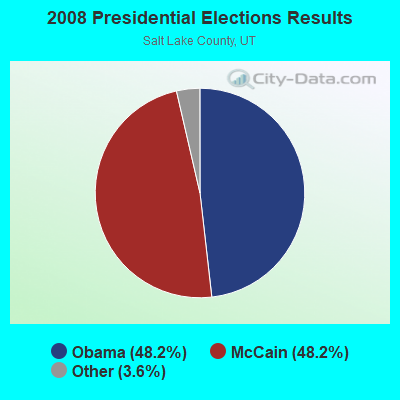

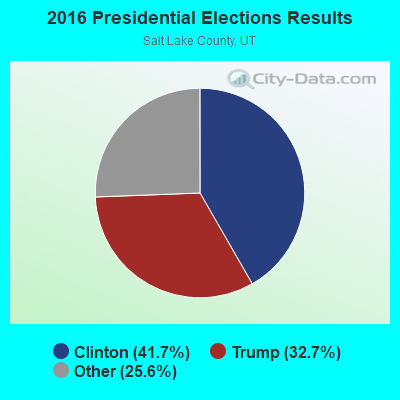
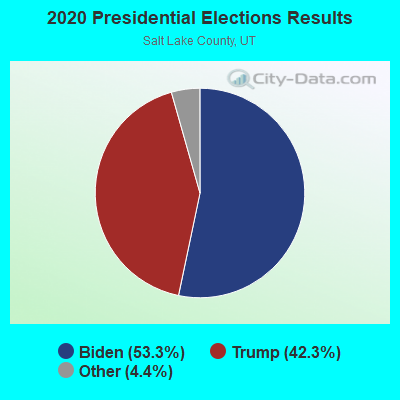
Graphs represent county-level data. Detailed 2008 Election Results
Religion statistics for East Millcreek, UT (based on Salt Lake County data)
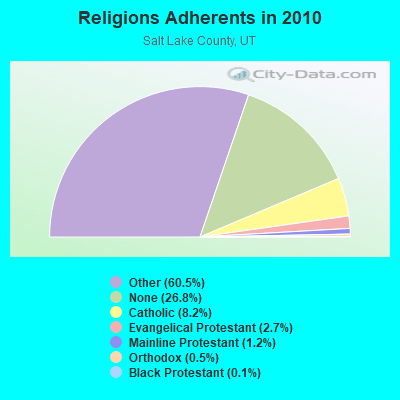
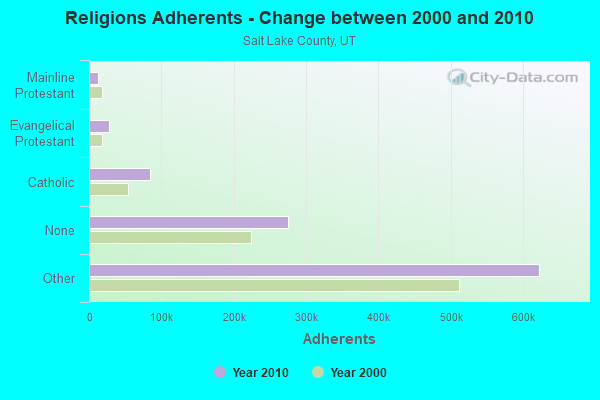
| Religion | Adherents | Congregations |
|---|---|---|
| Other | 622,807 | 1,452 |
| Catholic | 84,342 | 24 |
| Evangelical Protestant | 27,497 | 144 |
| Mainline Protestant | 12,789 | 38 |
| Orthodox | 5,352 | 7 |
| Black Protestant | 1,302 | 6 |
| None | 275,566 | - |
Food Environment Statistics:
| Salt Lake County: | 1.45 / 10,000 pop. |
| State: | 1.37 / 10,000 pop. |
| Salt Lake County: | 0.16 / 10,000 pop. |
| Utah: | 0.18 / 10,000 pop. |
| This county: | 0.47 / 10,000 pop. |
| State: | 0.41 / 10,000 pop. |
| Salt Lake County: | 2.45 / 10,000 pop. |
| Utah: | 2.82 / 10,000 pop. |
| Salt Lake County: | 5.55 / 10,000 pop. |
| State: | 5.09 / 10,000 pop. |
| This county: | 6.5% |
| Utah: | 6.3% |
| Salt Lake County: | 22.7% |
| Utah: | 23.6% |
6.29% of this county's 2021 resident taxpayers lived in other counties in 2020 ($73,956 average adjusted gross income)
| Here: | 6.29% |
| Utah average: | 7.95% |
0.01% of residents moved from foreign countries ($111 average AGI)
Salt Lake County: 0.01% Utah average: 0.02%
Top counties from which taxpayers relocated into this county between 2020 and 2021:
| from Utah County, UT | |
| from Davis County, UT | |
| from Weber County, UT |
6.63% of this county's 2020 resident taxpayers moved to other counties in 2021 ($71,033 average adjusted gross income)
| Here: | 6.63% |
| Utah average: | 7.39% |
0.01% of residents moved to foreign countries ($100 average AGI)
Salt Lake County: 0.01% Utah average: 0.02%
Top counties to which taxpayers relocated from this county between 2020 and 2021:
| to Utah County, UT | |
| to Davis County, UT | |
| to Tooele County, UT |
Strongest AM radio stations in East Millcreek:
- KTKK (630 AM; 10 kW; SANDY, UT; Owner: UNITED BROADCASTING COMPANY)
- KIQN (1010 AM; 50 kW; TOOELE, UT)
- KBEE (860 AM; 10 kW; SALT LAKE CITY, UT; Owner: CITADEL BROADCASTING COMPANY)
- KALL (700 AM; 50 kW; NORTH SALT LAKE CITY, UT; Owner: CITICASTERS LICENSES, L.P.)
- KSL (1160 AM; 50 kW; SALT LAKE CITY, UT; Owner: BONNEVILLE HOLDING COMPANY)
- KBJA (1640 AM; 10 kW; SANDY, UT; Owner: UNITED BROADCASTING COMPANY, INC)
- KSOP (1370 AM; 5 kW; SOUTH SALT LAKE, UT; Owner: KSOP, INC.)
- KFNZ (1320 AM; 5 kW; SALT LAKE CITY, UT; Owner: CITADEL BROADCASTING COMPANY)
- KNRS (570 AM; 5 kW; SALT LAKE CITY, UT; Owner: CITICASTERS LICENSES, L.P.)
- KZNS (1280 AM; 10 kW; SALT LAKE CITY, UT; Owner: SIMMONS-SLC, LS, LLC)
- KMRI (1550 AM; 10 kW; WEST VALLEY CITY, UT; Owner: KMRI RADIO, LLC)
- KLLB (1510 AM; daytime; 10 kW; WEST JORDAN, UT; Owner: UNITED SECURITY FINANCIAL, INC.)
- KJQS (1230 AM; 1 kW; MURRAY, UT; Owner: CITADEL BROADCASTING COMPANY)
Strongest FM radio stations in East Millcreek:
- KCPX (105.7 FM; CENTERVILLE, UT; Owner: MERCURY BROADCASTING COMPANY, INC.)
- KSOP-FM (104.3 FM; SALT LAKE CITY, UT; Owner: KSOP, INC.)
- K272DP (102.3 FM; TOOELE, UT; Owner: FAMILY STATIONS, INC.)
- KBZN (97.9 FM; OGDEN, UT; Owner: CAPITOL BROADCASTING, INC.)
- KRCL (90.9 FM; SALT LAKE CITY, UT; Owner: LISTENERS COMMUNITY RADIO OF UTAH)
- KBER (101.1 FM; OGDEN, UT; Owner: CITADEL BROADCASTING COMPANY)
- KISN-FM (97.1 FM; SALT LAKE CITY, UT; Owner: CLEAR CHANNEL BROADCASTING LICENSES, INC.)
- KKAT (101.9 FM; OGDEN, UT; Owner: CITICASTERS LICENSES, L.P.)
- KSFI (100.3 FM; SALT LAKE CITY, UT; Owner: SIMMONS-SLC, LS, LLC)
- KUBL-FM (93.3 FM; SALT LAKE CITY, UT; Owner: CITADEL BROADCASTING COMPANY)
- KOSY-FM (106.5 FM; SPANISH FORK, UT; Owner: MERCURY BROADCASTING COMPANY, INC.)
- KRSP-FM (103.5 FM; SALT LAKE CITY, UT; Owner: SIMMONS-SLC, LS, LLC)
- KODJ (94.1 FM; SALT LAKE CITY, UT; Owner: CITICASTERS LICENSES, L.P.)
- KUER-FM (90.1 FM; SALT LAKE CITY, UT; Owner: UNIVERSITY OF UTAH)
- KBYU-FM (89.1 FM; PROVO, UT; Owner: BRIGHAM YOUNG UNIVERSITY)
- KURR (99.5 FM; BOUNTIFUL, UT; Owner: CITICASTERS LICENSES, L.P.)
- KBEE-FM (98.7 FM; SALT LAKE CITY, UT; Owner: CITADEL BROADCASTING COMPANY)
- K248AK (97.5 FM; DRAPER, UT; Owner: CITICASTERS LICENSES, L.P.)
- KPCW (91.9 FM; PARK CITY, UT; Owner: COMMUNITY WIRELESS OF PARK CITY, INC.)
- K252DI (98.3 FM; SALT LAKE CITY, UT; Owner: FIRST NATIONAL BROADCASTING CORPORATION)
TV broadcast stations around East Millcreek:
- K59GS (Channel 59; SALT LAKE CITY, UT; Owner: ALPHA & OMEGA COMMUNICATIONS, LLC)
- KUTV (Channel 2; SALT LAKE CITY, UT; Owner: KUTV HOLDINGS, INC.)
- KUCL-LP (Channel 26; SALT LAKE CITY, UT; Owner: CHRISTIAN LIFE BROADCASTING)
- KEJT-LP (Channel 48; SALT LAKE CITY, UT; Owner: TELEMUNDO OF NORTHERN CALIFORNIA LICENSE CORP.)
- K66FN (Channel 66; SALT LAKE CITY, UT; Owner: AZTECA BROADCASTING CORPORATION)
- KULC (Channel 9; OGDEN, UT; Owner: UTAH STATE BOARD OF REGENTS)
- KUED (Channel 7; SALT LAKE CITY, UT; Owner: UNIVERSITY OF UTAH)
- KSL-TV (Channel 5; SALT LAKE CITY, UT; Owner: BONNEVILLE HOLDING COMPANY)
- KBYU-TV (Channel 11; PROVO, UT; Owner: BRIGHAM YOUNG UNIVERSITY)
- KUWB (Channel 30; OGDEN, UT; Owner: ACME TV LICENSES OF UTAH, LLC)
- KJZZ-TV (Channel 14; SALT LAKE CITY, UT; Owner: LARRY H. MILLER COMMUNICATIONS CORP.)
- KTVX (Channel 4; SALT LAKE CITY, UT; Owner: CLEAR CHANNEL BROADCASTING LICENSES, INC.)
- KSTU (Channel 13; SALT LAKE CITY, UT; Owner: FOX TELEVISION STATIONS INC.)
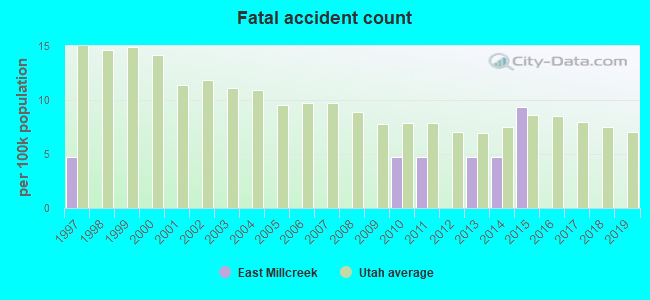
East Millcreek fatal accident list:
May 23, 2015 02:02 AM, Sr-171, Lat: 40.699942, Lon: -111.845725, Vehicles: 1, Persons: 2, Pedestrians: 1, Fatalities: 1, Drunk persons involved: 1
May 27, 2014 01:41 PM, I-215, Lat: 40.678231, Lon: -111.799772, Vehicles: 1, Persons: 1, Fatalities: 1
Nov 25, 2013 06:06 PM, Sr-171, 2940 E, Lat: 40.699839, Lon: -111.809292, Vehicles: 1, Persons: 1, Pedestrians: 1, Fatalities: 1
Jan 4, 2011 07:44 AM, I-215, 3900 S, Lat: 40.686497, Lon: -111.797392, Vehicles: 1, Persons: 1, Fatalities: 1
Jun 6, 2010 02:00 AM, 3900 S, 3250 E, Lat: 40.687050, Lon: -111.801939, Vehicles: 2, Persons: 3, Fatalities: 1, Drunk persons involved: 1
Feb 14, 1997 06:21 PM, I215, Vehicles: 2, Persons: 4, Fatalities: 1
- National Bridge Inventory (NBI) Statistics
- 1Number of bridges
- 62,877Total average daily traffic
- 7,545Total average daily truck traffic
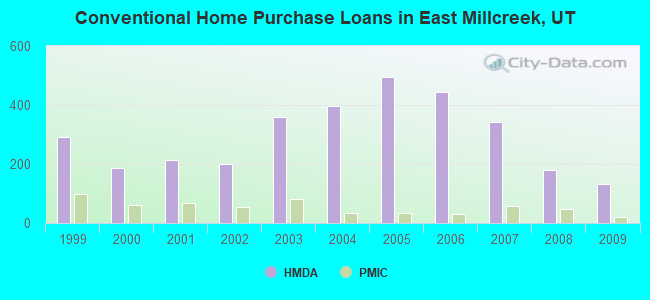
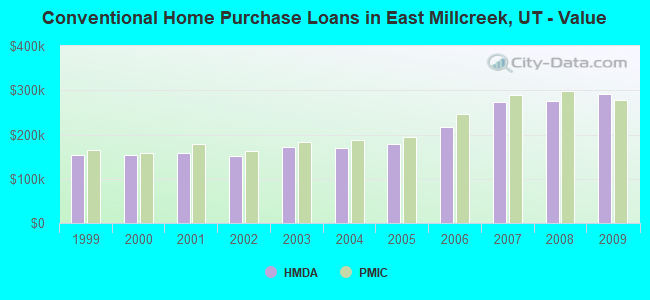
| Home Mortgage Disclosure Act Aggregated Statistics For Year 2009 (Based on 3 full and 1 partial tracts) | ||||||||||||
| A) FHA, FSA/RHS & VA Home Purchase Loans | B) Conventional Home Purchase Loans | C) Refinancings | D) Home Improvement Loans | F) Non-occupant Loans on < 5 Family Dwellings (A B C & D) | G) Loans On Manufactured Home Dwelling (A B C & D) | |||||||
|---|---|---|---|---|---|---|---|---|---|---|---|---|
| Number | Average Value | Number | Average Value | Number | Average Value | Number | Average Value | Number | Average Value | Number | Average Value | |
| LOANS ORIGINATED | 67 | $256,544 | 131 | $291,682 | 845 | $245,316 | 22 | $205,105 | 33 | $195,833 | 0 | $0 |
| APPLICATIONS APPROVED, NOT ACCEPTED | 6 | $229,403 | 15 | $324,297 | 123 | $226,255 | 2 | $95,000 | 6 | $246,543 | 0 | $0 |
| APPLICATIONS DENIED | 14 | $252,724 | 21 | $222,850 | 175 | $279,281 | 12 | $163,761 | 11 | $253,445 | 1 | $222,000 |
| APPLICATIONS WITHDRAWN | 9 | $205,161 | 14 | $246,941 | 111 | $282,595 | 7 | $161,816 | 7 | $181,291 | 0 | $0 |
| FILES CLOSED FOR INCOMPLETENESS | 1 | $122,680 | 2 | $213,315 | 26 | $290,124 | 1 | $30,000 | 0 | $0 | 0 | $0 |
Detailed HMDA statistics for the following Tracts: 1104.00 , 1105.00, 1106.00, 1107.02
| Private Mortgage Insurance Companies Aggregated Statistics For Year 2009 (Based on 3 full and 1 partial tracts) | ||||
| A) Conventional Home Purchase Loans | B) Refinancings | |||
|---|---|---|---|---|
| Number | Average Value | Number | Average Value | |
| LOANS ORIGINATED | 22 | $278,580 | 19 | $293,555 |
| APPLICATIONS APPROVED, NOT ACCEPTED | 7 | $307,053 | 7 | $269,153 |
| APPLICATIONS DENIED | 6 | $234,748 | 9 | $331,371 |
| APPLICATIONS WITHDRAWN | 1 | $302,000 | 4 | $311,250 |
| FILES CLOSED FOR INCOMPLETENESS | 0 | $0 | 0 | $0 |
Detailed PMIC statistics for the following Tracts: 1104.00 , 1105.00, 1106.00, 1107.02
2002 - 2018 National Fire Incident Reporting System (NFIRS) incidents
- Fire incident types reported to NFIRS in East Millcreek, UT
- 4938.9%Outside Fires
- 4132.5%Structure Fires
- 2116.7%Mobile Property/Vehicle Fires
- 1511.9%Other
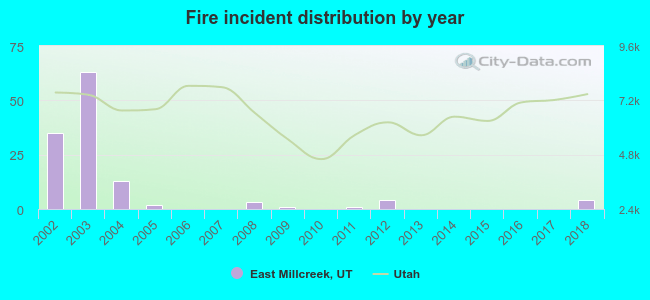 According to the data from the years 2002 - 2018 the average number of fire incidents per year is 7. The highest number of fires - 63 took place in 2003, and the least - 0 in 2006. The data has a decreasing trend.
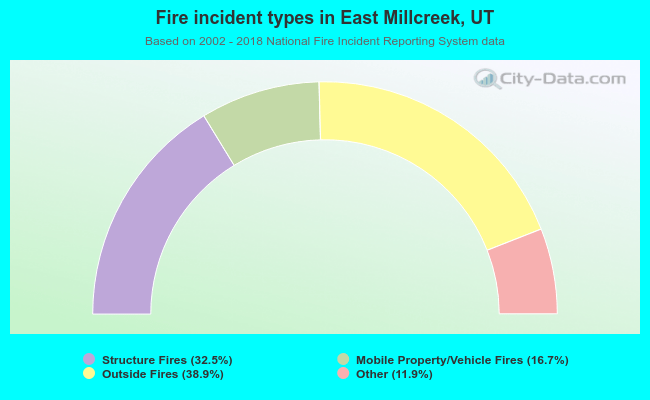 When looking into fire subcategories, the most reports belonged to: Outside Fires (38.9%), and Structure Fires (32.5%).
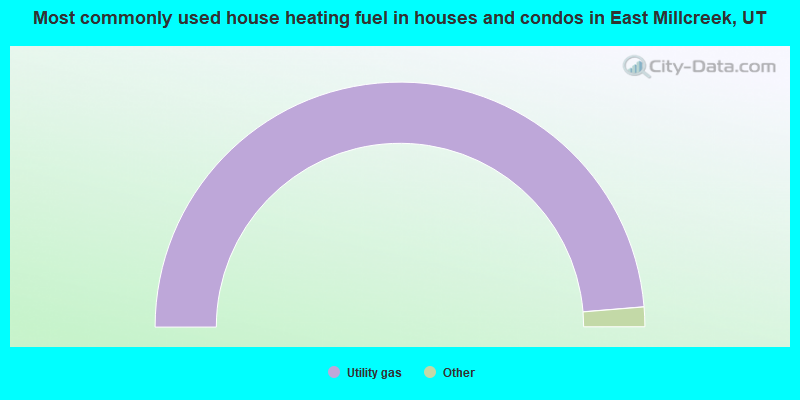
- 97.4%Utility gas
- 2.2%Electricity
- 0.1%Wood
- 0.1%No fuel used
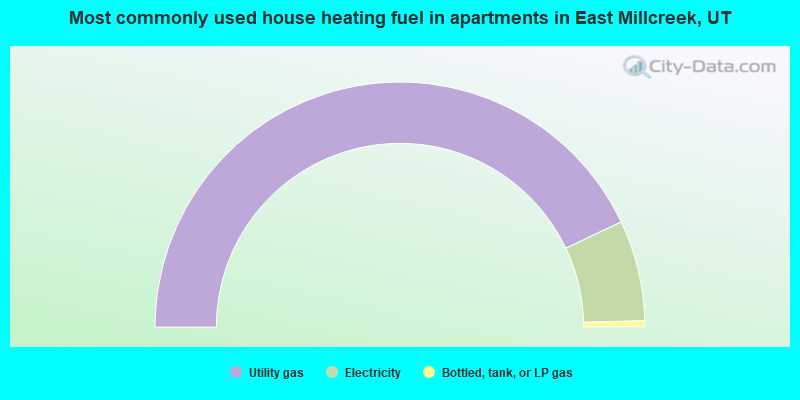
- 85.9%Utility gas
- 13.3%Electricity
- 0.8%Bottled, tank, or LP gas
East Millcreek compared to Utah state average:
- Unemployed percentage significantly below state average.
- Black race population percentage below state average.
- Hispanic race population percentage significantly below state average.
- Median age above state average.
- Foreign-born population percentage below state average.
- Renting percentage significantly below state average.
- Length of stay since moving in significantly above state average.
- Number of rooms per house significantly below state average.
- House age significantly below state average.
- Institutionalized population percentage significantly above state average.
- Percentage of population with a bachelor's degree or higher above state average.
East Millcreek on our top lists:
- #13 on the list of "Top 101 cities with largest percentage of males in occupations: communications equipment operators (population 5,000+)"
- #36 on the list of "Top 101 cities with largest percentage of females in occupations: transportation, tourism, and lodging attendants (population 5,000+)"
- #38 on the list of "Top 101 cities with largest percentage of males in occupations: architects, surveyors, and cartographers (population 5,000+)"
- #42 on the list of "Top 101 cities with largest percentage of males in industries: sporting goods, camera, and hobby and toy stores (population 5,000+)"
- #43 on the list of "Top 101 cities with largest percentage of females in occupations: entertainers and performers, sports, and related workers (population 5,000+)"
- #50 on the list of "Top 101 cities with largest percentage of males in occupations: occupational and physical therapist assistants and aides (population 5,000+)"
- #52 on the list of "Top 101 cities with largest percentage of males in occupations: lawyers (population 5,000+)"
- #57 on the list of "Top 101 cities with largest percentage of females in industries: sporting goods, camera, and hobby and toy stores (population 5,000+)"
- #62 on the list of "Top 101 cities with largest percentage of females in industries: air transportation (population 5,000+)"
- #76 on the list of "Top 101 cities with largest percentage of males in industries: data processing, libraries, and other information services (population 5,000+)"
- #63 (84109) on the list of "Top 101 zip codes with the largest charity contributions deductions as a percentage of AGI in 2012 (pop 5,000+)"
- #69 (84109) on the list of "Top 101 zip codes with the largest percentage of English first ancestries (pop 5,000+)"
- #1 on the list of "Top 101 counties with the most Other adherents"
- #1 on the list of "Top 101 counties with the most Other congregations"
- #4 on the list of "Top 101 counties with the lowest percentage of residents that smoked 100+ cigarettes in their lives"
- #11 on the list of "Top 101 counties with the highest Nitrogen Dioxide air pollution readings in 2012 (ppm)"
- #14 on the list of "Top 101 counties with the highest number of births per 1000 residents 2007-2013"