East Millcreek: Fire Incidents, Utah (UT)
Where are fire incidents reported in East Millcreek, UT
Something went wrong! Please refresh the page.
|
| |||||||||||||||||||||||||||||||||||||||||||||||||||||||||||||||||||||||||||||||||||||||||||||||||||||||||||||
2002 - 2018 National Fire Incident Reporting System (NFIRS) incidents
- Incident types reported to NFIRS in East Millcreek, UT
- 1,01064.8%Rescue & EMS
- 18511.9%False Alarm
- 1268.1%Fire
- 936.0%Hazardous Condition
- 704.5%Good Intent Call
- 644.1%Service Call
- 50.3%Special Incident
- 30.2%Overpressure Rupture
- 20.1%Severe Weather
- Fire incident types reported to NFIRS in East Millcreek, UT
- 4938.9%Outside Fires
- 4132.5%Structure Fires
- 2116.7%Mobile Property/Vehicle Fires
- 1511.9%Other
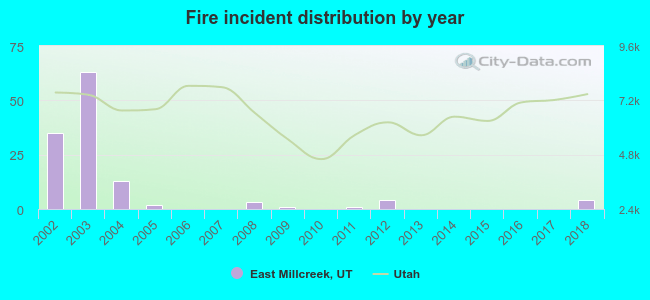 Based on the data from the years 2002 - 2018 the average number of fire incidents per year is 7. The highest number of fires - 63 took place in 2003, and the least - 0 in 2006. The data has a dropping trend.
The average number of yearly fire incidents per 10k residents in East Millcreek, UT compared to nearest cities:
(Note: Based on data for the last 3 years, including only cities with population 5,000 and above)
| East Millcreek: | 1.7 |
| Holladay: | 19.9 |
| Millcreek: | 11.9 |
| South Salt Lake: | 44.9 |
| Murray: | 32.0 |
| Cottonwood Heights: | 14.6 |
| Salt Lake City: | 27.4 |
| Midvale: | 27.1 |
| Taylorsville: | 20.8 |
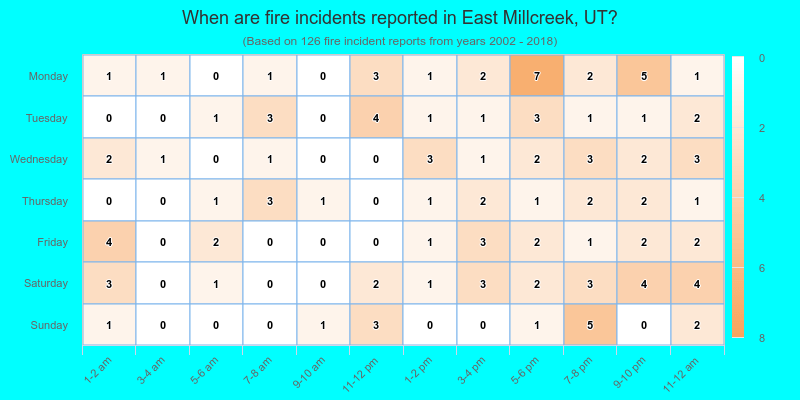
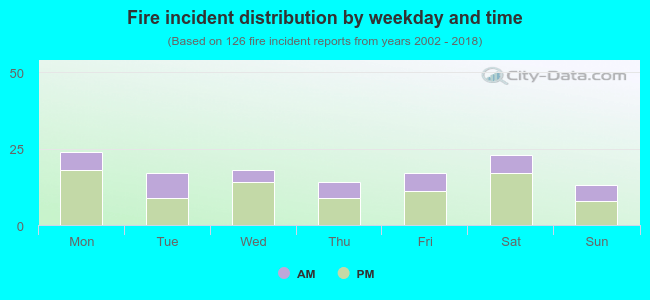 31.7% incidents where reported in the morning and 68.3% in the evening. The most fires (19.0%) took place on Monday, and the least (10.3%) on Sunday.
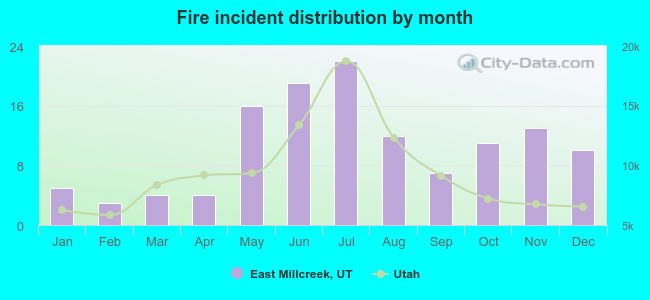 According to the 126 fires from years 2002 - 2018 most fires (17.5%) took place during July, and the least (2.4%) in February.
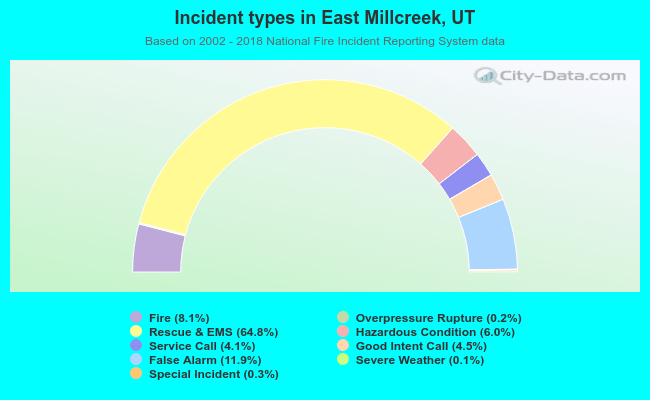 Out of all 1,558 cases reported during the years 2002 - 2018, the most belonged to the categories: Rescue & EMS (64.8%), False Alarm (11.9%), and Fire (8.1%).
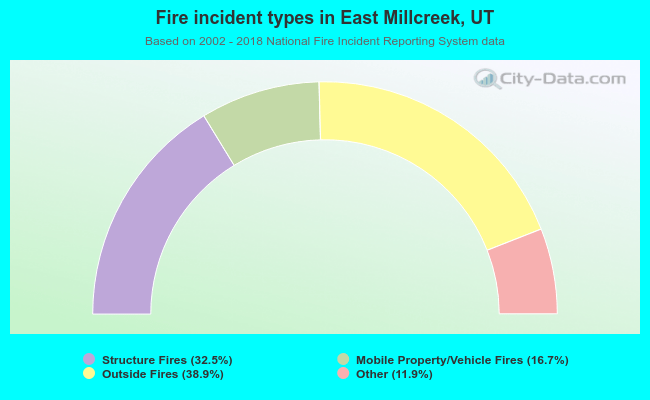 When looking into fire subcategories, the most reports belonged to: Outside Fires (38.9%), and Structure Fires (32.5%).