Indianapolis, the capital of Indiana, is a midwestern city with a rich culture, a diversified economy, and four distinct seasons. Conversely, Mobile, the heart of Alabama's Gulf Coast, boasts a more relaxed coastal lifestyle, subtropical weather, and a rich history. Both cities offer unique experiences whether you're considering relocating or just visiting, from their work and economies, education, and culture to their infrastructure and taxes implemented. This comparison will provide detailed information on both cities.
Distance between
Indianapolis, IN and
Mobile, AL : 639.1 miles
Indianapolis's population is larger by 377%. Its population has grown by 100,169 people (12.8%) since 2000. The population of Mobile has decreased by 13,963 people (7.0%) during that time.
Both Indianapolis and Mobile face crime issues, like most urban areas. However, Indianapolis has a higher crime rate than the national average, with property crimes being more common than violent crimes. Mobile's crime rate is also above the national average but lower than Indianapolis'. It's worth noting that in both cities, some neighborhoods have lower crime rates than others.
City-data.com crime index counts serious crimes and violent crime more heavily. It adjusts for the number of visitors and daily workers commuting into cities. (higher means more crime, U.S. average = 301.1)
City-data.com crime index counts serious crimes and violent crime more heavily. It adjusts for the number of visitors and daily workers commuting into cities. (higher means more crime, U.S. average = 301.1)
Sex Offenders
According to our data, there are 81 registered sex offenders living in Indianapolis and 463 registered sex offenders living in . The ratio of residents to sex offenders in Indianapolis is 10,525 to 1; the ratio in Mobile is 419 to 1. The number of registered sex offenders compared to the number of residents is a lot smaller in Indianapolis than in Mobile.
Cost of Living
When comparing cost of living, Indianapolis is generally more affordable than Mobile. Although housing costs in both cities are below the national average, you'll find that Indianapolis offers lower property prices and rental rates. Food, healthcare, and transportation costs are also lower in Indianapolis, contributing to its lower overall cost of living.
Income Tax
Indianapolis residents pay a flat state income tax rate of 3.23%, with an added county tax that varies. In Mobile, the state income tax rate ranges from 2% to 5% based on income level, but the city does not charge a city income tax.
Property Tax
Indianapolis's average property tax rate is about 0.845%, lower than the national average. Mobile's property tax rate is even lower, averaging around 0.542%, one of the lowest amongst major Alabama cities.
Sales Tax
Sales tax in Indianapolis is 7%, combining the Indiana state sales tax of 7%. Whereas, Mobile has a total sales tax rate of 10%, combining Mobile's city sales tax (5%) with the Alabama state sales tax (4%).
Income
Type
Indianapolis
Mobile
Estimated median household income
$58,479
$43,786
Estimated per capita income
$32,792
$28,706
Cost of living index (U.S. average is 100)
87.7
84
If you make $50,000 in Mobile, you will have to make $52,202 in Indianapolis to maintain the same standard of living.
Geographical Conditions
Indianapolis is flat and landlocked, situated in the East North Central region of the Midwestern United States. Mobile is a port city on Alabama's Gulf Coast, offering water-related recreational activities, but also the threat of hurricanes.
Indianapolis is home to a number of top-rated public, private, and charter schools, as well as renowned universities such as Butler University and Indiana University-Purdue University Indianapolis (IUPUI). Mobile also offers a variety of educational opportunities, with a strong public school system and the renowned University of South Alabama. Thus, both cities provide solid educational foundations.
Indianapolis' economy is diversified, with sectors such as education, healthcare, finance, and manufacturing playing significant roles. Mobile's economy, on the other hand, is anchored by the shipping and aerospace industries. While the average income in Indianapolis is higher, Mobile has experienced recent job growth, especially in the healthcare sector.
Biggest Employers
In Indianapolis, some of the biggest employers include Indiana University Health, St. Vincent Health, and Eli Lilly and Company. In Mobile, major employers include the University of South Alabama, Austal USA, and Mobile Infirmary Medical Center.
There were 1,221 building permits issued in Indianapolis in 2012 (704 more than in 2011) compared to 99 building permits issued in Mobile in 2012 (21 less than in 2011).
In Indianapolis (Marion County), 60.1% voted for Democrats and 37.9% for Republicans in 2012 Presidential Election. In Mobile (Mobile County), 45.1% voted for Democrats and 54.4% for Republicans.
Elections
Type
Democrats
Republicans
Other
Year
Indianapolis
Mobile
Indianapolis
Mobile
Indianapolis
Mobile
2020
63.7%
43.4%
34.5%
55.3%
1.9%
1.3%
2016
58.2%
41.8%
35.6%
55.1%
6.2%
3.1%
2012
60.1%
45.1%
37.9%
54.4%
2.0%
0.5%
2008
63.8%
45.6%
35.4%
54.4%
0.8%
0.0%
2004
50.6%
40.8%
48.7%
58.9%
0.7%
0.4%
2000
48.0%
42.0%
49.3%
56.0%
2.8%
2.0%
1996
44.6%
42.1%
47.8%
51.3%
7.7%
6.6%
Breakdown of population affiliated with a religious congregation
Type
Adherents
Congregations
Religion
Indianapolis
Mobile
Indianapolis
Mobile
CATHOLIC CHURCH
11.1%
7.7%
4.6%
5.8%
SOUTHERN BAPTIST CONVENTION
1.6%
21.9%
5.7%
19.4%
AMERICAN BAPTIST CHURCHES IN THE USA
1.2%
0.3%
3.4%
0.2%
LUTHERAN CHURCH
0.8%
0.3%
1.5%
1.0%
EVANGELICAL LUTHERAN CHURCH IN AMERICA
0.5%
0.1%
1.6%
0.3%
SEVENTH DAY ADVENTIST CHURCH
0.5%
0.6%
1.6%
0.8%
EPISCOPAL CHURCH
0.4%
1.4%
1.1%
2.5%
MUSLIM ESTIMATE
0.3%
0.4%
1.1%
0.8%
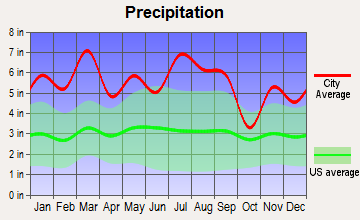
Weather
Indianapolis has a humid continental climate, with hot summers and cold winters, often experiencing snow. Meanwhile, Mobile enjoys a subtropical climate, with hot, humid summers and mild winters, making it a popular winter destination. However, Mobile is also prone to hurricanes, which is something to consider regarding safety.
Weather and climate
Type
Indianapolis
Mobile
Temperature - Average
52.1°F
66.7°F
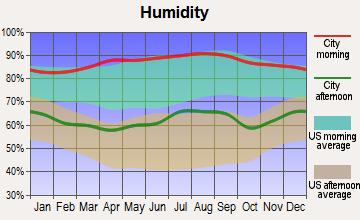
Humidity - Average morning or afternoon humidity
77%
78.1%
Humidity - Differences between morning and afternoon humidity
31%
38%
Humidity - Maximum monthly morning or afternoon humidity
86%
91%
Humidity - Minimum monthly morning or afternoon humidity
55%
53%
Precipitation - Yearly average
40.6 in
66.3 in
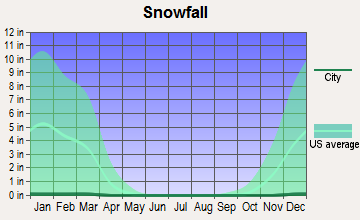
Snowfall - Yearly average
51 in
0.8 in
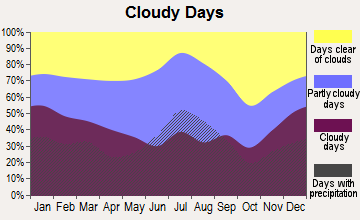
Clouds - Number of days clear of clouds
14.7%
17.1%
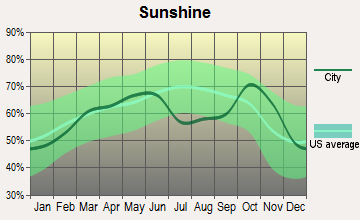
Sunshine amount - Average
56.2%
65.3%
Sunshine amount - Differences during a year
33%
23.7%
Sunshine amount - Maximum monthly
65%
70.9%
Sunshine amount - Minimum monthly
32%
47.2%
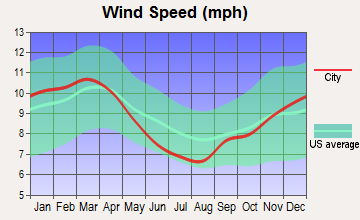
Wind speed - Average
10.3 mph
8.1 mph
Average climate in Indianapolis, Indiana
Average climate in Mobile, Alabama
Air pollution
Type
AQI
CO
NO2
OZONE
PB
PM10
PM25
SO2
Year
Indianapolis
Mobile
Indianapolis
Mobile
Indianapolis
Indianapolis
Mobile
Indianapolis
Mobile
Indianapolis
Indianapolis
Mobile
Indianapolis
Mobile
2018
94
66
0.58
N/A
13.2
N/A
23.1
24.6
N/A
N/A
18.2
N/A
10.4
8.0
0.3
0.5
2017
87
79
0.82
N/A
12.4
N/A
23.0
25.6
N/A
N/A
17.6
N/A
10.1
6.5
0.4
0.4
2016
91
72
0.62
N/A
13.0
N/A
22.5
23.6
N/A
N/A
18.0
N/A
9.9
9.5
0.4
0.6
2015
89
72
0.73
N/A
14.9
N/A
22.9
24.1
N/A
N/A
19.7
N/A
9.9
9.1
1.1
N/A
2014
100
77
0.62
N/A
16.1
N/A
25.1
25.6
N/A
N/A
20.6
N/A
12.1
N/A
3.2
N/A
2013
94
57
0.69
N/A
11.5
N/A
26.3
24.0
N/A
N/A
19.9
N/A
12.8
N/A
2.6
N/A
2012
103
70
0.65
N/A
10.4
N/A
25.7
25.9
N/A
N/A
20.8
N/A
12.9
N/A
2.9
N/A
2011
105
86
0.68
N/A
11.3
N/A
22.9
28.0
N/A
N/A
N/A
N/A
16.3
N/A
2.4
N/A
2010
101
96
0.54
N/A
12.7
N/A
21.6
27.4
N/A
N/A
N/A
N/A
15.9
N/A
3.3
N/A
2009
97
67
0.73
N/A
11.4
N/A
23.2
25.5
N/A
N/A
N/A
N/A
13.8
N/A
1.9
N/A
2008
91
85
0.62
N/A
11.5
N/A
N/A
25.5
0.010
N/A
N/A
N/A
13.2
N/A
3.0
N/A
2007
103
100
0.69
N/A
13.1
N/A
N/A
28.1
0.011
N/A
N/A
N/A
14.9
N/A
3.6
N/A
2006
95
100
0.59
N/A
14.5
N/A
N/A
29.8
0.009
N/A
N/A
N/A
14.5
N/A
3.6
N/A
2005
121
69
0.65
N/A
15.2
N/A
N/A
27.5
0.014
N/A
N/A
N/A
18.0
N/A
4.3
0.9
2004
104
72
0.62
N/A
15.8
N/A
N/A
27.1
0.010
N/A
N/A
N/A
15.1
N/A
4.6
1.1
2003
113
74
0.67
0.33
16.6
N/A
N/A
25.7
0.010
0.003
N/A
N/A
15.8
N/A
4.2
1.9
2002
125
68
0.76
N/A
17.4
N/A
N/A
26.0
0.009
N/A
N/A
N/A
16.8
N/A
3.9
0.6
2001
105
84
0.81
N/A
16.6
N/A
N/A
26.2
0.031
N/A
N/A
N/A
16.3
N/A
3.8
N/A
2000
98
111
0.87
N/A
17.3
N/A
N/A
30.6
N/A
N/A
N/A
N/A
N/A
N/A
4.5
1.1
Natural disasters
Type
Indianapolis
Mobile
Tornado activity compared to U.S. average
226.7%
130.1%
Earthquake activity compared to U.S. average
179.6%
42.8%
Natural disasters compared to U.S. average
16%
31%
Transportation
Indianapolis public transit is served by IndyGo, providing bus services across the city. It has also launched Red Line, its first rapid transit line. In Mobile, the Wave Transit System operates bus routes throughout the city. However, both cities are heavily car-dependent and commuting times can be longer during peak hours.
Transport
Type
Indianapolis
Mobile
Amtrak stations
1
1
Amtrak stations nearby
1
1
FAA registered aircraft
739
155
FAA registered aircraft manufacturers and dealers
18
15
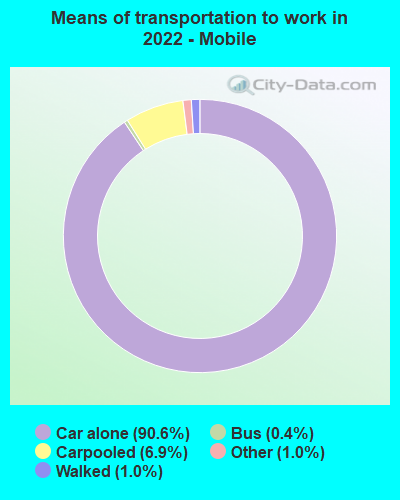
Means of transportation to work
Type
Indianapolis
Mobile
Bicycle
0.5%
0%
Bus
1.2%
0.5%
Carpooled
8.5%
6.7%
Car alone
87.3%
91%
Walked
1.6%
0.9%
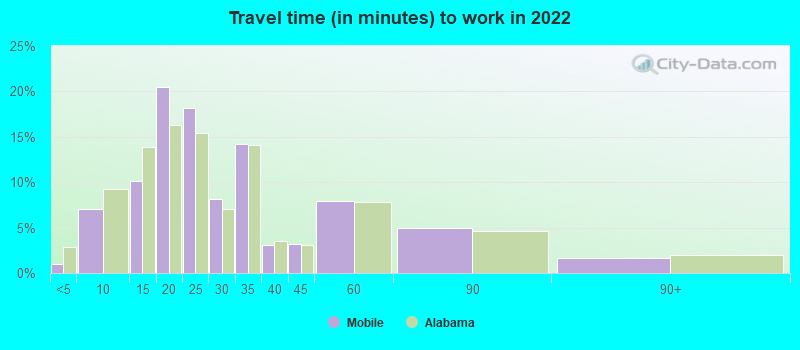
Average travel time to work
Type
Indianapolis
Mobile
Average
28.1 min
26.7 min
Other means
22.5 min
22.2 min
Public transportation
40.2 min
42.5 min
Private vehicle occupancy
Type
Indianapolis
Mobile
Average
1.2
1.1
Drove alone
88.2%
91.4%
In 2 person carpool
9.4%
6.7%
In 3 person carpool
1.3%
0.8%
In 4 person carpool
0.5%
0.8%
In 5-6 person carpool
0.4%
0.1%
In 7+ person carpool
0.1%
0.2%
How many people usually rode to work in the car, truck or van.
Real Estate
Real estate in Indianapolis is generally more affordable with a median home cost lower than the national average. In contrast, Mobile's real estate market is a bit more expensive, but still affordable compared to many coastal cities. Both cities offer a variety of housing options, from downtown apartments to suburban homes.
Neighborhoods
Indianapolis neighborhoods like Broad Ripple Village and Fountain Square are known for their vibrant arts scenes and foodie culture. Mobile's neighborhoods such as the Garden District and Midtown feature beautiful historic homes and a relaxed, southern charm.
Houses and residents
Type
Indianapolis
Mobile
Houses
399,820
88,507
Average household size (people)
2.4
2.4
Median year apartment built
1977
1977
Median year house/condo built
1971
1972
Length of stay in the house since moving in
13 years
15.4 years
Houses occupied
358,150 (89.6%)
77,991 (88.1%)
Houses occupied by owners
201,149 (56.2%)
41,443 (53.1%)
Houses occupied by renters
157,001 (43.8%)
36,548 (46.9%)
Median rent asked for vacant for-rent units
$876.58
$503.72
Median monthly housing costs
$980
$905
Median price asked for vacant for-sale houses and condos
$283,027
$139,357
Estimated median house or condo value
$188,700
$158,200
Median numbers of rooms
5.5
5.7
Median number of rooms in apartments
4.3
4.6
Median number of rooms in houses and condos
6.5
6.8
Median house price - detached houses
$231,490
$207,085
Median house price - in 2-unit structures
$257,253
$45,114
Median house price - in 3-to-4-unit structures
$240,688
$220,201
Median house price - in 5 or more unit structures
$247,275
$224,513
Median house price - mobile homes
$58,413
$98,232
Median house price - Townhouses or other attached units
$222,424
$226,950
Median house price - All housing units
$229,666
$206,375
Median house age
48
48
Renting percentage
44.2%
43.6%
Housing density (houses/condos per square mile)
1,106.1
750.7
House value disparities
36.1%
42.6%
Household income disparities
44.4%
48.9%
Median household income for houses/condes with a mortgage
$86,008
$68,706
Median household income for apartments without a mortgage
$61,922
$51,029
Housing units without a mortgage
4,552 (3.2%)
944 (3.9%)
Housing units with both a second mortgage and home equity loan
9,787 (6.8%)
1,217 (5%)
Housing units with a mortgage
138,622 (96.8%)
23,333 (96.1%)
Housing units with a home equity loan
271 (0.2%)
0 (0%)
Housing units with a second mortgage
12,987 (9.1%)
1,542 (6.4%)
House/condo owner moved in on average (years ago)
11
15
House/condo renter moved in on average (years ago)
1
1
Housing units lacking complete kitchen facilities
3.4%
5.9%
Housing units lacking complete plumbing facilities
1.1%
4.8%
Housing units in structures
Housing units in structures
Indianapolis
Mobile
One, detached
59.0%
68.1%
One, attached
9.2%
1.7%
Two
2.5%
2.6%
3 or 4
6.2%
2.6%
5 to 9
7.7%
7.7%
10 to 19
6.3%
8.7%
20 to 49
3.1%
3.8%
50 or more
5.0%
3.4%
Mobile homes
1.0%
1.3%
Median real estate property taxes paid for housing units
Self-employed workers in own not incorporated business
17,131
4,678
State government workers
15,502
5,996
Unpaid family workers
1,601
0
Industries and Occupations
In Indianapolis, the healthcare, education, and retail sectors dominate, with plenty of opportunities for professionals in these fields. Mobile's dominant industries include aerospace, shipping, steel processing, and healthcare. Both cities offer a variety of jobs with diverse industry sectors.
Both Indianapolis and Mobile offer quality healthcare services. Indianapolis has numerous hospitals and healthcare facilities, including the nationally-ranked Indiana University Health Medical Center. Mobile also offers excellent health services, with facilities such as the University of South Alabama's hospitals and Mobile Infirmary Medical Center.
Health (county statistics)
Type
Indianapolis
Mobile
General health status score of residents in this county from 1 (poor) to 5 (excellent)
The infrastructure of Indianapolis is typically Midwestern, with a grid-based street layout and impressive skyscrapers. Mobile's infrastructure is more historic, featuring Southern architecture with Spanish and French influences. Both cities have faced infrastructure challenges associated with growth and aging systems, but they are taking steps to address these issues.
Infrastructure
Type
Indianapolis
Mobile
Hospitals
76
14
TV stations
19
15
Arenas or stadiums
3
3
Bank branches located here
259
97
Bank institutions located here
27
20
Main business address for public companies
28
3
Drinking water stations with no reported violations in the past
1
0
Drinking water stations with reported violations in the past
HMDA - Conventional home purchase loans - Applications denied
Year
Indianapolis
Mobile
1999
3,358
1,147
2000
3,562
806
2001
2,649
462
2002
1,915
340
2003
2,519
392
2004
3,702
625
2005
6,057
817
2006
5,811
903
2007
3,456
550
2008
1,247
269
2009
565
120
Culture and Food
Indianapolis has a thriving cultural scene, with world-class museums, a vibrant performing arts community, and a diverse culinary scene. Mobile, known as the birthplace of Mardi Gras, also boasts a rich cultural heritage, culinary diversity, and a vibrant arts scene.
Sports Teams
Indianapolis is home to prominent sports teams such as the Indianapolis Colts (NFL) and the Indiana Pacers (NBA). Mobile does not host any major league sports teams, but it does have a rich sporting culture, especially in college football.


 Indianapolis, IN and
  Mobile, AL : 639.1 miles