Indianapolis, Indiana

Indianapolis: Bank One building, downtown Indy. Photographed from the north, from the steps of the WWI Memorial

Indianapolis: Medal of Honor Memorial, Indianapolis, Indiana

Indianapolis: The WWI Memorial on the War Memorial Mall, Downtown Indy

Indianapolis: Indianapolis

Indianapolis: Indianapolis statehouse

Indianapolis: DOWNTOWN INDIANAPOLIS ACROSS FROM "WHITE RIVER"

Indianapolis: Flamingos dance for the turtles at the Indianapolis Zoo!

Indianapolis: Start of the River Walk

Indianapolis: Walking down Meridian to Monument Circle

Indianapolis: Indy Motor Speedway

Indianapolis: Indianapolis 500 Track
- see
75
more - add
your
Submit your own pictures of this city and show them to the world
- OSM Map
- General Map
- Google Map
- MSN Map
Population change since 2000: +12.6%
 |
| Males: 431,317 | |
| Females: 449,304 |
| Median resident age: | 34.3 years |
| Indiana median age: | 38.2 years |
Zip codes: 46113, 46183, 46201, 46202, 46204, 46205, 46208, 46214, 46217, 46218, 46219, 46220, 46221, 46222, 46224, 46225, 46226, 46235, 46236, 46239, 46241, 46254, 46259, 46268, 46278.
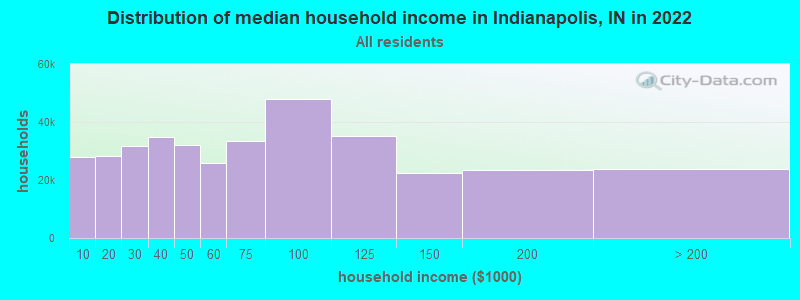
Indianapolis Zip Code Map| Indianapolis: | $61,501 |
| IN: | $66,785 |
Estimated per capita income in 2022: $35,856 (it was $21,640 in 2000)
Indianapolis city income, earnings, and wages data
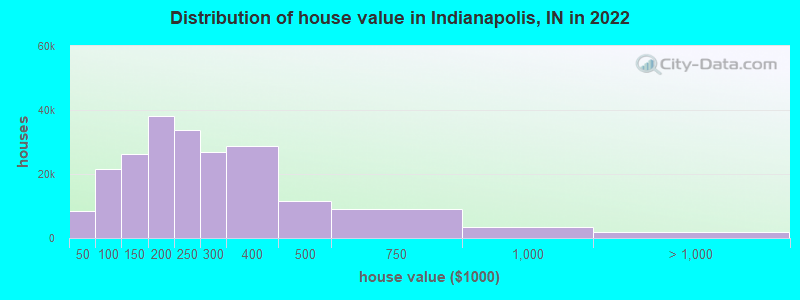
Estimated median house or condo value in 2022: $216,700 (it was $96,600 in 2000)
| Indianapolis: | $216,700 |
| IN: | $208,700 |
Mean prices in 2022: all housing units: $252,023; detached houses: $259,483; townhouses or other attached units: $202,202; in 2-unit structures: $146,803; in 3-to-4-unit structures: $148,136; in 5-or-more-unit structures: $286,392; mobile homes: $27,532
Median gross rent in 2022: $1,039.
(9.5% for White Non-Hispanic residents, 26.1% for Black residents, 22.7% for Hispanic or Latino residents, 16.8% for American Indian residents, 6.3% for Native Hawaiian and other Pacific Islander residents, 29.2% for other race residents, 14.1% for two or more races residents)
Detailed information about poverty and poor residents in Indianapolis, IN


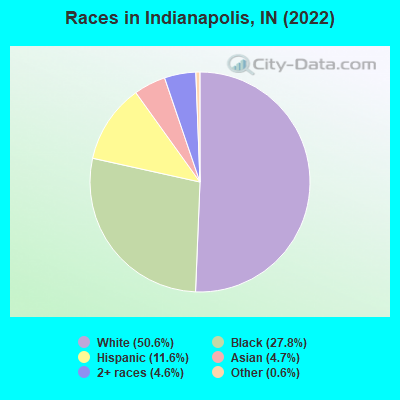
- 443,20750.6%White alone
- 244,02327.8%Black alone
- 102,07511.6%Hispanic
- 40,7614.7%Asian alone
- 40,2074.6%Two or more races
- 5,5820.6%Other race alone
- 4460.05%American Indian alone
- 2630.03%Native Hawaiian and Other
Pacific Islander alone
Races in Indianapolis detailed stats: ancestries, foreign born residents, place of birth
According to our research of Indiana and other state lists, there were 81 registered sex offenders living in Indianapolis, Indiana as of April 27, 2024.
The ratio of all residents to sex offenders in Indianapolis is 10,525 to 1.
The ratio of registered sex offenders to all residents in this city is much lower than the state average.
The City-Data.com crime index weighs serious crimes and violent crimes more heavily. Higher means more crime, U.S. average is 246.1. It adjusts for the number of visitors and daily workers commuting into cities.
- means the value is much bigger than the state average.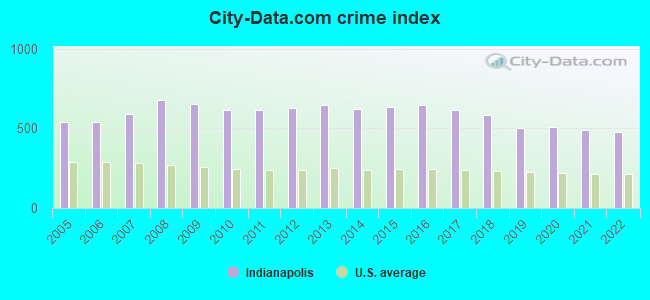
Crime rate in Indianapolis detailed stats: murders, rapes, robberies, assaults, burglaries, thefts, arson
Full-time law enforcement employees in 2020, including police officers: 2,656 (2,086 officers - 1,788 male; 298 female).
| Officers per 1,000 residents here: | 2.34 |
| Indiana average: | 2.12 |
 Recent articles from our blog. Our writers, many of them Ph.D. graduates or candidates, create easy-to-read articles on a wide variety of topics.

 | Asian American moving to Indianapolis. (15 replies) |
| Should I move from Portland, OR to Indianapolis? (43 replies) |
| Indianapolis Catholic Schools (5 replies) |
| Where is Indiana/Indianapolis heading? (186 replies) |
| Recent Visit to Indianapolis reviewed (10 replies) |
| Latino / Hispanic Population in & around Indianapolis (23 replies) |
Latest news from Indianapolis, IN collected exclusively by city-data.com from local newspapers, TV, and radio stations
Ancestries: German (9.0%), American (7.8%), English (5.2%), African (4.1%), Irish (4.0%), European (2.1%).
Current Local Time: EST time zone
Elevation: 717 feet
Land area: 361.5 square miles.
Population density: 2,436 people per square mile (low).
99,612 residents are foreign born (4.6% Latin America, 3.1% Asia, 2.0% Africa).
| This city: | 11.3% |
| Indiana: | 5.6% |
Median real estate property taxes paid for housing units with mortgages in 2022: $1,986 (0.9%)
Median real estate property taxes paid for housing units with no mortgage in 2022: $1,544 (0.9%)
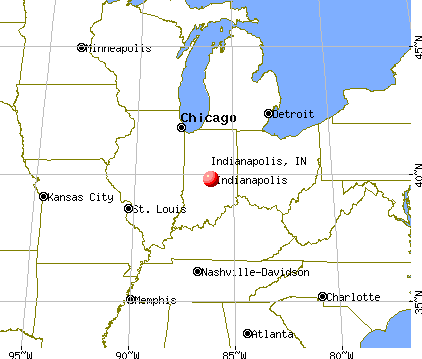
Nearest city with pop. 1,000,000+: Chicago, IL  (162.9 miles , pop. 2,896,016).
Nearest cities:
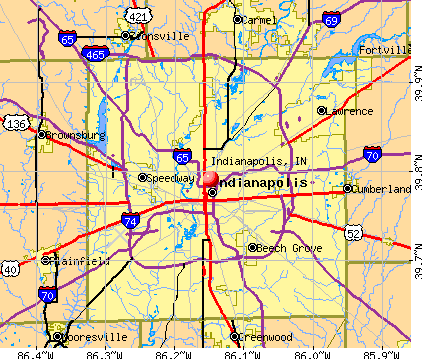
), ), Latitude: 39.79 N, Longitude: 86.15 W
Daytime population change due to commuting: +112,259 (+12.8%)
Workers who live and work in this city: 341,187 (77.0%)
Area codes: 317, 765

Detailed articles:
- Indianapolis: Introduction
- Indianapolis Basic Facts
- Indianapolis: Communications
- Indianapolis: Convention Facilities
- Indianapolis: Economy
- Indianapolis: Education and Research
- Indianapolis: Geography and Climate
- Indianapolis: Health Care
- Indianapolis: History
- Indianapolis: Municipal Government
- Indianapolis: Population Profile
- Indianapolis: Recreation
- Indianapolis: Transportation
Indianapolis tourist attractions:
- Castleton Square Mall in Indianapolis, Indiana
- Circle Center Mall in Indianapolis, Indiana
- Conseco Fieldhouse - Indianapolis - Home to the Pacers Hosts World Class Events in Comfortable Environment for Fans and Visitors
- Crowne Plaza Indianapolis Downtown (Union Station): Indianapolis' Fun and Historic Hotel
- The Fashion Mall at Keystone - Indianapolis, IN - Premier Shopping Venue in Central Indiana
- Garfield Park Conservatory And Sunken Gardens in Indianapolis, Indiana
- Glendale Town Center - Indianapolis, Indiana - Offering Convenient Shopping for Five Decades
- Indianapolis Hall of Fame Museum (at the Motor Speedway) - Indianapolis, Indiana - Auto Racing History on Display at Indy500 Track
- Indianapolis Motor Speedway - Indianapolis, Indiana - Leader in Auto Racing in Heart of the Midwest Since 1909
- Irvington Historic District in Indianapolis, Indiana
- Lafayette Square Mall - Indianapolis, Indiana - Indiana's First & Oldest Indoor Mall
- Lucas Oil Stadium - Indianapolis, Indiana - home of the NFL's Indianapolis Colts
- Marriott - Indianapolis Downtown
- Embassy Suites Hotel Indianapolis Downtown
- Hilton Indianapolis
- Sheraton Indianapolis City Centre Hotel: Indianapolis' Premier Downtown Business Hotel
- Sheraton Indianapolis Hotel & Suites: One of Indianapolis' Business-Class Hotels
- The Fort Golf Resort, Indianapolis, Indiana - An 18-Hole Championship Golf Course, Redesigned by Pete Dye
- The Children's Museum in Indianapolis, Indiana
- The Conrad Hotel in Indianapolis, Indiana
- The Indianapolis Zoo in Indianapolis, Indiana
- The Indiana Medical History Museum in Indianapolis, Indiana
- The Omni Severin in Indianapolis, Indiana
- University Place Conference Center & Hotel Indianapolis: One of Indianapolis' Finest Conference Centers
- Washington Square Mall - Indianapolis, Indiana - Offering Indy's Best Shopping
Indianapolis, Indiana accommodation & food services, waste management - Economy and Business Data
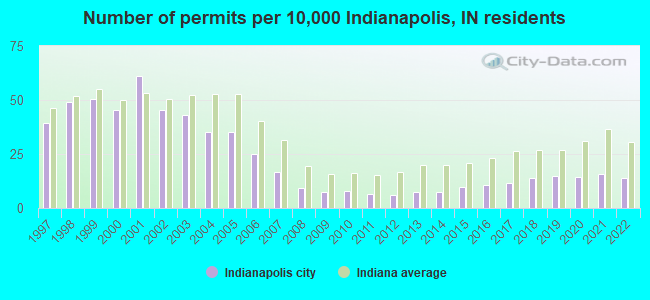
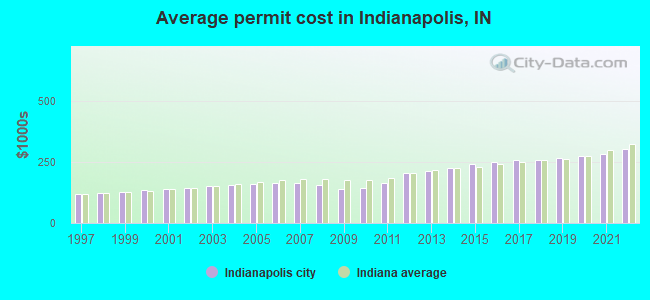
Single-family new house construction building permits:
- 2022: 1099 buildings, average cost: $303,100
- 2021: 1221 buildings, average cost: $283,900
- 2020: 1108 buildings, average cost: $276,900
- 2019: 1153 buildings, average cost: $265,900
- 2018: 1090 buildings, average cost: $258,600
- 2017: 914 buildings, average cost: $257,800
- 2016: 831 buildings, average cost: $251,500
- 2015: 743 buildings, average cost: $243,600
- 2014: 572 buildings, average cost: $226,200
- 2013: 562 buildings, average cost: $212,000
- 2012: 472 buildings, average cost: $205,300
- 2011: 517 buildings, average cost: $166,300
- 2010: 619 buildings, average cost: $143,800
- 2009: 587 buildings, average cost: $141,400
- 2008: 734 buildings, average cost: $155,400
- 2007: 1317 buildings, average cost: $165,600
- 2006: 1947 buildings, average cost: $162,800
- 2005: 2760 buildings, average cost: $158,600
- 2004: 2737 buildings, average cost: $155,300
- 2003: 3375 buildings, average cost: $152,000
- 2002: 3532 buildings, average cost: $144,100
- 2001: 4765 buildings, average cost: $140,200
- 2000: 3534 buildings, average cost: $136,500
- 1999: 3962 buildings, average cost: $127,400
- 1998: 3820 buildings, average cost: $122,400
- 1997: 3063 buildings, average cost: $121,100
| Here: | 2.8% |
| Indiana: | 2.8% |
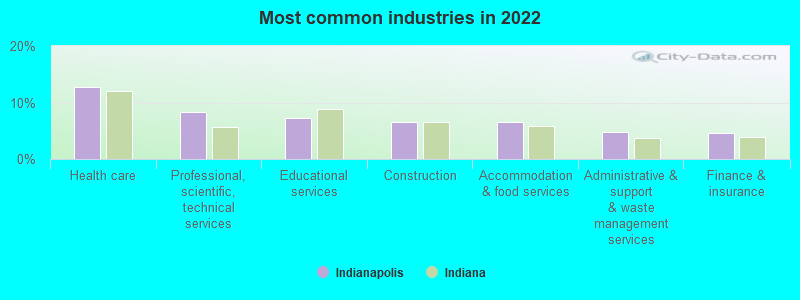
- Health care (12.7%)
- Professional, scientific, technical services (8.4%)
- Educational services (7.3%)
- Construction (6.5%)
- Accommodation & food services (6.5%)
- Administrative & support & waste management services (4.7%)
- Finance & insurance (4.6%)
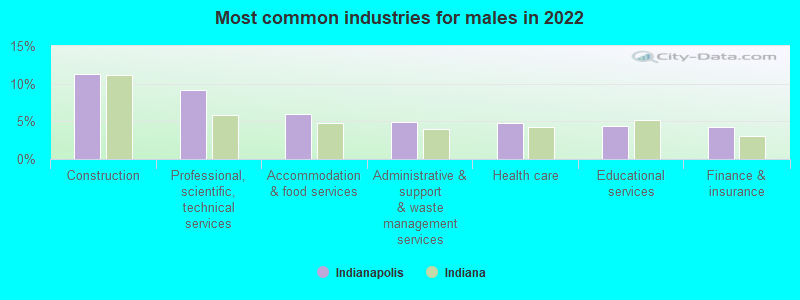
- Construction (11.2%)
- Professional, scientific, technical services (9.1%)
- Accommodation & food services (6.0%)
- Administrative & support & waste management services (5.0%)
- Health care (4.8%)
- Educational services (4.4%)
- Finance & insurance (4.2%)
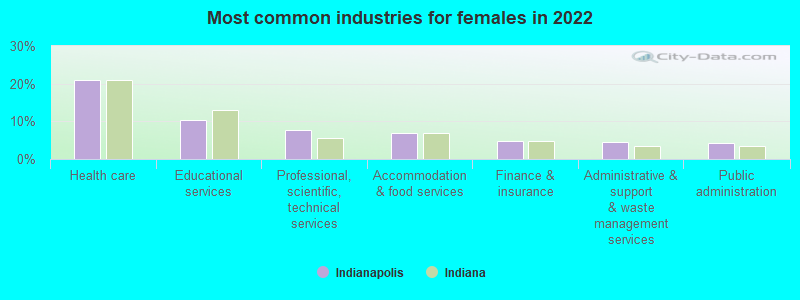
- Health care (21.0%)
- Educational services (10.4%)
- Professional, scientific, technical services (7.6%)
- Accommodation & food services (7.0%)
- Finance & insurance (4.9%)
- Administrative & support & waste management services (4.4%)
- Public administration (4.3%)
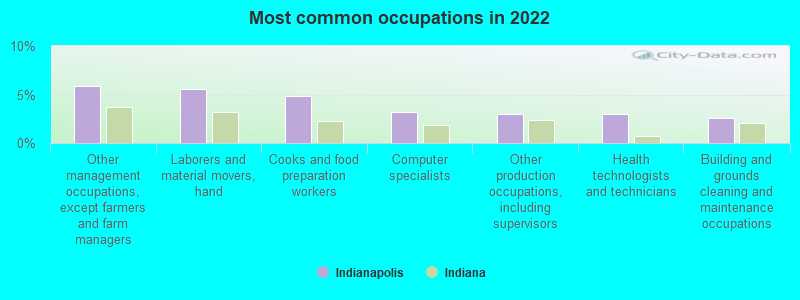
- Other management occupations, except farmers and farm managers (5.9%)
- Laborers and material movers, hand (5.6%)
- Cooks and food preparation workers (4.8%)
- Computer specialists (3.2%)
- Other production occupations, including supervisors (3.0%)
- Health technologists and technicians (3.0%)
- Building and grounds cleaning and maintenance occupations (2.6%)
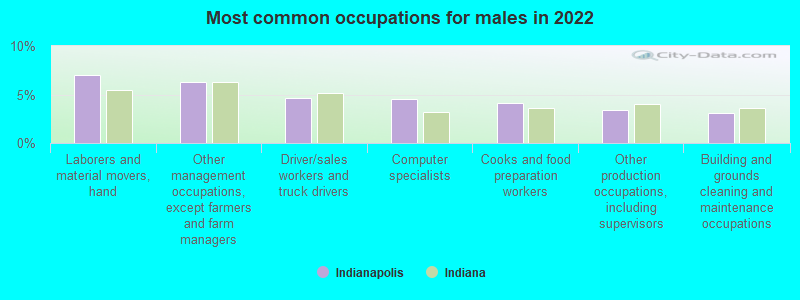
- Laborers and material movers, hand (7.0%)
- Other management occupations, except farmers and farm managers (6.3%)
- Driver/sales workers and truck drivers (4.7%)
- Computer specialists (4.6%)
- Cooks and food preparation workers (4.1%)
- Other production occupations, including supervisors (3.4%)
- Building and grounds cleaning and maintenance occupations (3.0%)
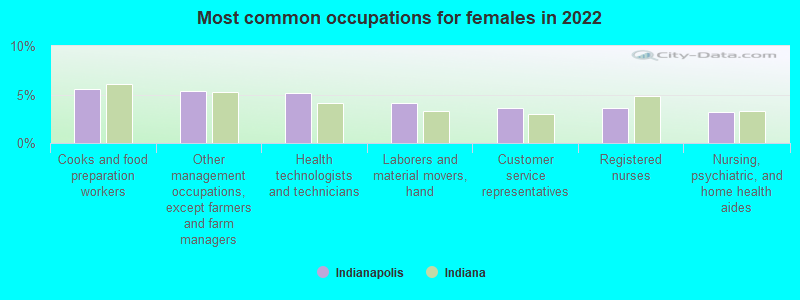
- Cooks and food preparation workers (5.6%)
- Other management occupations, except farmers and farm managers (5.4%)
- Health technologists and technicians (5.2%)
- Laborers and material movers, hand (4.1%)
- Customer service representatives (3.6%)
- Registered nurses (3.6%)
- Nursing, psychiatric, and home health aides (3.2%)
Average climate in Indianapolis, Indiana
Based on data reported by over 4,000 weather stations


|
|

(lower is better)
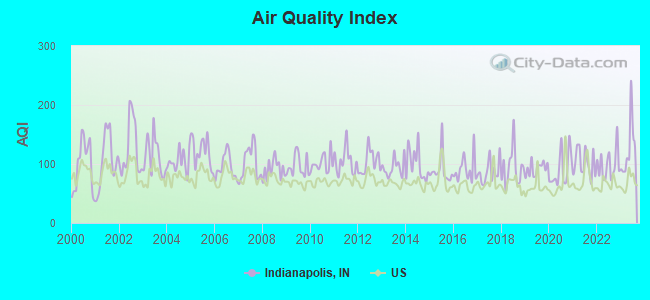
Air Quality Index (AQI) level in 2023 was 125. This is significantly worse than average.
| City: | 125 |
| U.S.: | 73 |
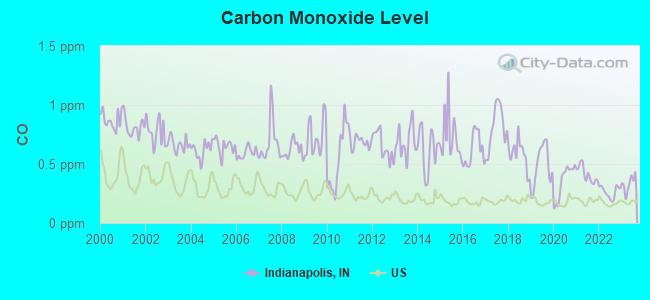
Carbon Monoxide (CO) [ppm] level in 2023 was 0.333. This is worse than average. Closest monitor was 0.9 miles away from the city center.
| City: | 0.333 |
| U.S.: | 0.251 |
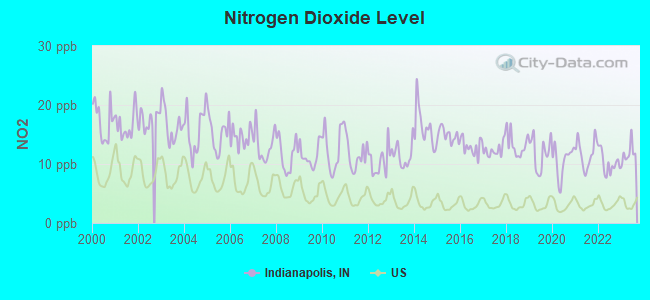
Nitrogen Dioxide (NO2) [ppb] level in 2023 was 11.8. This is significantly worse than average. Closest monitor was 0.9 miles away from the city center.
| City: | 11.8 |
| U.S.: | 5.1 |
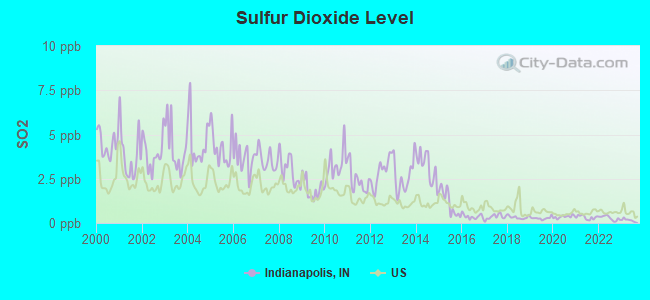
Sulfur Dioxide (SO2) [ppb] level in 2023 was 0.165. This is significantly better than average. Closest monitor was 1.1 miles away from the city center.
| City: | 0.165 |
| U.S.: | 1.515 |
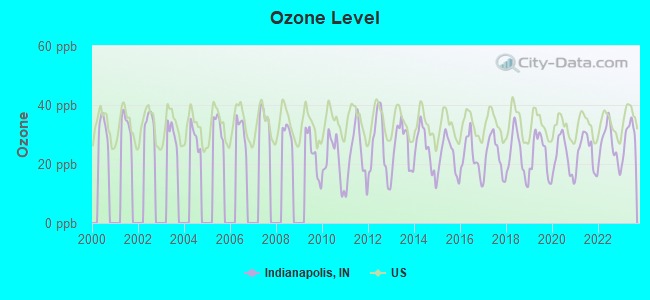
Ozone [ppb] level in 2023 was 29.3. This is about average. Closest monitor was 0.9 miles away from the city center.
| City: | 29.3 |
| U.S.: | 33.3 |
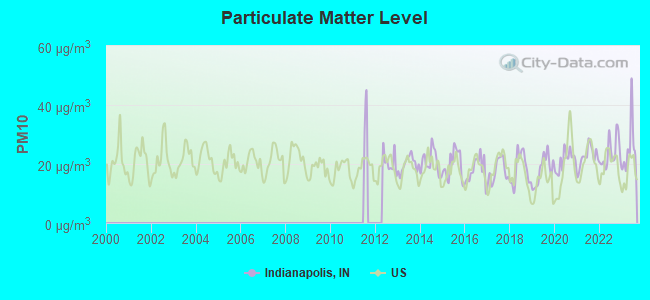
Particulate Matter (PM10) [µg/m3] level in 2023 was 25.4. This is worse than average. Closest monitor was 1.6 miles away from the city center.
| City: | 25.4 |
| U.S.: | 19.2 |
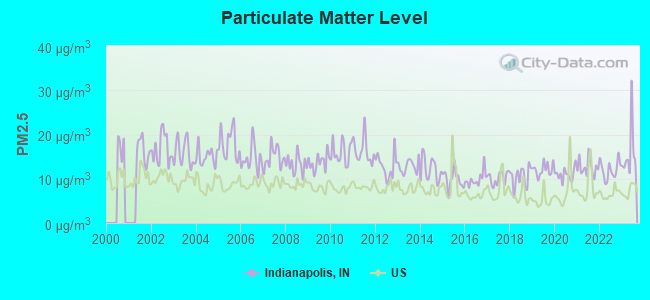
Particulate Matter (PM2.5) [µg/m3] level in 2023 was 15.8. This is significantly worse than average. Closest monitor was 0.9 miles away from the city center.
| City: | 15.8 |
| U.S.: | 8.1 |
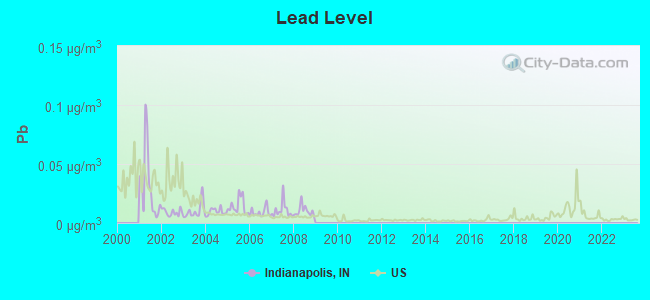
Lead (Pb) [µg/m3] level in 2008 was 0.0101. This is about average. Closest monitor was 0.6 miles away from the city center.
| City: | 0.0101 |
| U.S.: | 0.0093 |
Tornado activity:
Indianapolis-area historical tornado activity is slightly above Indiana state average. It is 127% greater than the overall U.S. average.
On 5/14/1972, a category F4 (max. wind speeds 207-260 mph) tornado 3.9 miles away from the Indianapolis city center injured 20 people and caused between $50,000 and $500,000 in damages.
On 6/11/1998, a category F4 tornado 10.5 miles away from the city center injured 4 people and caused $2 million in damages.
Earthquake activity:
Indianapolis-area historical earthquake activity is significantly above Indiana state average. It is 80% greater than the overall U.S. average.On 4/18/2008 at 09:36:59, a magnitude 5.4 (5.1 MB, 4.8 MS, 5.4 MW, 5.2 MW, Class: Moderate, Intensity: VI - VII) earthquake occurred 131.4 miles away from Indianapolis center
On 4/18/2008 at 09:36:59, a magnitude 5.2 (5.2 MW, Depth: 8.9 mi) earthquake occurred 131.5 miles away from the city center
On 6/10/1987 at 23:48:54, a magnitude 5.1 (4.9 MB, 4.4 MS, 4.6 MS, 5.1 LG) earthquake occurred 114.7 miles away from Indianapolis center
On 7/27/1980 at 18:52:21, a magnitude 5.2 (5.1 MB, 4.7 MS, 5.0 UK, 5.2 UK) earthquake occurred 161.5 miles away from the city center
On 6/18/2002 at 17:37:15, a magnitude 5.0 (4.3 MB, 4.6 MW, 5.0 LG) earthquake occurred 152.6 miles away from the city center
On 4/18/2008 at 15:14:16, a magnitude 4.8 (4.5 MB, 4.8 MW, 4.6 MW, Class: Light, Intensity: IV - V) earthquake occurred 128.8 miles away from Indianapolis center
Magnitude types: regional Lg-wave magnitude (LG), body-wave magnitude (MB), surface-wave magnitude (MS), moment magnitude (MW)
Natural disasters:
The number of natural disasters in Marion County (16) is near the US average (15).Major Disasters (Presidential) Declared: 11
Emergencies Declared: 4
Causes of natural disasters: Floods: 8, Storms: 8, Tornadoes: 6, Winter Storms: 3, Snows: 2, Blizzard: 1, Hurricane: 1, Snowstorm: 1, Other: 1 (Note: some incidents may be assigned to more than one category).
Main business address for: CELADON GROUP INC (TRUCKING (NO LOCAL)), DUKE REALTY LIMITED PARTNERSHIP/ (REAL ESTATE), IPALCO ENTERPRISES, INC. (ELECTRIC SERVICES), LILLY ELI & CO (PHARMACEUTICAL PREPARATIONS), INTERACTIVE INTELLIGENCE INC (SERVICES-PREPACKAGED SOFTWARE), WELLPOINT INC (HOSPITAL & MEDICAL SERVICE PLANS), SIMON PROPERTY GROUP INC /DE/ (REAL ESTATE INVESTMENT TRUSTS), MARSH SUPERMARKETS INC (RETAIL-GROCERY STORES) and 20 other public companies.
Hospitals in Indianapolis:
- ADVENTA HOSPICE (8435 GEORGETOWN RD, STE 1000)
- COMMUNITY ALTERNATIVES-ADEPT (7859 DELBROOK DR)
- DEVELOPMENTAL SERVICE ALTERNAT (3708 LUEWAN DR)
- FRANCISCAN ST FRANCIS HEALTH - INDIANAPOLIS (Voluntary non-profit - Church, 8111 S EMERSON AVE)
- INDIANA SURGERY CENTER SOUTH (1500 E COUNTY LINE ROAD, SUITE 100)
- NAAB ROAD SURGERY CENTER LLC (8260 NAAB ROAD)
- REM-INDIANA INC (5662 N CRESTVIEW AVE)
- ST VINCENT NEW HOPE INC (9001 N HOLLIDAY DR)
- TRANSITIONAL SERVICES INC (4155 RAY ST)
- VOCA CORPORATION OF INDIANA (4916 E WASHINGTON ST)
Airports and heliports located in Indianapolis:
- Indianapolis International Airport (IND) (Runways: 3, Commercial Ops: 102,036, Air Taxi Ops: 32,961, Itinerant Ops: 13,172, Military Ops: 730)
- Indianapolis Metropolitan Airport (UMP) (Runways: 1, Air Taxi Ops: 6,817, Itinerant Ops: 12,433, Local Ops: 19,651, Military Ops: 1,204)
- Eagle Creek Airpark Airport (EYE) (Runways: 1, Air Taxi Ops: 2,155, Itinerant Ops: 12,690, Local Ops: 20,411)
- Indianapolis Executive Airport (TYQ) (Runways: 1, Air Taxi Ops: 2,091, Itinerant Ops: 17,429, Local Ops: 15,338)
- Indianapolis Regional Airport (MQJ) (Runways: 2, Air Taxi Ops: 5,577, Itinerant Ops: 17,429, Local Ops: 11,852)
- Hendricks County-Gordon Graham Fld Airport (2R2) (Runways: 1, Air Taxi Ops: 287, Itinerant Ops: 6,291, Local Ops: 7,200, Military Ops: 574)
- Post-Air Airport (7L8) (Runways: 1, Itinerant Ops: 210, Local Ops: 1,890)
- Heliports: 20
Biggest Colleges/Universities in Indianapolis:
- Ivy Tech Community College (Full-time enrollment: 71,493; Location: 50 W. Fall Creek Parkway N. Drive; Public; Website: www.ivytech.edu)
- Indiana University-Purdue University-Indianapolis (Full-time enrollment: 22,751; Location: 425 University Blvd; Public; Website: www.iupui.edu; Offers Doctor's degree)
- ITT Technical Institute-Indianapolis (Full-time enrollment: 4,765; Location: 9511 Angola Ct; Private, for-profit; Website: www.itt-tech.edu; Offers Master's degree)
- University of Indianapolis (Full-time enrollment: 4,625; Location: 1400 E Hanna Ave; Private, not-for-profit; Website: uindy.edu; Offers Doctor's degree)
- Butler University (Full-time enrollment: 4,388; Location: 4600 Sunset Ave; Private, not-for-profit; Website: www.butler.edu; Offers Doctor's degree)
- Harrison College-Indianapolis (Full-time enrollment: 4,244; Location: 550 East Washington Street; Private, for-profit; Website: harrison.edu)
- American College of Education (Full-time enrollment: 2,718; Location: 101 West Ohio Street, Suite 1200; Private, for-profit; Website: www.ace.edu; Offers Doctor's degree)
- Marian University (Full-time enrollment: 2,476; Location: 3200 Cold Spring Rd; Private, not-for-profit; Website: www.marian.edu; Offers Doctor's degree)
- MedTech College (Full-time enrollment: 1,481; Location: 6612 E 75th St Suite 300; Private, for-profit; Website: www.medtech.edu/)
- Lincoln College of Technology-Indianapolis (Full-time enrollment: 1,245; Location: 7225 Winton Drive - Building 128; Private, for-profit; Website: www.lincolntech.com)
- Brown Mackie College-Indianapolis (Full-time enrollment: 1,084; Location: 1200 N Meridian St, Ste 100; Private, for-profit; Website: www.brownmackie.edu)
- The Art Institute of Indianapolis (Full-time enrollment: 880; Location: 3500 DePauw Blvd, Suite 1010; Private, for-profit; Website: www.aii.edu/indianapolis)
- Kaplan College-Indianapolis (Full-time enrollment: 655; Location: 4200 S East St Ste 7; Private, for-profit; Website: www.kaplancollege.com/indianapolis-in/)
- DeVry University-Indiana (Full-time enrollment: 500; Location: 9100 Keystone Crossing, Ste. 100; Private, for-profit; Website: www.devry.edu; Offers Master's degree)
- Martin University (Full-time enrollment: 437; Location: 2171 Avondale Place; Private, not-for-profit; Website: www.martin.edu; Offers Master's degree)
- University of Phoenix-Indianapolis Campus (Full-time enrollment: 399; Location: 7999 Knue Rd; Private, for-profit; Website: www.phoenix.edu; Offers Master's degree)
- International Business College-Indianapolis (Full-time enrollment: 385; Location: 7205 Shadeland Station; Private, for-profit; Website: www.ibcindianapolis.edu)
- Kaplan College-Indianapolis (Full-time enrollment: 370; Location: 7302 Woodland Dr; Private, for-profit; Website: www.kaplancollege.com/nw-indianapolis-in/)
- Aviation Institute of Maintenance-Indianapolis (Full-time enrollment: 277; Location: 7251 W McCarty St; Private, for-profit; Website: www.aviationmaintenance.edu)
- ITT Technical Institute-Indianapolis East (Full-time enrollment: 270; Location: 2525 N Shadeland Ave; Private, for-profit; Website: www.itt-tech.edu)
Biggest public high schools in Indianapolis:
- WARREN CENTRAL HIGH SCHOOL (Students: 3,894, Location: 9500 E 16TH ST, Grades: 9-12)
- NORTH CENTRAL HIGH SCHOOL (Students: 3,380, Location: 1801 E 86TH ST, Grades: 9-12)
- BEN DAVIS HIGH SCHOOL (Students: 3,305, Location: 1200 N GIRLS SCH RD, Grades: 10-12)
- PIKE HIGH SCHOOL (Students: 2,864, Location: 5401 W 71ST ST, Grades: 9-12)
- LAWRENCE NORTH HIGH SCHOOL (Students: 2,853, Location: 7802 N HAGUE RD, Grades: 9-12)
- LAWRENCE CENTRAL HIGH SCHOOL (Students: 2,306, Location: 7300 E 56TH ST, Grades: 9-12)
- FRANKLIN CENTRAL HIGH SCHOOL (Students: 2,251, Location: 6215 S FRANKLIN RD, Grades: 9-12)
- ARSENAL TECHNICAL HIGH SCHOOL (Students: 2,243, Location: 1500 E MICHIGAN ST, Grades: 9-12)
- PERRY MERIDIAN HIGH SCHOOL (Students: 2,132, Location: 401 W MERIDIAN SCHOOL RD, Grades: 9-12)
- SOUTHPORT HIGH SCHOOL (Students: 1,889, Location: 971 E BANTA RD, Grades: 9-12)
Biggest private high schools in Indianapolis:
- HERITAGE CHRISTIAN SCHOOL (Students: 1,376, Location: 6401 E 75TH ST, Grades: PK-12)
- CATHEDRAL HIGH SCHOOL (Students: 1,313, Location: 5225 E 56TH ST, Grades: 9-12)
- RONCALLI HIGH SCHOOL (Students: 1,108, Location: 3300 PRAGUE RD, Grades: 9-12)
- PARK TUDOR SCHOOL (Students: 1,009, Location: 7200 N COLLEGE AVE, Grades: PK-12)
- BREBEUF JESUIT PREPARATORY SCHOOL (Students: 780, Location: 2801 W 86TH ST, Grades: 9-12)
- BISHOP CHATARD HIGH SCHOOL (Students: 725, Location: 5885 CRITTENDEN AVE, Grades: 9-12)
- CARDINAL RITTER HIGH SCHOOL (Students: 617, Location: 3360 W 30TH ST, Grades: 7-12)
- INTERNATIONAL SCHOOL OF INDIANA (Students: 585, Location: 4330 MICHIGAN RD, Grades: PK-12)
- SCECINA MEMORIAL HIGH SCHOOL (Students: 343, Location: 5000 NOWLAND AVE, Grades: 9-12)
- COVENANT CHRISTIAN HIGH SCHOOL (Students: 310, Location: 7525 W 21ST ST, Grades: 9-12)
Biggest public elementary/middle schools in Indianapolis:
- FALL CREEK VALLEY MIDDLE SCH (Students: 1,458, Location: 9701 E 63RD ST, Grades: 7-8)
- LILLIE IDELLA KITLEY ELEMENTARY (Students: 1,392, Location: 8735 INDIAN CREEK RD, Grades: PK-5)
- BELZER MIDDLE SCHOOL (Students: 1,333, Location: 7555 E 56TH ST, Grades: 7-8)
- FRANKLIN TOWNSHIP MIDDLE SCH WEST (Students: 1,306, Location: 7620 EDGEWOOD AVE, Grades: 6-8)
- LYNHURST 7TH & 8TH GRADE CENTER (Students: 1,252, Location: 2805 S LYNHURST, Grades: 7-8)
- PERRY MERIDIAN MIDDLE SCHOOL (Students: 1,185, Location: 202 W MERIDIAN SCHOOL RD, Grades: 7-8)
- CHAPEL HILL 7TH & 8TH GRADE CENTER (Students: 1,076, Location: 7320 W 10TH ST, Grades: 7-8)
- SOUTHPORT MIDDLE SCHOOL (Students: 1,070, Location: 5715 S KEYSTONE, Grades: 7-8)
- STONYBROOK MIDDLE SCHOOL (Students: 1,050, Location: 11300 STONYBROOK DR, Grades: 7-8)
- CRESTON MIDDLE SCHOOL (Students: 1,046, Location: 10925 E PROSPECT ST, Grades: 7-8)
Biggest private elementary/middle schools in Indianapolis:
- ST SIMON THE APOSTLE SCHOOL (Students: 758, Location: 8155 OAKLANDON RD, Grades: PK-8)
- THE ORCHARD SCHOOL (Students: 622, Location: 615 W 64TH ST, Grades: PK-8)
- ST LUKE ELEMENTARY SCHOOL (Students: 607, Location: 7650 N ILLINOIS ST, Grades: KG-8)
- ST BARNABAS SCHOOL (Students: 529, Location: 8300 RAHKE RD, Grades: KG-8)
- ST MONICA CATHOLIC SCHOOL (Students: 508, Location: 6131 MICHIGAN RD, Grades: PK-8)
- ST JUDE CATHOLIC (Students: 508, Location: 5375 MCFARLAND RD, Grades: KG-8)
- ST PIUS X CATHOLIC SCHOOL (Students: 444, Location: 7200 SARTO DR, Grades: KG-8)
- IMMACULATE HEART OF MARY SCHOOL (Students: 434, Location: 317 E 57TH ST, Grades: KG-8)
- CHRIST THE KING CATHOLIC SCHOOL (Students: 399, Location: 5858 CRITTENDEN AVE, Grades: KG-8)
- SYCAMORE SCHOOL (Students: 389, Location: 1750 W 64TH ST, Grades: PK-8)
Library in Indianapolis:
- INDIANAPOLIS-MARION COUNTY PUBLIC LIBRARY (Operating income: $29,718,612; Location: 2450 NORTH MERIDIAN STREET; 1,575,013 books; 12,325 e-books; 164,616 audio materials; 124,263 video materials; 18 local licensed databases; 37 state licensed databases; 10 other licensed databases; 3,231 print serial subscriptions)
User-submitted facts and corrections:
- The website for the University of Indianapolis is incorrect. It is www.uindy.edu
Thanks! Roberta Brooker
- Please change the URL for the University of Indianapolis to http://www.uindy.edu . It is currently listed as http://intranet.uindy.edu -- this is our internal website. The site for visitors is at http://www.uindy.edu .
Birthplace of: Allan Bloom - Philosopher, Ted Stevens - Senior Senator, Chris Lytle - Martial artist, Chick Evans - Amateur golfer, Norm Sloan - College basketball player, Marvin Johnson - Boxer, Mark Warner - Virginia politician, Maria Cantwell - Politician, John-Michael Liles - Ice hockey player, John Hiatt - Singer-songwriter.
Drinking water stations with addresses in Indianapolis and their reported violations in the past:
CITIZENS WATER - INDIANAPOLIS (Population served: 873,590, Surface water):Past monitoring violations:CITY OF LAWRENCE UTILITIES (Population served: 46,100, Groundwater):
- Monitoring, Turbidity (Enhanced SWTR) - In DEC-2006, Contaminant: IESWTR. Follow-up actions: St Public Notif requested (JAN-31-2007), St Violation/Reminder Notice (JAN-31-2007), St Public Notif received (APR-11-2007), St Compliance achieved (APR-11-2007)
- Monitoring, Turbidity (Enhanced SWTR) - In APR-2006, Contaminant: IESWTR. Follow-up actions: St Public Notif requested (MAY-31-2006), St Violation/Reminder Notice (MAY-31-2006), St Public Notif received (APR-11-2007), St Compliance achieved (APR-11-2007)
- Monitoring, Turbidity (Enhanced SWTR) - In MAR-2006, Contaminant: IESWTR. Follow-up actions: St Public Notif requested (APR-17-2006), St Violation/Reminder Notice (APR-17-2006), St Public Notif received (APR-11-2007), St Compliance achieved (APR-11-2007)
- Monitoring, Turbidity (Enhanced SWTR) - In FEB-2006, Contaminant: IESWTR. Follow-up actions: St Public Notif requested (APR-17-2006), St Violation/Reminder Notice (APR-17-2006), St Public Notif received (APR-11-2007), St Compliance achieved (APR-11-2007)
- One regular monitoring violation
Past monitoring violations:CITIZENS WATER - MORGAN (Population served: 4,571, Purch groundwater):
- 2 minor monitoring violations
Past monitoring violations:NEW CASTLE CORRECTIONAL FACILITY (Population served: 3,150, Purch groundwater):
- Monitoring and Reporting (DBP) - Between JUL-2012 and SEP-2012, Contaminant: Total Haloacetic Acids (HAA5). Follow-up actions: St Compliance achieved (OCT-24-2012), St Public Notif requested (JAN-08-2013), St Violation/Reminder Notice (JAN-08-2013), St Public Notif received (MAY-06-2013)
- Monitoring and Reporting (DBP) - Between JUL-2012 and SEP-2012, Contaminant: TTHM. Follow-up actions: St Compliance achieved (OCT-24-2012), St Public Notif requested (JAN-08-2013), St Violation/Reminder Notice (JAN-08-2013), St Public Notif received (MAY-06-2013)
- Failure Submit IDSE/Subpart V Plan Rpt - In JAN-02-2009, Contaminant: DBP STAGE 2. Follow-up actions: Fed FAO issued (APR-30-2009), Fed Compliance achieved (DEC-03-2009)
- Monitoring, Routine (IDSE) - Between OCT-2007 and SEP-2008, Contaminant: TTHM. Follow-up actions: Fed FAO issued (APR-30-2009), Fed Compliance achieved (DEC-03-2009)
- Monitoring, Routine (IDSE) - Between OCT-2007 and SEP-2008, Contaminant: Total Haloacetic Acids (HAA5). Follow-up actions: Fed FAO issued (APR-30-2009), Fed Compliance achieved (DEC-03-2009)
Past monitoring violations:SOUTHEASTWAY PARK - NATURE CENTER (Population served: 1,500, Groundwater):
- Monitoring and Reporting (DBP) - Between JAN-2009 and DEC-2009, Contaminant: Total Haloacetic Acids (HAA5). Follow-up actions: St Public Notif requested (NOV-09-2009), St Violation/Reminder Notice (NOV-09-2009), St Compliance achieved (AUG-02-2010)
- Monitoring and Reporting (DBP) - Between JAN-2009 and DEC-2009, Contaminant: TTHM. Follow-up actions: St Public Notif requested (NOV-09-2009), St Violation/Reminder Notice (NOV-09-2009), St Compliance achieved (AUG-02-2010)
- 4 routine major monitoring violations
- One minor monitoring violation
Past health violations:CHAIN O LAKES CORRECTIONAL FACILITY (Population served: 186, Groundwater):Past monitoring violations:
- MCL, Monthly (TCR) - In OCT-2013, Contaminant: Coliform. Follow-up actions: St Public Notif requested (OCT-10-2013), St Boil Water Order (OCT-10-2013), St Compliance achieved (OCT-10-2013), St Violation/Reminder Notice (OCT-10-2013)
- MCL, Monthly (TCR) - In JUL-2009, Contaminant: Coliform. Follow-up actions: St Public Notif requested (JUL-31-2009), St Violation/Reminder Notice (JUL-31-2009), St Boil Water Order (JUL-31-2009), St Compliance achieved (APR-09-2010)
- 3 routine major monitoring violations
- One minor monitoring violation
Past monitoring violations:PLEASANT VIEW CHURCH (Population served: 172, Groundwater):
- Lead Consumer Notice - In JAN-01-2013, Contaminant: Lead and Copper Rule. Follow-up actions: St Violation/Reminder Notice (APR-12-2013), St Intentional no-action (JAN-08-2014)
- Follow-up Or Routine LCR Tap M/R - In OCT-01-2009, Contaminant: Lead and Copper Rule. Follow-up actions: St Public Notif requested (NOV-09-2009), St Violation/Reminder Notice (NOV-09-2009), St Compliance achieved (NOV-23-2009)
- Initial, Follow-up, or Routine Source Water M/R - In JAN-01-1995, Contaminant: Lead and Copper Rule. Follow-up actions: St Compliance achieved (JAN-27-2006)
- 2 routine major monitoring violations
- 50 regular monitoring violations
Past health violations:PINE CREEK UMC - CAMPSITE F (POOL) (Population served: 98, Groundwater):Past monitoring violations:
- MCL, Monthly (TCR) - In MAY-2012, Contaminant: Coliform. Follow-up actions: St Boil Water Order (MAY-22-2012), St Public Notif requested (MAY-22-2012), St Violation/Reminder Notice (MAY-22-2012), St Public Notif received (JUN-22-2012), St Compliance achieved (NOV-16-2012)
- MCL, Monthly (TCR) - In MAY-2009, Contaminant: Coliform. Follow-up actions: St Boil Water Order (JUN-02-2009), St Violation/Reminder Notice (JUN-02-2009), St Public Notif requested (JUN-02-2009), St Public Notif received (JUN-15-2009), St Compliance achieved (MAY-11-2010)
- MCL, Monthly (TCR) - In FEB-2009, Contaminant: Coliform. Follow-up actions: St Public Notif requested (FEB-24-2009), St Violation/Reminder Notice (FEB-24-2009), St Boil Water Order (FEB-24-2009), St Compliance achieved (MAY-11-2010)
- Monitoring, Source Water (GWR) - In MAY-31-2012, Contaminant: E. COLI. Follow-up actions: St Public Notif requested (JUN-05-2012), St Violation/Reminder Notice (JUN-05-2012), St Compliance achieved (JUL-27-2012)
- One routine major monitoring violation
Past health violations:Past monitoring violations:
- MCL, Monthly (TCR) - In JUL-2008, Contaminant: Coliform. Follow-up actions: St Boil Water Order (AUG-14-2008), St Violation/Reminder Notice (AUG-14-2008), St Public Notif requested (AUG-14-2008), St Public Notif received (AUG-19-2008), St Compliance achieved (SEP-17-2008)
- 6 routine major monitoring violations
- 2 regular monitoring violations
Drinking water stations with addresses in Indianapolis that have no violations reported:
- DARLINGTON WATER (Population served: 867, Primary Water Source Type: Groundwater)
| This city: | 2.4 people |
| Indiana: | 2.5 people |
| This city: | 59.3% |
| Whole state: | 66.9% |
| This city: | 8.7% |
| Whole state: | 6.9% |
Likely homosexual households (counted as self-reported same-sex unmarried-partner households)
- Lesbian couples: 0.5% of all households
- Gay men: 0.5% of all households
People in group quarters in Indianapolis in 2010:
- 5,245 people in college/university student housing
- 4,382 people in nursing facilities/skilled-nursing facilities
- 2,254 people in local jails and other municipal confinement facilities
- 755 people in emergency and transitional shelters (with sleeping facilities) for people experiencing homelessness
- 584 people in correctional facilities intended for juveniles
- 465 people in group homes intended for adults
- 399 people in correctional residential facilities
- 399 people in other noninstitutional facilities
- 391 people in state prisons
- 290 people in residential treatment centers for juveniles (non-correctional)
- 259 people in residential treatment centers for adults
- 172 people in federal detention centers
- 160 people in workers' group living quarters and job corps centers
- 148 people in mental (psychiatric) hospitals and psychiatric units in other hospitals
- 71 people in residential schools for people with disabilities
- 56 people in group homes for juveniles (non-correctional)
- 3 people in hospitals with patients who have no usual home elsewhere
People in group quarters in Indianapolis in 2000:
- 5,425 people in nursing homes
- 3,634 people in college dormitories (includes college quarters off campus)
- 3,377 people in local jails and other confinement facilities (including police lockups)
- 1,669 people in other noninstitutional group quarters
- 521 people in state prisons
- 433 people in homes for the mentally retarded
- 388 people in hospitals/wards and hospices for chronically ill
- 345 people in other types of correctional institutions
- 281 people in other hospitals or wards for chronically ill
- 277 people in other nonhousehold living situations
- 241 people in homes for abused, dependent, and neglected children
- 235 people in training schools for juvenile delinquents
- 234 people in mental (psychiatric) hospitals or wards
- 234 people in homes or halfway houses for drug/alcohol abuse
- 180 people in schools, hospitals, or wards for the intellectually disabled
- 169 people in short-term care, detention or diagnostic centers for delinquent children
- 143 people in homes for the mentally ill
- 118 people in halfway houses
- 107 people in hospices or homes for chronically ill
- 89 people in institutions for the blind
- 74 people in other group homes
- 57 people in religious group quarters
- 34 people in hospitals or wards for drug/alcohol abuse
- 19 people in unknown juvenile institutions
- 12 people in agriculture workers' dormitories on farms
Banks with most branches in Indianapolis (2011 data):
- JPMorgan Chase Bank, National Association: 53 branches. Info updated 2011/11/10: Bank assets: $1,811,678.0 mil, Deposits: $1,190,738.0 mil, headquarters in Columbus, OH, positive income, International Specialization, 5577 total offices, Holding Company: Jpmorgan Chase & Co.
- PNC Bank, National Association: 35 branches. Info updated 2012/03/20: Bank assets: $263,309.6 mil, Deposits: $197,343.0 mil, headquarters in Wilmington, DE, positive income, Commercial Lending Specialization, 3085 total offices, Holding Company: Pnc Financial Services Group, Inc., The
- Fifth Third Bank: 27 branches. Info updated 2009/10/05: Bank assets: $114,540.4 mil, Deposits: $89,689.1 mil, headquarters in Cincinnati, OH, positive income, Commercial Lending Specialization, 1378 total offices, Holding Company: Fifth Third Bancorp
- The Huntington National Bank: 27 branches. Info updated 2012/04/02: Bank assets: $54,183.4 mil, Deposits: $44,300.3 mil, headquarters in Columbus, OH, positive income, Commercial Lending Specialization, 878 total offices, Holding Company: Huntington Bancshares Incorporated
- Old National Bank: 26 branches. Info updated 2011/08/01: Bank assets: $8,467.9 mil, Deposits: $6,653.1 mil, headquarters in Evansville, IN, positive income, 195 total offices, Holding Company: Old National Bancorp
- Regions Bank: 21 branches. Info updated 2011/02/24: Bank assets: $123,368.2 mil, Deposits: $98,301.3 mil, headquarters in Birmingham, AL, positive income, Commercial Lending Specialization, 1778 total offices, Holding Company: Regions Financial Corporation
- BMO Harris Bank National Association: 16 branches. Info updated 2011/07/14: Bank assets: $97,264.0 mil, Deposits: $75,624.6 mil, headquarters in Chicago, IL, positive income, 717 total offices, Holding Company: Bank Of Montreal
- KeyBank National Association: 14 branches. Info updated 2008/03/03: Bank assets: $86,198.8 mil, Deposits: $64,214.8 mil, headquarters in Cleveland, OH, positive income, Commercial Lending Specialization, 1067 total offices, Holding Company: Keycorp
- Flagstar Bank, FSB: 12 branches. Info updated 2011/07/21: Bank assets: $13,623.5 mil, Deposits: $7,802.8 mil, headquarters in Troy, MI, negative income in the last year, Mortgage Lending Specialization, 135 total offices
- 18 other banks with 28 local branches
For population 15 years and over in Indianapolis:
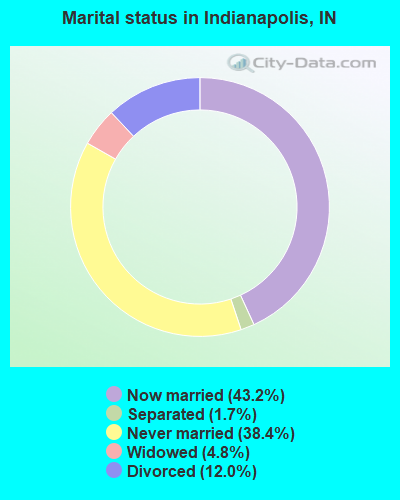
- Never married: 38.4%
- Now married: 43.2%
- Separated: 1.7%
- Widowed: 4.8%
- Divorced: 12.0%
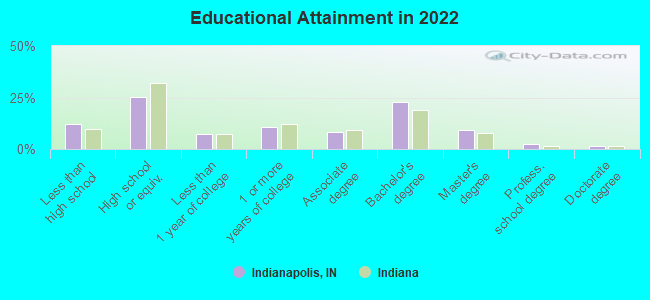
For population 25 years and over in Indianapolis:
- High school or higher: 87.7%
- Bachelor's degree or higher: 35.9%
- Graduate or professional degree: 13.2%
- Unemployed: 3.9%
- Mean travel time to work (commute): 21.1 minutes
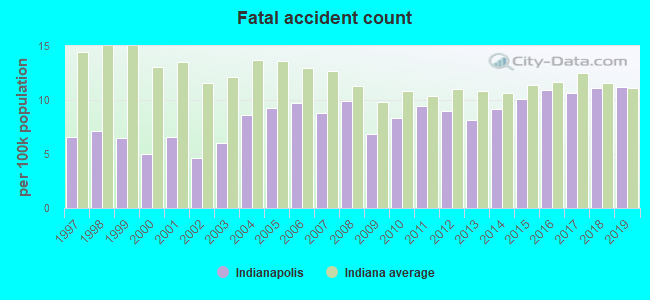
| Here: | 12.8 |
| Indiana average: | 11.3 |


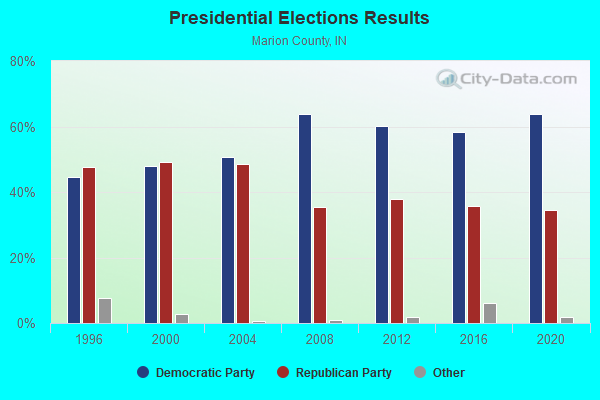
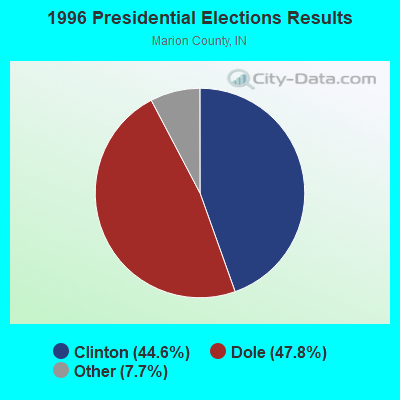
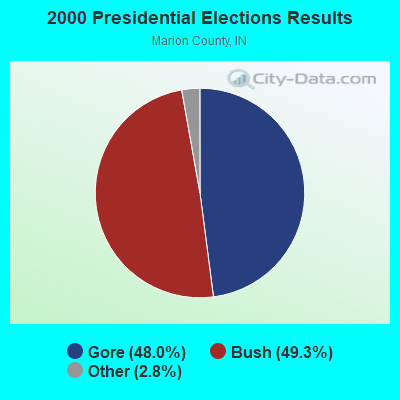
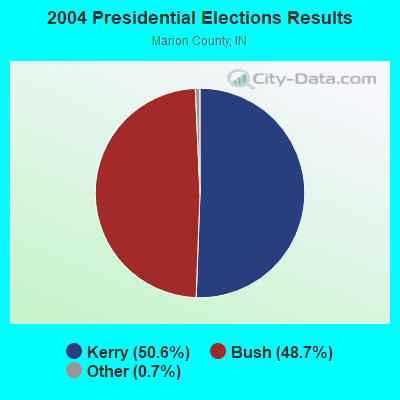
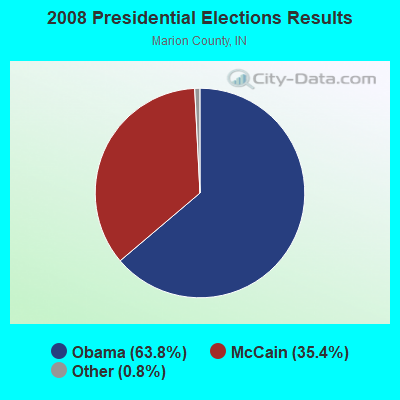
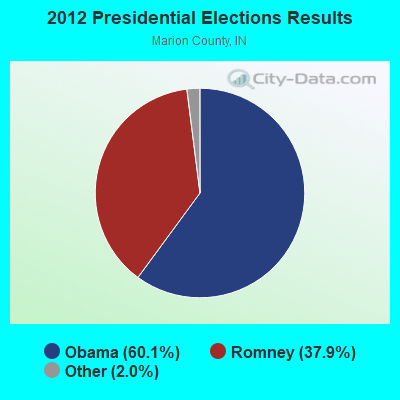
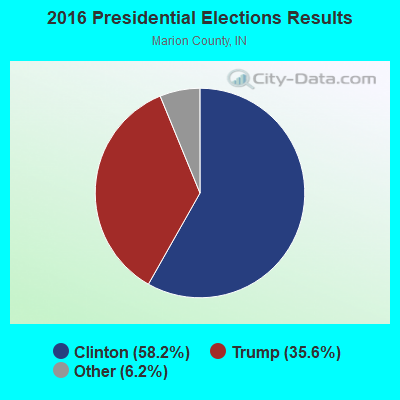
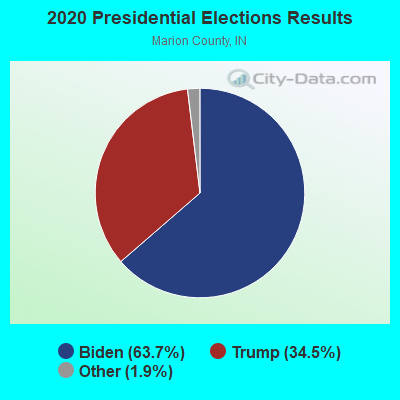
Graphs represent county-level data. Detailed 2008 Election Results
Neighborhoods in Indianapolis:
(Indianapolis, Indiana Neighborhood Map)- Bos neighborhood
- Bridgewater neighborhood
- Canal Walk neighborhood
- Carefree Estates neighborhood
- Chatham Arch neighborhood
- Concord neighborhood
- Cornerstone Place neighborhood
- Fall Creek Harbour neighborhood
- Far Eastside neighborhood
- Fletcher Place neighborhood
- Fountain Square neighborhood
- Foxwood neighborhood
- Geist Woods neighborhood
- Green Pastures neighborhood
- Hampton Cove neighborhood
- Herron Morton neighborhood
- Indy East neighborhood
- Irvington neighborhood
- Kingpark neighborhood
- Lexington Farms neighborhood
- Little Farms neighborhood
- Lockefield Gardens neighborhood
- Lockerble Square neighborhood
- Mapelton (Fall Creek) neighborhood
- Marina Village neighborhood
- Martindale (Brightwood) neighborhood
- Mass Ave Arts District neighborhood
- Meridian Meadows neighborhood
- Near North neighborhood
- Old Northside neighborhood
- Orchard Estates neighborhood
- Pogue's Run neighborhood
- Ransom Place neighborhood
- Reserve at Spring Mill neighborhood
- Riley neighborhood
- Sail Place neighborhood
- Southeast neighborhood
- St Joseph neighborhood
- Timber Heights neighborhood
- United Northeast neighborhood
- United Northwest neighborhood
- Upper Canal neighborhood
- Walden Pond neighborhood
- West Indianapolis neighborhood
- Westside neighborhood
- Wholesale District neighborhood
- Windjammer Bay neighborhood
- Woodruff Place neighborhood
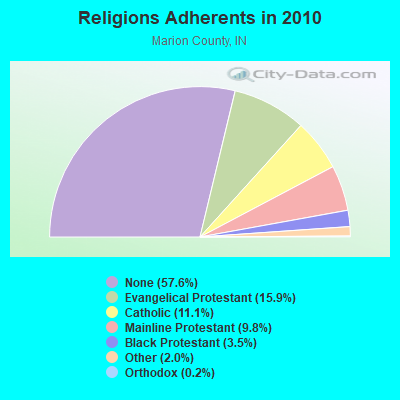
Religion statistics for Indianapolis, IN (based on Marion County data)
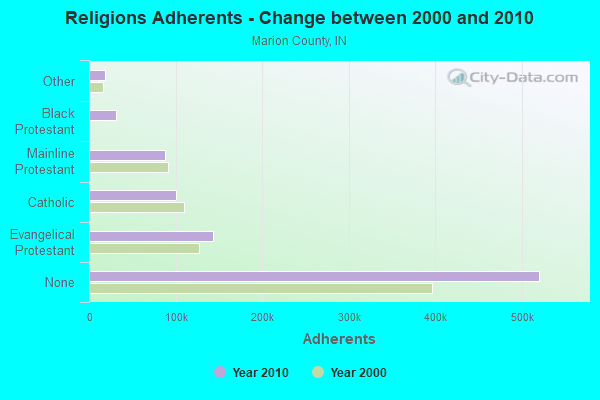
| Religion | Adherents | Congregations |
|---|---|---|
| Evangelical Protestant | 143,339 | 488 |
| Catholic | 99,990 | 40 |
| Mainline Protestant | 88,116 | 182 |
| Black Protestant | 31,445 | 93 |
| Other | 18,087 | 62 |
| Orthodox | 2,199 | 11 |
| None | 520,217 | - |
Food Environment Statistics:
| Marion County: | 1.71 / 10,000 pop. |
| Indiana: | 1.73 / 10,000 pop. |
| This county: | 0.23 / 10,000 pop. |
| Indiana: | 0.21 / 10,000 pop. |
| Here: | 0.35 / 10,000 pop. |
| Indiana: | 0.50 / 10,000 pop. |
| Marion County: | 3.01 / 10,000 pop. |
| Indiana: | 3.57 / 10,000 pop. |
| Marion County: | 7.24 / 10,000 pop. |
| Indiana: | 6.78 / 10,000 pop. |
| This county: | 9.0% |
| Indiana: | 9.2% |
| This county: | 28.5% |
| Indiana: | 29.0% |
| This county: | 15.0% |
| State: | 14.3% |
Health and Nutrition:
| Indianapolis: | 48.2% |
| Indiana: | 49.3% |
| Indianapolis: | 44.8% |
| Indiana: | 46.2% |
| Indianapolis: | 28.9 |
| Indiana: | 28.7 |
| Indianapolis: | 20.6% |
| Indiana: | 21.3% |
| This city: | 11.5% |
| Indiana: | 10.6% |
| Here: | 6.7 |
| Indiana: | 6.8 |
| Indianapolis: | 33.2% |
| Indiana: | 33.9% |
| Indianapolis: | 55.3% |
| Indiana: | 56.1% |
| Indianapolis: | 80.1% |
| Indiana: | 78.7% |
More about Health and Nutrition of Indianapolis, IN Residents
| Local government employment and payroll (March 2022) | |||||
| Function | Full-time employees | Monthly full-time payroll | Average yearly full-time wage | Part-time employees | Monthly part-time payroll |
|---|---|---|---|---|---|
| Hospitals | 3,504 | $23,025,104 | $78,853 | 972 | $4,985,285 |
| Police Protection - Officers | 1,398 | $10,670,290 | $91,590 | 17 | $53,323 |
| Firefighters | 1,135 | $9,467,139 | $100,093 | 0 | $0 |
| Gas Supply | 1,092 | $7,854,113 | $86,309 | 118 | $263,639 |
| Judicial and Legal | 878 | $4,685,220 | $64,035 | 27 | $119,897 |
| Health | 855 | $4,590,332 | $64,426 | 65 | $224,070 |
| Transit | 758 | $3,930,959 | $62,232 | 3 | $7,126 |
| Other and Unallocable | 672 | $3,579,530 | $63,920 | 11 | $8,143 |
| Police - Other | 651 | $3,740,595 | $68,951 | 25 | $78,885 |
| Streets and Highways | 412 | $2,274,239 | $66,240 | 3 | $9,491 |
| Parks and Recreation | 377 | $1,574,790 | $50,126 | 316 | $428,621 |
| Correction | 349 | $1,725,997 | $59,347 | 3 | $2,589 |
| Other Government Administration | 305 | $1,207,075 | $47,491 | 15 | $44,623 |
| Solid Waste Management | 208 | $657,203 | $37,916 | 0 | $0 |
| Financial Administration | 177 | $851,189 | $57,708 | 3 | $9,129 |
| Fire - Other | 118 | $792,018 | $80,544 | 2 | $1,452 |
| Sewerage | 70 | $201,122 | $34,478 | 2 | $4,056 |
| Housing and Community Development (Local) | 43 | $206,339 | $57,583 | 1 | $626 |
| Welfare | 36 | $167,427 | $55,809 | 0 | $0 |
| Natural Resources | 30 | $105,897 | $42,359 | 0 | $0 |
| Totals for Government | 13,068 | $81,306,579 | $74,662 | 1,583 | $6,240,953 |
Indianapolis government finances - Expenditure in 2021 (per resident):
- Construction - Sewerage: $214,642,000 ($243.74)
Water Utilities: $75,429,000 ($85.65)
Air Transportation: $62,091,000 ($70.51)
Health - Other: $61,724,000 ($70.09)
Regular Highways: $59,213,000 ($67.24)
Transit Utilities: $45,593,000 ($51.77)
Gas Utilities: $35,811,000 ($40.67)
Parks and Recreation: $11,686,000 ($13.27)
Local Fire Protection: $5,018,000 ($5.70)
Hospitals: $4,737,000 ($5.38)
General - Other: $3,275,000 ($3.72)
- Current Operations - Hospitals: $1,380,360,000 ($1567.48)
Police Protection: $223,803,000 ($254.14)
Gas Utilities: $197,787,000 ($224.60)
Health - Other: $150,244,000 ($170.61)
Housing and Community Development: $147,327,000 ($167.30)
Local Fire Protection: $144,435,000 ($164.01)
Sewerage: $130,229,000 ($147.88)
Correctional Institutions: $120,780,000 ($137.15)
Water Utilities: $115,202,000 ($130.82)
Judicial and Legal Services: $113,653,000 ($129.06)
Transit Utilities: $103,985,000 ($118.08)
General - Other: $102,495,000 ($116.39)
Air Transportation: $72,563,000 ($82.40)
Regular Highways: $52,380,000 ($59.48)
Parks and Recreation: $51,603,000 ($58.60)
Solid Waste Management: $48,386,000 ($54.95)
Financial Administration: $33,307,000 ($37.82)
Corrections - Other: $19,343,000 ($21.97)
Central Staff Services: $17,533,000 ($19.91)
Protective Inspection and Regulation - Other: $14,727,000 ($16.72)
Parking Facilities: $4,299,000 ($4.88)
- Gas Utilities - Interest on Debt: $12,898,000 ($14.65)
- General - Interest on Debt: $177,487,000 ($201.55)
- Other Capital Outlay - Hospitals: $51,450,000 ($58.42)
Parks and Recreation: $10,391,000 ($11.80)
Health - Other: $6,381,000 ($7.25)
Police Protection: $4,663,000 ($5.30)
Judicial and Legal Services: $230,000 ($0.26)
- Total Salaries and Wages: $12,742,000 ($14.47)
- Transit Utilities - Interest on Debt: $807,000 ($0.92)
- Water Utilities - Interest on Debt: $137,233,000 ($155.84)
Indianapolis government finances - Revenue in 2021 (per resident):
- Charges - Hospital Public: $1,334,198,000 ($1515.06)
Sewerage: $339,790,000 ($385.85)
Air Transportation: $124,989,000 ($141.93)
Parks and Recreation: $12,199,000 ($13.85)
Solid Waste Management: $11,536,000 ($13.10)
Housing and Community Development: $8,823,000 ($10.02)
Other: $4,346,000 ($4.94)
Regular Highways: $1,732,000 ($1.97)
Parking Facilities: $1,572,000 ($1.79)
- Federal Intergovernmental - Air Transportation: $60,599,000 ($68.81)
Transit Utilities: $57,907,000 ($65.76)
Other: $4,168,000 ($4.73)
- Local Intergovernmental - Transit Utilities: $11,373,000 ($12.91)
Other: $5,229,000 ($5.94)
- Miscellaneous - Interest Earnings: $106,058,000 ($120.44)
General Revenue - Other: $43,048,000 ($48.88)
Sale of Property: $28,937,000 ($32.86)
Fines and Forfeits: $13,378,000 ($15.19)
Rents: $4,347,000 ($4.94)
- Revenue - Gas Utilities: $286,192,000 ($324.99)
Water Utilities: $240,596,000 ($273.21)
Transit Utilities: $7,365,000 ($8.36)
- State Intergovernmental - Public Welfare: $325,805,000 ($369.97)
Housing and Community Development: $77,529,000 ($88.04)
Health and Hospitals: $71,767,000 ($81.50)
Transit Utilities: $67,160,000 ($76.26)
Other: $30,666,000 ($34.82)
- Tax - Individual Income: $560,926,000 ($636.97)
Property: $348,314,000 ($395.53)
Other: $47,346,000 ($53.76)
Other Selective Sales: $38,610,000 ($43.84)
Amusements Sales: $2,670,000 ($3.03)
Motor Vehicle License: $1,831,000 ($2.08)
Indianapolis government finances - Debt in 2021 (per resident):
- Long Term Debt - Outstanding Unspecified Public Purpose: $5,839,615,000 ($6631.25)
Beginning Outstanding - Unspecified Public Purpose: $5,605,841,000 ($6365.78)
Issue, Unspecified Public Purpose: $513,746,000 ($583.39)
Retired Unspecified Public Purpose: $444,691,000 ($504.97)
Beginning Outstanding - Public Debt for Private Purpose: $415,043,000 ($471.31)
Outstanding Nonguaranteed - Industrial Revenue: $362,519,000 ($411.66)
- Short Term Debt Outstanding - End of Fiscal Year: $3,995,000 ($4.54)
Beginning: $3,852,000 ($4.37)
Indianapolis government finances - Cash and Securities in 2021 (per resident):
- Bond Funds - Cash and Securities: $293,856,000 ($333.69)
- Other Funds - Cash and Securities: $2,607,337,000 ($2960.79)
- Sinking Funds - Cash and Securities: $1,047,918,000 ($1189.98)
6.61% of this county's 2021 resident taxpayers lived in other counties in 2020 ($58,034 average adjusted gross income)
| Here: | 6.61% |
| Indiana average: | 6.66% |
0.01% of residents moved from foreign countries ($73 average AGI)
Marion County: 0.01% Indiana average: 0.00%
Top counties from which taxpayers relocated into this county between 2020 and 2021:
| from Hamilton County, IN | |
| from Johnson County, IN | |
| from Hendricks County, IN |
7.81% of this county's 2020 resident taxpayers moved to other counties in 2021 ($64,750 average adjusted gross income)
| Here: | 7.81% |
| Indiana average: | 6.55% |
0.02% of residents moved to foreign countries ($88 average AGI)
Marion County: 0.02% Indiana average: 0.00%
Top counties to which taxpayers relocated from this county between 2020 and 2021:
| to Hamilton County, IN | |
| to Hendricks County, IN | |
| to Johnson County, IN |
| Businesses in Indianapolis, IN | ||||
| Name | Count | Name | Count | |
|---|---|---|---|---|
| 7-Eleven | 2 | Johnny Rockets | 2 | |
| ALDI | 8 | Jones New York | 8 | |
| ALDO | 2 | Journeys | 2 | |
| AT&T | 20 | Justice | 2 | |
| Abercrombie & Fitch | 2 | KFC | 19 | |
| Abercrombie Kids | 1 | Kincaid | 3 | |
| Ace Hardware | 7 | Kmart | 5 | |
| Advance Auto Parts | 14 | Knights Inn | 2 | |
| Aeropostale | 4 | Kohl's | 4 | |
| American Eagle Outfitters | 2 | Kroger | 25 | |
| Ann Taylor | 3 | LA Fitness | 5 | |
| Apple Store | 1 | La Quinta | 7 | |
| Applebee's | 7 | La-Z-Boy | 2 | |
| Arby's | 21 | Lane Bryant | 3 | |
| Audi | 1 | Lane Furniture | 6 | |
| AutoZone | 19 | LensCrafters | 4 | |
| Avenue | 1 | Little Caesars Pizza | 13 | |
| BMW | 1 | Long John Silver's | 14 | |
| Bakers | 2 | Lowe's | 7 | |
| Bally Total Fitness | 1 | Macy's | 2 | |
| Banana Republic | 2 | Marriott | 21 | |
| Barnes & Noble | 1 | Marshalls | 1 | |
| Baskin-Robbins | 2 | MasterBrand Cabinets | 40 | |
| Bath & Body Works | 4 | Mazda | 2 | |
| Baymont Inn | 1 | McDonald's | 48 | |
| Bebe | 1 | Meijer | 4 | |
| Bed Bath & Beyond | 2 | Men's Wearhouse | 2 | |
| Best Western | 5 | Menards | 3 | |
| Big O Tires | 1 | Microtel | 1 | |
| Blockbuster | 9 | Motel 6 | 2 | |
| Brooks Brothers | 2 | Motherhood Maternity | 5 | |
| Brookstone | 4 | New Balance | 11 | |
| Budget Car Rental | 4 | New York & Co | 2 | |
| Buffalo Wild Wings | 7 | Nike | 44 | |
| Burger King | 27 | Nissan | 4 | |
| Burlington Coat Factory | 4 | Nordstrom | 2 | |
| CVS | 43 | Office Depot | 3 | |
| Cache | 1 | OfficeMax | 3 | |
| CarMax | 1 | Old Country Buffet | 1 | |
| Caribou Coffee | 2 | Old Navy | 2 | |
| Carson Pirie Scott | 1 | Olive Garden | 2 | |
| Casual Male XL | 3 | On The Border | 1 | |
| Catherines | 5 | Outback | 5 | |
| Charlotte Russe | 2 | Outback Steakhouse | 5 | |
| Chevrolet | 6 | Pac Sun | 2 | |
| Chick-Fil-A | 6 | Panda Express | 5 | |
| Chico's | 1 | Panera Bread | 9 | |
| Chipotle | 3 | Papa John's Pizza | 14 | |
| Chuck E. Cheese's | 4 | Payless | 10 | |
| Church's Chicken | 14 | Penske | 6 | |
| Cinnabon | 2 | PetSmart | 3 | |
| Circle K | 17 | Pier 1 Imports | 3 | |
| Clarion | 2 | Pizza Hut | 21 | |
| Clarks | 1 | Plato's Closet | 2 | |
| Cold Stone Creamery | 5 | Pottery Barn | 1 | |
| Coldwater Creek | 1 | Pottery Barn Kids | 1 | |
| Comfort Inn | 6 | Qdoba Mexican Grill | 9 | |
| Comfort Suites | 4 | Quality | 6 | |
| Costco | 1 | Quiznos | 9 | |
| Cracker Barrel | 4 | RadioShack | 16 | |
| Crate & Barrel | 1 | Ramada | 4 | |
| Curves | 7 | Red Lobster | 3 | |
| DHL | 9 | Red Roof Inn | 2 | |
| Dairy Queen | 17 | Rodeway Inn | 1 | |
| Days Hotel | 1 | Ruby Tuesday | 4 | |
| Days Inn | 3 | Ryan's Grill | 2 | |
| Deb | 1 | Ryder Rental & Truck Leasing | 3 | |
| Decora Cabinetry | 3 | SAS Shoes | 5 | |
| Dennys | 9 | Saks Fifth Avenue | 1 | |
| Discount Tire | 6 | Sam's Club | 4 | |
| Domino's Pizza | 16 | Sears | 8 | |
| DressBarn | 3 | Sephora | 2 | |
| Dressbarn | 3 | Sheraton | 2 | |
| Dunkin Donuts | 8 | Shoe Carnival | 3 | |
| Econo Lodge | 1 | Sleep Inn | 1 | |
| Eddie Bauer | 2 | Soma Intimates | 1 | |
| Express | 2 | Spencer Gifts | 1 | |
| Extended Stay America | 4 | Sprint Nextel | 15 | |
| Extended Stay Deluxe | 2 | Staples | 5 | |
| Famous Footwear | 2 | Starbucks | 44 | |
| Fashion Bug | 3 | Steak 'n Shake | 20 | |
| FedEx | 177 | Subaru | 2 | |
| Finish Line | 5 | Suburban | 1 | |
| Firestone Complete Auto Care | 9 | Subway | 61 | |
| Foot Locker | 4 | Super 8 | 5 | |
| Ford | 3 | T-Mobile | 29 | |
| Forever 21 | 3 | T.G.I. Driday's | 4 | |
| GNC | 12 | T.J.Maxx | 2 | |
| GameStop | 17 | Taco Bell | 31 | |
| Gap | 3 | Talbots | 2 | |
| Goodwill | 4 | Target | 6 | |
| Gymboree | 1 | The Cheesecake Factory | 1 | |
| H&M | 1 | The Limited | 2 | |
| H&R Block | 37 | The Room Place | 2 | |
| Haagen-Dazs | 1 | Toyota | 4 | |
| Hardee's | 18 | Toys"R"Us | 6 | |
| Havertys Furniture | 1 | Trader Joe's | 2 | |
| Haworth | 1 | True Value | 1 | |
| Hilton | 12 | U-Haul | 20 | |
| Hobby Lobby | 2 | UPS | 240 | |
| Holiday Inn | 17 | Urban Outfitters | 1 | |
| Hollister Co. | 2 | Value City Furniture | 2 | |
| Home Depot | 4 | Vans | 6 | |
| Homestead Studio Suites | 1 | Verizon Wireless | 12 | |
| Honda | 3 | Victoria's Secret | 4 | |
| Hot Topic | 2 | Volkswagen | 2 | |
| Houlihan's | 1 | Waffle House | 4 | |
| Hyatt | 2 | Walgreens | 30 | |
| Hyundai | 3 | Walmart | 9 | |
| IHOP | 2 | Wendy's | 26 | |
| InTown Suites | 3 | Westin | 1 | |
| J. Jill | 1 | Wet Seal | 2 | |
| J.Crew | 1 | White Castle | 18 | |
| JCPenney | 2 | Whole Foods Market | 1 | |
| Jimmy Jazz | 1 | Wingate | 3 | |
| Jimmy John's | 10 | YMCA | 9 | |
| JoS. A. Bank | 2 | |||
Strongest AM radio stations in Indianapolis:
- WXNT (1430 AM; 5 kW; INDIANAPOLIS, IN; Owner: MYSTAR COMMUNICATIONS CORPORATION)
- WIBC (1070 AM; 50 kW; INDIANAPOLIS, IN; Owner: EMMIS RADIO LICENSE CORPORATION)
- WNTS (1590 AM; 5 kW; BEECH GROVE, IN; Owner: S + M BROADCASTING CO., INC.)
- WTLC (1310 AM; 5 kW; INDIANAPOLIS, IN; Owner: RADIO ONE OF INDIANA, LLC)
- WXLW (950 AM; 5 kW; INDIANAPOLIS, IN)
- WNDE (1260 AM; 5 kW; INDIANAPOLIS, IN; Owner: CAPSTAR TX LIMITED PARTNERSHIP)
- WBRI (1500 AM; daytime; 5 kW; INDIANAPOLIS, IN)
- WSYW (810 AM; daytime; 0 kW; INDIANAPOLIS, IN; Owner: CONTINENTAL BROADCAST GROUP, LLC)
- WLW (700 AM; 50 kW; CINCINNATI, OH; Owner: JACOR BROADCASTING CORPORATION)
- WOWO (1190 AM; 50 kW; FORT WAYNE, IN; Owner: PATHFINDER COMMUNICATIONS CORPORATION)
- WHAS (840 AM; 50 kW; LOUISVILLE, KY; Owner: CLEAR CHANNEL BROADCASTING LICENSES, INC.)
- WSAI (1530 AM; 50 kW; CINCINNATI, OH; Owner: JACOR BROADCASTING CORPORATION)
- WTVN (610 AM; 50 kW; COLUMBUS, OH; Owner: CITICASTERS LICENSES, L.P.)
Strongest FM radio stations in Indianapolis:
- WHHH (96.3 FM; INDIANAPOLIS, IN; Owner: RADIO ONE OF INDIANA, LLC)
- WGLD (104.5 FM; INDIANAPOLIS, IN; Owner: INDY LICO, INC)
- WNOU (93.1 FM; INDIANAPOLIS, IN; Owner: EMMIS RADIO LICENSE CORPORATION)
- WZPL (99.5 FM; GREENFIELD, IN; Owner: MYSTAR COMMUNICATIONS CORPORATION)
- WFMS (95.5 FM; INDIANAPOLIS, IN; Owner: WFMS LICO, INC)
- WYXB (105.7 FM; INDIANAPOLIS, IN; Owner: EMMIS RADIO LICENSE CORPORATION)
- WFBQ (94.7 FM; INDIANAPOLIS, IN; Owner: CAPSTAR TX LIMITED PARTNERSHIP)
- WRZX (103.3 FM; INDIANAPOLIS, IN; Owner: CAPSTAR TX LIMITED PARTNERSHIP)
- WTPI (107.9 FM; INDIANAPOLIS, IN; Owner: MYSTAR COMMUNICATIONS CORPORATION)
- WENS (97.1 FM; SHELBYVILLE, IN; Owner: EMMIS RADIO LICENSE CORPORATION)
- WFYI-FM (90.1 FM; INDIANAPOLIS, IN; Owner: METROPOLITAN IN. PUBLIC B/CING, INC.)
- WTLC-FM (106.7 FM; GREENWOOD, IN; Owner: RADIO ONE OF INDIANA, LLC)
- WTTS (92.3 FM; BLOOMINGTON, IN; Owner: SARKES TARZIAN, INC.)
- WEDM (91.1 FM; INDIANAPOLIS, IN; Owner: METROPOLITAN SCH. DIST. OF WARREN)
- WYJZ (100.9 FM; LEBANON, IN; Owner: RADIO ONE OF INDIANA, LLC)
- WGRL (93.9 FM; NOBLESVILLE, IN; Owner: INDY LICO, INC.)
- WRDZ-FM (98.3 FM; PLAINFIELD, IN; Owner: ABC, INC.)
- WEDJ (107.1 FM; DANVILLE, IN; Owner: CONTINENTAL BROADCAST GROUP, LLC)
- WIJY (95.9 FM; FRANKLIN, IN; Owner: PILGRIM COMMUNICATIONS, LLC)
- WKLU (101.9 FM; BROWNSBURG, IN; Owner: QUINN BROADCASTING, INC.)
TV broadcast stations around Indianapolis:
- WKOG-LP (Channel 31; INDIANAPOLIS, IN; Owner: KINGDOM OF GOD MINISTRIES, INC.)
- WDNI-LP (Channel 65; INDIANAPOLIS, IN; Owner: RADIO ONE OF INDIANA, LLC)
- WIPX-LP (Channel 51; INDIANAPOLIS, IN; Owner: PAXSON COMMUNICATIONS LICENSE COMPANY, LLC)
- WTBU-TV (Channel 69; INDIANAPOLIS, IN; Owner: BUTLER UNIVERSITY)
- WXIN (Channel 59; INDIANAPOLIS, IN; Owner: TRIBUNE TELEVISION COMPANY)
- WISH-TV (Channel 8; INDIANAPOLIS, IN; Owner: INDIANA BROADCASTING, LLC)
- WHMB-TV (Channel 40; INDIANAPOLIS, IN; Owner: LESEA BROADCASTING CORPORATION)
- WRTV (Channel 6; INDIANAPOLIS, IN; Owner: MCGRAW-HILL BROADCASTING COMPANY, INC.)
- WBXI-CA (Channel 47; INDIANAPOLIS, IN; Owner: THE BOX WORLDWIDE LLC)
- WFYI (Channel 20; INDIANAPOLIS, IN; Owner: METROPOLITAN INDIANAPOLIS PUBLIC BROADCASTING, INC.)
- WIIH-CA (Channel 11; INDIANAPOLIS, IN; Owner: INDIANA BROADCASTING, LLC)
- WTHR (Channel 13; INDIANAPOLIS, IN; Owner: VIDEOINDIANA, INC.)
- WALV-CA (Channel 50; INDIANAPOLIS, IN; Owner: VIDEOHIO, INC..)
- WTTV (Channel 4; BLOOMINGTON, IN; Owner: TRIBUNE BROADCAST HOLDINGS, INC.)
- WIPX (Channel 63; BLOOMINGTON, IN; Owner: PAXSON INDIANAPOLIS LICENSE, INC.)
- WCLJ (Channel 42; BLOOMINGTON, IN; Owner: TRINITY BROADCASTING OF INDIANA, INC.)
- WNDY-TV (Channel 23; MARION, IN; Owner: UPN STATIONS GROUP INC.)
- WTIU (Channel 30; BLOOMINGTON, IN; Owner: THE TRUSTEES OF INDIANA UNIVERSITY)
- WTTK (Channel 29; KOKOMO, IN; Owner: TRIBUNE BROADCAST HOLDINGS, INC.)
Medal of Honor Recipients
Medal of Honor Recipients born in Indianapolis: David W. Harris, Norman Scott, Thomas W. Wigle, William D. McGee.
- National Bridge Inventory (NBI) Statistics
- 1,482Number of bridges
- 15,935ft / 4,857mTotal length
- $97,296,000Total costs
- 46,244,197Total average daily traffic
- 6,291,781Total average daily truck traffic
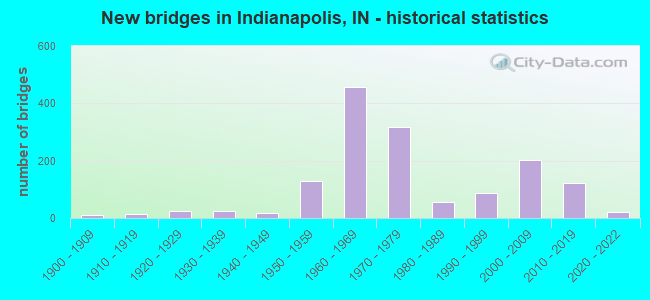
- New bridges - historical statistics
- 1Before 1900
- 101900-1909
- 131910-1919
- 241920-1929
- 251930-1939
- 161940-1949
- 1301950-1959
- 4561960-1969
- 3181970-1979
- 561980-1989
- 871990-1999
- 2022000-2009
- 1222010-2019
- 222020-2022
FCC Registered Antenna Towers: 2,367 (See the full list of FCC Registered Antenna Towers)
FCC Registered Commercial Land Mobile Towers: 65 (See the full list of FCC Registered Commercial Land Mobile Towers in Indianapolis, IN)
FCC Registered Private Land Mobile Towers: 41 (See the full list of FCC Registered Private Land Mobile Towers)
FCC Registered Broadcast Land Mobile Towers: 552 (See the full list of FCC Registered Broadcast Land Mobile Towers)
FCC Registered Microwave Towers: 555 (See the full list of FCC Registered Microwave Towers in this town)
FCC Registered Paging Towers: 71 (See the full list of FCC Registered Paging Towers)
FCC Registered Maritime Coast & Aviation Ground Towers: 87 (See the full list of FCC Registered Maritime Coast & Aviation Ground Towers)
FCC Registered Amateur Radio Licenses: 3,044 (See the full list of FCC Registered Amateur Radio Licenses in Indianapolis)
FAA Registered Aircraft Manufacturers and Dealers: 18 (See the full list of FAA Registered Manufacturers and Dealers in Indianapolis)
FAA Registered Aircraft: 739 (See the full list of FAA Registered Aircraft)
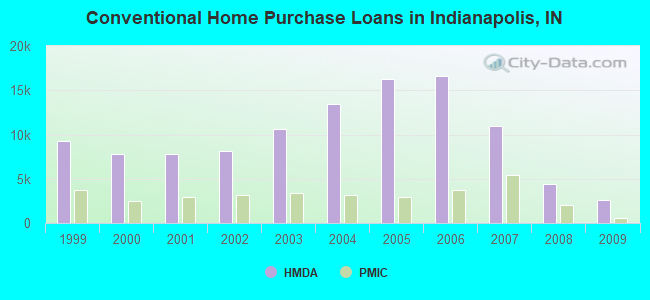
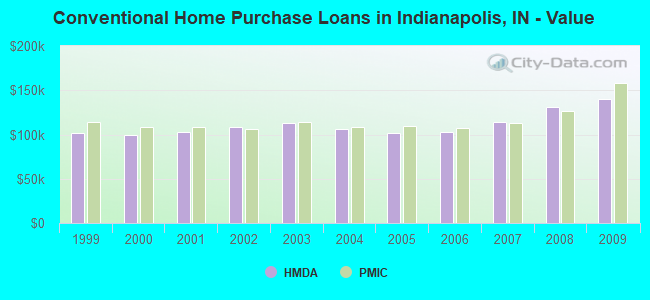
| Home Mortgage Disclosure Act Aggregated Statistics For Year 2009 (Based on 199 full and 7 partial tracts) | ||||||||||||||
| A) FHA, FSA/RHS & VA Home Purchase Loans | B) Conventional Home Purchase Loans | C) Refinancings | D) Home Improvement Loans | E) Loans on Dwellings For 5+ Families | F) Non-occupant Loans on < 5 Family Dwellings (A B C & D) | G) Loans On Manufactured Home Dwelling (A B C & D) | ||||||||
|---|---|---|---|---|---|---|---|---|---|---|---|---|---|---|
| Number | Average Value | Number | Average Value | Number | Average Value | Number | Average Value | Number | Average Value | Number | Average Value | Number | Average Value | |
| LOANS ORIGINATED | 4,968 | $112,791 | 2,625 | $139,638 | 13,847 | $143,922 | 387 | $52,044 | 52 | $4,350,315 | 890 | $81,142 | 32 | $44,701 |
| APPLICATIONS APPROVED, NOT ACCEPTED | 221 | $115,266 | 209 | $132,608 | 1,357 | $135,650 | 114 | $28,770 | 5 | $2,070,200 | 80 | $89,673 | 33 | $27,086 |
| APPLICATIONS DENIED | 829 | $101,157 | 565 | $112,238 | 6,287 | $128,300 | 767 | $31,277 | 4 | $3,108,000 | 517 | $74,321 | 34 | $31,493 |
| APPLICATIONS WITHDRAWN | 592 | $110,014 | 309 | $123,755 | 3,790 | $132,178 | 100 | $61,024 | 5 | $7,368,000 | 228 | $75,810 | 5 | $90,200 |
| FILES CLOSED FOR INCOMPLETENESS | 124 | $103,589 | 61 | $125,974 | 929 | $133,166 | 44 | $74,381 | 0 | $0 | 60 | $85,771 | 1 | $130,000 |
Detailed mortgage data for all 207 tracts in Indianapolis, IN
| Private Mortgage Insurance Companies Aggregated Statistics For Year 2009 (Based on 169 full and 6 partial tracts) | ||||||
| A) Conventional Home Purchase Loans | B) Refinancings | C) Non-occupant Loans on < 5 Family Dwellings (A & B) | ||||
|---|---|---|---|---|---|---|
| Number | Average Value | Number | Average Value | Number | Average Value | |
| LOANS ORIGINATED | 611 | $157,651 | 662 | $153,438 | 1 | $257,000 |
| APPLICATIONS APPROVED, NOT ACCEPTED | 154 | $164,609 | 307 | $150,841 | 23 | $70,324 |
| APPLICATIONS DENIED | 91 | $160,041 | 136 | $157,064 | 3 | $149,310 |
| APPLICATIONS WITHDRAWN | 27 | $157,660 | 46 | $177,483 | 0 | $0 |
| FILES CLOSED FOR INCOMPLETENESS | 25 | $128,120 | 17 | $145,598 | 7 | $72,857 |
2002 - 2018 National Fire Incident Reporting System (NFIRS) incidents
- Fire incident types reported to NFIRS in Indianapolis, IN
- 3,98353.5%Structure Fires
- 2,02127.2%Outside Fires
- 93612.6%Mobile Property/Vehicle Fires
- 4996.7%Other
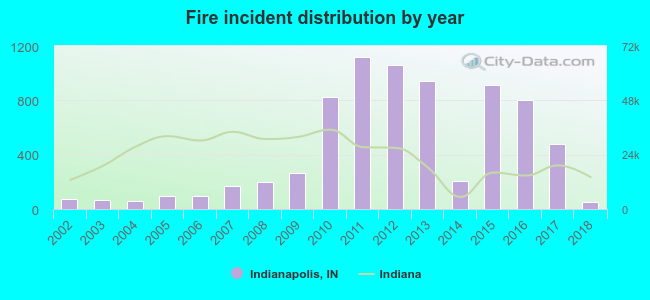 Based on the data from the years 2002 - 2018 the average number of fires per year is 438. The highest number of reported fire incidents - 1,122 took place in 2011, and the least - 52 in 2018. The data has a decreasing trend.
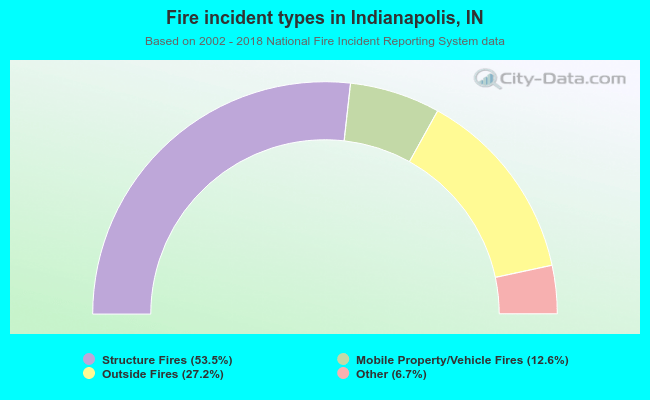 When looking into fire subcategories, the most incidents belonged to: Structure Fires (53.5%), and Outside Fires (27.2%).
Fire-safe hotels and motels in Indianapolis, Indiana:
- Always Inn, 7410 E 21ST St, Indianapolis, Indiana 46219 , Phone: (317) 356-1036
- Ashley Motel, 11110 W Washington St, Indianapolis, Indiana 46231 , Phone: (812) 839-6584
- Clarion Hotel & Conference Center, 2930 Waterfront Pkwy, Indianapolis, Indiana 46214 , Phone: (317) 299-8400, Fax: (317) 299-9257
- La Quinta Inn-Indianapolis Airport Executive Drive, 2650 Executive Dr, Indianapolis, Indiana 46241 , Phone: (317) 244-8100, Fax: (317) 241-5136
- Comfort Inn South, 5040 S East St, Indianapolis, Indiana 46227 , Phone: (317) 783-6711, Fax: (317) 536-0001
- Days Inn, 401 E Washington, Indianapolis, Indiana 46204 , Phone: (317) 637-6464, Fax: (317) 637-0242
- Days Inn Plainfield, 6111 Cambridge Way, Indianapolis, Indiana 46231 , Phone: (317) 839-5000
- Comfort Inn & Suites, 9090 Wesleyan Rd, Indianapolis, Indiana 46268 , Phone: (317) 875-7676, Fax: (317) 875-9051
- 148 other hotels and motels
| Most common first names in Indianapolis, IN among deceased individuals | ||
| Name | Count | Lived (average) |
|---|---|---|
| Mary | 6,897 | 78.2 years |
| William | 5,852 | 73.1 years |
| John | 5,369 | 72.9 years |
| James | 5,146 | 70.1 years |
| Robert | 4,945 | 70.3 years |
| Charles | 3,943 | 72.7 years |
| George | 2,850 | 74.4 years |
| Helen | 2,569 | 79.1 years |
| Dorothy | 2,267 | 76.5 years |
| Margaret | 2,148 | 79.0 years |
| Most common last names in Indianapolis, IN among deceased individuals | ||
| Last name | Count | Lived (average) |
|---|---|---|
| Smith | 2,945 | 73.5 years |
| Johnson | 2,015 | 72.6 years |
| Jones | 1,727 | 72.5 years |
| Williams | 1,674 | 72.8 years |
| Brown | 1,538 | 73.9 years |
| Miller | 1,387 | 75.1 years |
| Davis | 1,197 | 73.5 years |
| Wilson | 1,103 | 73.7 years |
| Taylor | 1,004 | 74.1 years |
| Moore | 941 | 74.3 years |
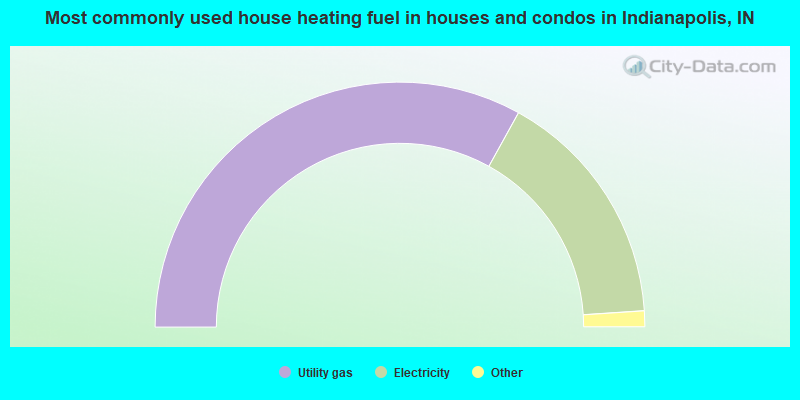
- 66.1%Utility gas
- 31.8%Electricity
- 1.5%Bottled, tank, or LP gas
- 0.3%No fuel used
- 0.1%Other fuel
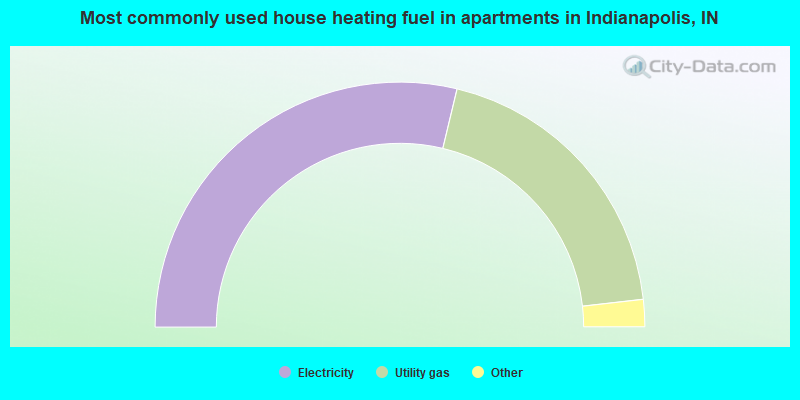
- 57.5%Electricity
- 38.9%Utility gas
- 1.6%Bottled, tank, or LP gas
- 0.8%No fuel used
- 0.6%Other fuel
- 0.4%Fuel oil, kerosene, etc.
- 0.1%Wood
Indianapolis compared to Indiana state average:
- Unemployed percentage significantly below state average.
- Black race population percentage significantly above state average.
- Median age below state average.
- Foreign-born population percentage significantly above state average.
- Percentage of population with a bachelor's degree or higher above state average.
Indianapolis, IN compared to other similar cities:
Indianapolis on our top lists:
- #15 on the list of "Top 101 cities with the largest wind speed differences during a year (population 50,000+)"
- #17 on the list of "Top 101 biggest cities in 2013"
- #19 on the list of "Top 100 biggest cities"
- #26 on the list of "Top 100 cities with largest land areas (pop. 50,000+)"
- #28 on the list of "Top 101 cities with the biggest property tax revenues per resident (population 10,000+)"
- #28 on the list of "Top 100 least-safe cities (highest city-data.com crime index) (pop. 50,000+)"
- #33 on the list of "Top 101 cities with the highest number of assaults per 100,000 residents, excludes tourist destinations and others with a lot of outsiders visiting based on city industries data (population 50,000+)"
- #34 on the list of "Top 101 cities with the highest city-data.com crime index, excludes tourist destinations and others with a lot of outsiders visiting based on city industries data (population 50,000+)"
- #35 on the list of "Top 101 cities with the highest number of burglaries per 100,000 residents, excludes tourist destinations and others with a lot of outsiders visiting based on city industries data (population 50,000+)"
- #37 on the list of "Top 101 cities with the largest city-data.com crime index increase from 2002 to 2012 (population 50,000+)"
- #39 on the list of "Top 101 cities with the largest percentage of people in institutions for the blind (population 1,000+)"
- #43 on the list of "Top 101 cities with the highest number of robberies per 100,000 residents, excludes tourist destinations and others with a lot of outsiders visiting based on city industries data (population 50,000+)"
- #44 on the list of "Top 101 cities with largest percentage of females in occupations: material moving occupations (population 50,000+)"
- #53 on the list of "Top 101 cities with the largest city-data.com crime index per police officer (population 50,000+)"
- #57 on the list of "Top 101 cities with the highest number of arson incidents per 100,000 residents, excludes tourist destinations and others with a lot of outsiders visiting based on city industries data (population 50,000+)"
- #57 on the list of "Top 101 cities with the highest average snowfall in a year (population 50,000+)"
- #63 on the list of "Top 101 larger cities with the largest decrease or smallest increase in household income from 2000 (population 50,000+)"
- #67 on the list of "Top 101 larger cities with the largest decrease or smallest increase in house/condo value from 2000 (population 50,000+)"
- #84 on the list of "Top 101 cities with the highest number of murders per 100,000 residents, excludes tourist destinations and others with a lot of outsiders visiting based on city industries data (population 50,000+)"
- #87 on the list of "Top 101 cities with largest percentage of females in industries: transportation and warehousing (population 50,000+)"
- #5 (46218) on the list of "Top 101 zip codes with the lowest 2012 average net capital gain/loss (pop 5,000+)"
- #17 (46204) on the list of "Top 101 zip codes with the largest charity contributions deductions as a percentage of AGI in 2012 (pop 5,000+)"
- #21 (46202) on the list of "Top 101 zip codes with the most big companies in 2005 (at least 1000 employees)"
- #33 (46204) on the list of "Top 101 zip codes with the most medium-big companies in 2005 (at least 100 employees)"
- #48 (46204) on the list of "Top 101 zip codes with the most offices of lawyers in 2005"
- #73 (46218) on the list of "Top 101 zip codes with the lowest average reported salary/wage in 2012 (pop 5,000+)"
- #83 (46204) on the list of "Top 101 zip codes with the most museums in 2005"
- #85 (46220) on the list of "Top 101 zip codes with the most beauty salons in 2005"
- #87 (46218) on the list of "Top 101 zip codes with the lowest 2012 average Adjusted Gross Income (AGI) for individuals (pop 5,000+)"
- #93 (46235) on the list of "Top 101 zip codes with the largest percentage of Subsaharan African first ancestries"
- #14 on the list of "Top 101 counties with the highest Particulate Matter (PM2.5) Annual air pollution readings in 2012 (µg/m3)"
- #17 on the list of "Top 101 counties with the highest Sulfur Oxides Annual air pollution readings in 2012 (µg/m3)"
- #19 on the list of "Top 101 counties with the highest number of infant deaths per 1000 residents 2007-2013 (pop. 50,000+)"
- #19 on the list of "Top 101 counties with the most Mainline Protestant adherents"
- #20 on the list of "Top 101 counties with the highest carbon monoxide air pollution readings in 2012 (ppm)"
State forum archive:

|
|
Total of 5105 patent applications in 2008-2024.


