Estimated zip code population in 2022: 20,836 Zip code population in 2010: 16,335 Zip code population in 2000: 14,997
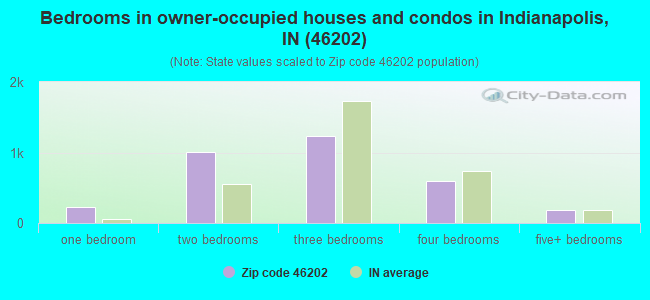
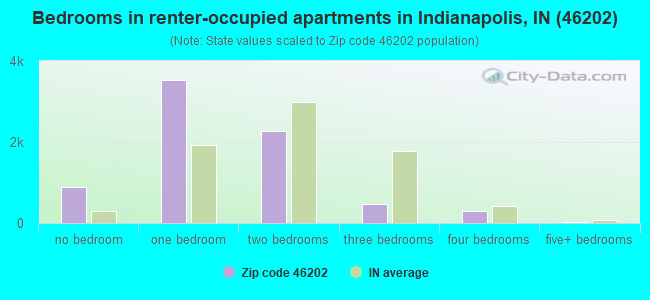
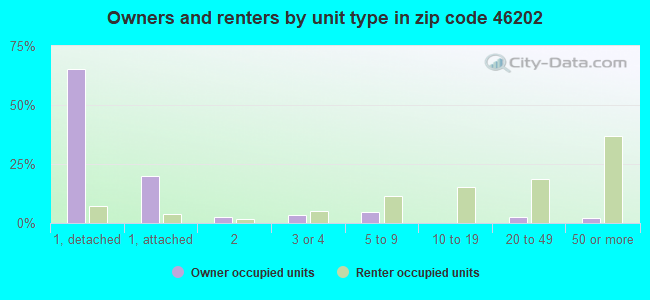
Houses and condos: 12,134 Renter-occupied apartments: 7,403
% of renters here:
70%
State:
29%
March 2022 cost of living index in zip code 46202: 91.7 (less than average, U.S. average is 100)
Land area: 5.6 sq. mi. Water area: 0.2 sq. mi.
Population density: 3,733 people per square mile
(average).
OSM Map
General Map
Google Map
MSN Map
OSM Map
General Map
Google Map
MSN Map
OSM Map
General Map
Google Map
MSN Map
OSM Map
General Map
Google Map
MSN Map
Please wait while loading the map...
Real estate property taxes paid for housing units in 2022:
This zip code:
0.8% ($3,239)
Indiana:
0.7% ($1,467)
Median real estate property taxes paid for housing units with mortgages in 2022: $3,767 (0.8%) Median real estate property taxes paid for housing units with no mortgage in 2022: $1,461 (0.6%)
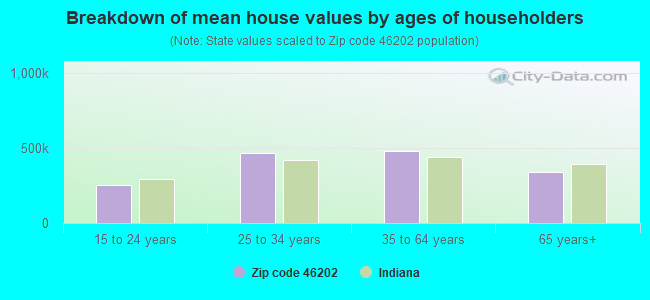
Estimated median house/condo value in 2022: $408,761
46202:
$408,761
Indiana:
$208,700
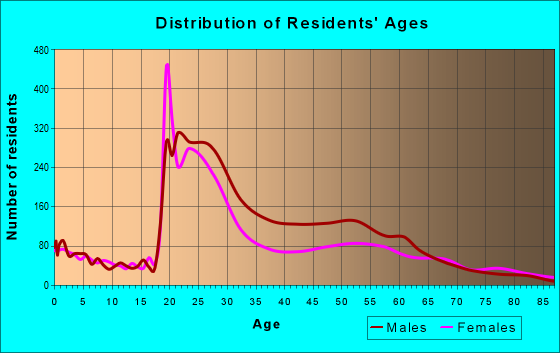
Median resident age:
This zip code:
29.8 years
Indiana median age:
38.2 years
Average household size:
This zip code:
1.8 people
Indiana:
2.4 people
Averages for the 2020 tax year for zip code 46202, filed in 2021:
Average Adjusted Gross Income (AGI) in 2020: $87,323 (Individual Income Tax Returns)
Here:
$87,323
State:
$64,978
Salary/wage: $72,366 (reported on 91.0% of returns)
Here:
$72,366
State:
$55,245
(% of AGI for various income ranges: 1181.0% for AGIs below $25k, 3935.4% for AGIs $25k-50k, 7151.1% for AGIs $50k-75k, 10829.1% for AGIs $75k-100k, 21014.3% for AGIs $100k-200k, 102100.0% for AGIs over 200k)
Taxable interest for individuals: $1,263 (reported on 26.2% of returns)
This zip code:
$1,263
Indiana:
$1,351
(% of AGI for various income ranges: 5.4% for AGIs below $25k, 5.8% for AGIs $25k-50k, 13.1% for AGIs $50k-75k, 43.3% for AGIs $75k-100k, 85.9% for AGIs $100k-200k, 814.4% for AGIs over 200k)
Ordinary dividends: $6,077 (reported on 22.0% of returns)
Here:
$6,077
State:
$5,827
(% of AGI for various income ranges: 12.4% for AGIs below $25k, 16.0% for AGIs $25k-50k, 37.9% for AGIs $50k-75k, 137.3% for AGIs $75k-100k, 294.6% for AGIs $100k-200k, 3720.0% for AGIs over 200k)
Net capital gain/loss in AGI: +$29,364 (reported on 21.2% of returns)
Here:
+$29,364
State:
+$17,730
(% of AGI for various income ranges: 8.8% for AGIs below $25k, 12.9% for AGIs $25k-50k, 72.4% for AGIs $50k-75k, 180.4% for AGIs $75k-100k, 724.1% for AGIs $100k-200k, 21372.0% for AGIs over 200k)
Profit/loss from business: +$14,676 (reported on 13.9% of returns)
Here:
+$14,676
State:
+$12,144
(% of AGI for various income ranges: 83.7% for AGIs below $25k, 76.1% for AGIs $25k-50k, 104.1% for AGIs $50k-75k, 160.0% for AGIs $75k-100k, 771.8% for AGIs $100k-200k, 3733.6% for AGIs over 200k)
Taxable individual retirement arrangement distribution: $20,585 (reported on 4.0% of returns)
46202:
$20,585
Indiana:
$18,302
(% of AGI for various income ranges: 14.3% for AGIs below $25k, 41.8% for AGIs $25k-50k, 48.7% for AGIs $50k-75k, 138.4% for AGIs $75k-100k, 484.1% for AGIs $100k-200k, 1010.8% for AGIs over 200k)
Self-employed (Keogh) retirement plans: $26,730 (reported on 1.0% of returns)
46202:
$26,730
Indiana:
$27,160
(% of AGI for various income ranges: 72.0% for AGIs $100k-200k, 893.6% for AGIs over 200k)
Total itemized deductions: $35,605 (reported on 10.1% of returns)
Here:
$35,605
State:
$35,601
(% of AGI for various income ranges: 23.9% for AGIs below $25k, 61.5% for AGIs $25k-50k, 152.5% for AGIs $50k-75k, 478.2% for AGIs $75k-100k, 1273.3% for AGIs $100k-200k, 8326.0% for AGIs over 200k)
Charity contributions: $16,715 (reported on 8.0% of returns)
Here:
$16,715
State:
$15,596
(% of AGI for various income ranges: 10.0% for AGIs $25k-50k, 26.0% for AGIs $50k-75k, 92.5% for AGIs $75k-100k, 264.3% for AGIs $100k-200k, 4161.2% for AGIs over 200k)
Taxes paid: $8,552 (reported on 10.1% of returns)
46202:
$8,552
State:
$7,542
(% of AGI for various income ranges: 4.1% for AGIs below $25k, 9.5% for AGIs $25k-50k, 40.8% for AGIs $50k-75k, 161.5% for AGIs $75k-100k, 456.9% for AGIs $100k-200k, 1568.0% for AGIs over 200k)
Earned income credit: $1,883 (reported on 13.2% of returns)
Here:
$1,883
State:
$2,298
(% of AGI for various income ranges: 70.4% for AGIs below $25k, 32.0% for AGIs $25k-50k)
Percentage of individuals using paid preparers for their 2020 taxes: 94.3%
Here:
94%
State:
94%
(% for various income ranges: 92.9% for AGIs below $25k, 93.8% for AGIs $25k-50k, 95.4% for AGIs $50k-75k, 96.2% for AGIs $75k-100k, 95.5% for AGIs $100k-200k, 96.2% for AGIs over 200k)
Averages for the 2012 tax year for zip code 46202, filed in 2013:
Average Adjusted Gross Income (AGI) in 2012: $52,479 (Individual Income Tax Returns)
Here:
$52,479
State:
$52,932
Salary/wage: $45,406 (reported on 90.9% of returns)
Here:
$45,406
State:
$45,173
(% of AGI for various income ranges: 84.8% for AGIs below $25k, 91.2% for AGIs $25k-50k, 90.2% for AGIs $50k-75k, 85.6% for AGIs $75k-100k, 79.1% for AGIs $100k-200k, 60.8% for AGIs over 200k)
Taxable interest for individuals: $1,142 (reported on 23.4% of returns)
This zip code:
$1,142
Indiana:
$1,311
(% of AGI for various income ranges: 0.3% for AGIs below $25k, 0.3% for AGIs $25k-50k, 0.2% for AGIs $50k-75k, 0.2% for AGIs $75k-100k, 0.4% for AGIs $100k-200k, 1.0% for AGIs over 200k)
Ordinary dividends: $5,645 (reported on 16.2% of returns)
Here:
$5,645
State:
$4,690
(% of AGI for various income ranges: 1.0% for AGIs below $25k, 0.5% for AGIs $25k-50k, 0.9% for AGIs $50k-75k, 0.9% for AGIs $75k-100k, 1.7% for AGIs $100k-200k, 3.5% for AGIs over 200k)
Net capital gain/loss in AGI: +$8,979 (reported on 12.5% of returns)
Here:
+$8,979
State:
+$10,406
(% of AGI for various income ranges: 0.2% for AGIs below $25k, 0.4% for AGIs $25k-50k, 0.4% for AGIs $50k-75k, 0.3% for AGIs $75k-100k, 2.1% for AGIs $100k-200k, 5.4% for AGIs over 200k)
Profit/loss from business: +$12,772 (reported on 12.8% of returns)
Here:
+$12,772
State:
+$11,105
(% of AGI for various income ranges: 6.9% for AGIs below $25k, 2.2% for AGIs $25k-50k, 2.1% for AGIs $50k-75k, 3.0% for AGIs $75k-100k, 4.2% for AGIs $100k-200k, 1.9% for AGIs over 200k)
Taxable individual retirement arrangement distribution: $16,360 (reported on 5.1% of returns)
46202:
$16,360
Indiana:
$13,841
(% of AGI for various income ranges: 0.9% for AGIs below $25k, 1.1% for AGIs $25k-50k, 1.3% for AGIs $50k-75k, 2.5% for AGIs $75k-100k, 2.5% for AGIs $100k-200k, 1.3% for AGIs over 200k)
Self-employment retirement plans: $21,100 (reported on 0.9% of returns)
46202:
$21,100
Indiana:
$21,482
Total itemized deductions: $22,595 (17% of AGI, reported on 23.1% of returns)
Here:
$22,595
State:
$20,913
Here:
16.8% of AGI
State:
18.2% of AGI
(% of AGI for various income ranges: 4.2% for AGIs below $25k, 5.1% for AGIs $25k-50k, 9.0% for AGIs $50k-75k, 12.5% for AGIs $75k-100k, 12.9% for AGIs $100k-200k, 12.6% for AGIs over 200k)
Charity contributions: $5,217 (reported on 18.6% of returns)
Here:
$5,217
State:
$4,697
(% of AGI for various income ranges: 0.4% for AGIs below $25k, 0.7% for AGIs $25k-50k, 1.2% for AGIs $50k-75k, 1.6% for AGIs $75k-100k, 2.0% for AGIs $100k-200k, 3.4% for AGIs over 200k)
Taxes paid: $9,343 (reported on 23.0% of returns)
46202:
$9,343
State:
$7,456
(% of AGI for various income ranges: 1.0% for AGIs below $25k, 1.3% for AGIs $25k-50k, 3.0% for AGIs $50k-75k, 4.5% for AGIs $75k-100k, 5.7% for AGIs $100k-200k, 6.2% for AGIs over 200k)
Earned income credit: $1,973 (reported on 18.7% of returns)
Here:
$1,973
State:
$2,265
(% of AGI for various income ranges: 5.8% for AGIs below $25k, 0.4% for AGIs $25k-50k)
Percentage of individuals using paid preparers for their 2012 taxes: 35.7%
Here:
36%
State:
53%
(% for various income ranges: 33.5% for AGIs below $25k, 30.4% for AGIs $25k-50k, 34.5% for AGIs $50k-75k, 36.2% for AGIs $75k-100k, 50.0% for AGIs $100k-200k, 74.1% for AGIs over 200k)
Averages for the 2004 tax year for zip code 46202, filed in 2005:
Average Adjusted Gross Income (AGI) in 2004: $40,757 (Individual Income Tax Returns)
Here:
$40,757
State:
$44,790
Salary/wage: $35,749 (reported on 90.5% of returns)
Here:
$35,749
State:
$39,615
(% of AGI for various income ranges: 115.1% for AGIs below $10k, 88.2% for AGIs $10k-25k, 90.9% for AGIs $25k-50k, 89.3% for AGIs $50k-75k, 84.4% for AGIs $75k-100k, 63.6% for AGIs over 100k)
Taxable interest for individuals: $1,546 (reported on 30.1% of returns)
This zip code:
$1,546
Indiana:
$1,535
(% of AGI for various income ranges: 1.3% for AGIs below $10k, 0.6% for AGIs $10k-25k, 0.4% for AGIs $25k-50k, 0.5% for AGIs $50k-75k, 1.0% for AGIs $75k-100k, 2.0% for AGIs over 100k)
Taxable dividends: $4,328 (reported on 16.6% of returns)
Here:
$4,328
State:
$2,998
(% of AGI for various income ranges: 2.0% for AGIs below $10k, 0.4% for AGIs $10k-25k, 0.5% for AGIs $25k-50k, 0.8% for AGIs $50k-75k, 1.4% for AGIs $75k-100k, 3.3% for AGIs over 100k)
Net capital gain/loss: +$11,182 (reported on 13.1% of returns)
Here:
+$11,182
State:
+$8,619
(% of AGI for various income ranges: -0.6% for AGIs below $10k, 0.3% for AGIs $10k-25k, 0.4% for AGIs $25k-50k, 1.4% for AGIs $50k-75k, 1.8% for AGIs $75k-100k, 7.8% for AGIs over 100k)
Profit/loss from business: +$14,618 (reported on 10.7% of returns)
Here:
+$14,618
State:
+$10,071
(% of AGI for various income ranges: 2.8% for AGIs below $10k, 2.8% for AGIs $10k-25k, 2.6% for AGIs $25k-50k, 2.6% for AGIs $50k-75k, 4.5% for AGIs $75k-100k, 5.2% for AGIs over 100k)
IRA payment deduction: $2,436 (reported on 1.5% of returns)
46202:
$2,436
Indiana:
$2,840
(% of AGI for various income ranges: 0.1% for AGIs $10k-25k, 0.1% for AGIs $25k-50k, 0.0% for AGIs $50k-75k, 0.1% for AGIs $75k-100k, 0.1% for AGIs over 100k)
Self-employed pension: $20,803 (reported on 1.1% of returns)
Here:
$20,803
Indiana:
$15,305
(% of AGI for various income ranges: 1.4% for AGIs below $10k, 0.3% for AGIs $50k-75k, 1.2% for AGIs over 100k)
Total itemized deductions: $18,276 (18% of AGI, reported on 23.9% of returns)
Here:
$18,276
State:
$17,065
Here:
18.2% of AGI
State:
19.5% of AGI
(% of AGI for various income ranges: 8.3% for AGIs below $10k, 4.8% for AGIs $10k-25k, 7.2% for AGIs $25k-50k, 11.5% for AGIs $50k-75k, 14.7% for AGIs $75k-100k, 13.2% for AGIs over 100k)
Charity contributions deductions: $3,801 (3% of AGI, reported on 19.6% of returns)
Here:
$3,801
State:
$3,550
Here:
3.4% of AGI
State:
3.8% of AGI
(% of AGI for various income ranges: 0.4% for AGIs below $10k, 0.5% for AGIs $10k-25k, 1.0% for AGIs $25k-50k, 1.6% for AGIs $50k-75k, 2.0% for AGIs $75k-100k, 2.8% for AGIs over 100k)
Total tax: $8,331 (reported on 69.9% of returns)
46202:
$8,331
State:
$6,914
(% of AGI for various income ranges: 2.7% for AGIs below $10k, 4.3% for AGIs $10k-25k, 9.0% for AGIs $25k-50k, 12.8% for AGIs $50k-75k, 14.1% for AGIs $75k-100k, 21.4% for AGIs over 100k)
Earned income credit: $1,520 (reported on 21.6% of returns)
Here:
$1,520
State:
$1,685
Percentage of individuals using paid preparers for their 2004 taxes: 44.8%
Here:
45%
State:
59%
(% for various income ranges: 43.7% for AGIs below $10k, 46.7% for AGIs $10k-25k, 39.0% for AGIs $25k-50k, 43.4% for AGIs $50k-75k, 48.0% for AGIs $75k-100k, 61.3% for AGIs over 100k)
Likely homosexual households (counted as self-reported same-sex unmarried-partner households)
Lesbian couples: 0.2% of all households
Gay men: 0.5% of all households
Household received Food Stamps/SNAP in the past 12 months: 936 Household did not receive Food Stamps/SNAP in the past 12 months: 9,850
Women who had a birth in the past 12 months: 163 (163 now married, 9 unmarried) Women who did not have a birth in the past 12 months: 7,099 (1,481 now married, 5,589 unmarried)
Housing units in zip code 46202 with a mortgage: 2,213 (334 second mortgage, 13 home equity loan, 281 both second mortgage and home equity loan) Houses without a mortgage: 37
Median monthly owner costs for units with a mortgage: $2,137 Median monthly owner costs for units without a mortgage: $584
Residents with income below the poverty level in 2022:
This zip code:
24.5%
Whole state:
12.6%
Residents with income below 50% of the poverty level in 2022:
This zip code:
9.2%
Whole state:
6.3%
Median number of rooms in houses and condos:
Here:
5.9
State:
6.6
Median number of rooms in apartments:
Here:
3.1
State:
4.3
Notable locations in this zip code not listed on our city pages
Notable locations in zip code 46202: Indianapolis Water Company Riverside Station (A), Indianapolis Water Company White River Station (B), Kuntz Stadium (C), South Grove Golf Course (D), Bush Stadium (E), Cornelius Art Center (F), Emelie Building (G), Morris-Butler House (H), Madam Walker Urban Life Center and Theater (I), Indiana State Library (J), Indiana Historical Society (K), Athenaeum (L), Select Specialty Hospital Indianapolis Campus (M), Ott Building (N), Bryce Building (O), Myers Building (P), Dunlap Building (Q), President Harrisons Home (R), Indianapolis Fire Department Station 5 (S), Indianapolis Fire Department Station 13 (T). Display/hide their locations on the map
Churches in zip code 46202 include: North West Street Church of Christ (A), Saint Clair Street Wesleyan Church (B), Old Land Mark House of Prayer (C), Infant of Prague Brighter Day Spiritual Church (D), Memorial United Presbyterian Church (E), Faith Apostolic Pentecostal Church (F), House of Prayer Apostolic Church (G), Allen Chapel Church of Christ Jesus (H), Scott United Methodist Church (I). Display/hide their locations on the map
Parks in zip code 46202 include: Military Park (1), Bloch Park (2), Fall Creek And 16th Street Park (3), Old Northside Historic District (4), Martin Luther King Memorial Park (5). Display/hide their locations on the map
Tourist attractions (not listed on the city page) : Benjamin Harrison Presidential Site (Museums; 1230 North Delaware Street), Freetown Village Inc (Museums; 617 Indiana Avenue Suite 200), Historic Landmarks Foundation of Indiana - Morris-Butler House Museum (1204 North Park Avenue), Morris-Butler House Museum (Cultural Attractions- Events- & Facilities; 1204 North Park Avenue), James Whitcomb Riley Museum Home (Cultural Attractions- Events- & Facilities; 528 Lockerbie Street), Historic Landmarks Foundation of Indiana - Headquarters (Cultural Attractions- Events- & Facilities; 340 West Michigan Street), Benjamin Harrison Presidential Home (Cultural Attractions- Events- & Facilities; 1230 North Delaware Street), Yellow Rose Carriages (Tours & Charters; 1327 North Capitol Avenue).
1,115 married couples with children.
435 single-parent households (34 men, 401 women).
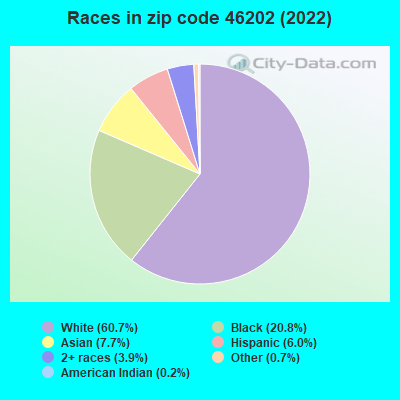
86.2% of residents of 46202 zip code speak English at home.
4.6% of residents speak Spanish at home (82% very well, 5% well, 13% not well).
5.5% of residents speak other Indo-European language at home (69% very well, 28% well, 3% not well).
1.7% of residents speak Asian or Pacific Island language at home (46% very well, 40% well, 11% not well, 3% not at all).
2.0% of residents speak other language at home (85% very well, 15% well).
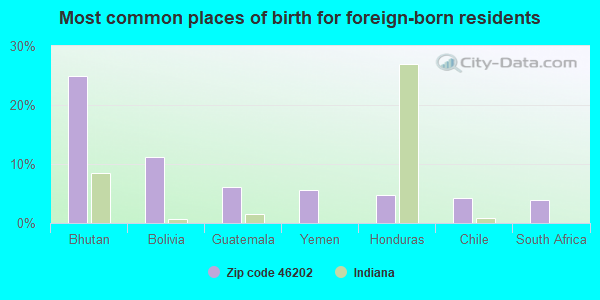
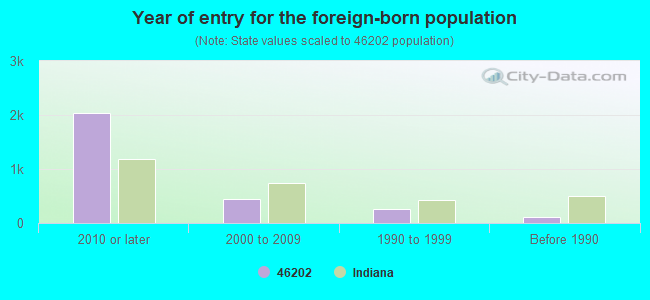
Foreign born population: 2,540 (12.2%) (21.9% of them are naturalized citizens)
Major facilities with environmental interests located in this zip code:
RUMPKE INDIANAPOLIS TRANSFER STATION (2101 N MONTCALM in INDIANAPOLIS, IN)
AIR MINOR (AIRS/AFS) STATE MASTER (Indiana facility tracking) - ACES-OP-09700205, AIR PROGRAM, CRTK-6913, EPCRA, UST-1570, UNDERGROUND STORAGE TANK PROGRAM (Resource Conservation and Recovery Act (tracking hazardous waste)) TRI REPORTER (Tracking of toxic chemicals releasing facilities) Business SIC classification: MOTOR VEHICLE PARTS AND ACCESSORIES Organizations: PACER INDUSTRIES INC (CONTACT/OWNER)
, WHITEFORD SYSTEM (CONTACT/OWNER)
Alternative names: UNITED BRAKE SYSTEMS, WHITEFORD NATIONALEASE INC
COMMERCIAL FINISHING CORPORATION (1125 BROOKSIDE AVE in INDIANAPOLIS, IN)
AIR MAJOR (AIRS/AFS) STATE MASTER (Indiana facility tracking) - ACES-OP-09700178, AIR PROGRAM, UST-46, UNDERGROUND STORAGE TANK PROGRAM CRITERIA AND HAZARDOUS AIR POLLUTANT INVENTORY (Inventory of air pollution sources) Conditionally Exempt Small Quantity Generators, less than 100 kg/month of hazardous waste (Resource Conservation and Recovery Act (tracking hazardous waste)) (Resource Conservation and Recovery Act (tracking hazardous waste)) Business SIC classification: COATING, ENGRAVING, AND ALLIED SERVICES Business NAICS classification: METAL COATING, ENGRAVING (EXCEPT JEWELRY AND SILVERWARE), AND ALLIED SERVICES TO MANUFACTURERS.; METAL COATING, ENGRAVING (EXCEPT JEWELRY AND SILVERWARE), AND ALLIED SERVICES TO MANUFACTURERS. Organizations: SCHWITZER INC (CONTACT/OWNER)
Alternative names: SCHWITZER
POLAR ICE CO (2000 DR MARTIN LUTHER KING ST in INDIANAPOLIS, IN)
(Integrated Compliance Information System) - ICIS-05-1998-0077, FORMAL ENFORCEMENT ACTION STATE MASTER (Indiana facility tracking) - CRTK-21862, EPCRA Business SIC classification: MANUFACTURED ICE
PROGRESSIVE PLATING COMPANY INCORPORATED (2064 COLUMBIA AVE. in INDIANAPOLIS, IN)
STATE MASTER (Indiana facility tracking) - CRTK-152, EPCRA, SPILL-199011006, RELEASE ASSESSMENT, SPILL-199012013, HAZARDOUS WASTE BIENNIAL REPORTER (Resource Conservation and Recovery Act (tracking hazardous waste)) Large Quantity Generators, more that 1000 kg of hazardous waste/month (Resource Conservation and Recovery Act (tracking hazardous waste)) TRI REPORTER (Tracking of toxic chemicals releasing facilities) Business SIC and NAICS classification: ELECTROPLATING, PLATING, POLISHING, ANODIZING, AND COLORING Organizations: PROGRESSIVE PLATING CO INC (CONTACT/OPERATOR)
, ALLEN WILLIAMSON (CONTACT/OWNER)
PRECISION MACHINE CO INCORPORATED (1110 E. 22ND ST. in INDIANAPOLIS, IN)
STATE MASTER (Indiana facility tracking) - CRTK-6360, EPCRA (Resource Conservation and Recovery Act (tracking hazardous waste)) TRI REPORTER (Tracking of toxic chemicals releasing facilities) Business SIC classification: SCREW MACHINE PRODUCTS Organizations: HARLAN DANIEL C (CONTACT/OWNER)
NATIONAL PRINTFAST (600 E. OHIO ST. in INDIANAPOLIS, IN)
STATE MASTER (Indiana facility tracking) - UST-6548, UNDERGROUND STORAGE TANK PROGRAM, LUST-199511515, LEAKING STORAGE TANK, CRTK-7534, EPCRA (Resource Conservation and Recovery Act (tracking hazardous waste)) TRI REPORTER (Tracking of toxic chemicals releasing facilities) Organizations: POST AND CO (CONTACT/OWNER)
QUALITY FINISHING INCORPORATED (50 S. SHELBY ST. in INDIANAPOLIS, IN)
STATE MASTER (Indiana facility tracking) - CRTK-3983, EPCRA (Resource Conservation and Recovery Act (tracking hazardous waste)) TRI REPORTER (Tracking of toxic chemicals releasing facilities) Business SIC classification: ELECTROPLATING, PLATING, POLISHING, ANODIZING, AND COLORING
48 UNITED OIL SERVICE (1001 SOUTHEASTERN AVE in INDIANAPOLIS, IN)
STATE MASTER (Indiana facility tracking) - CRTK-927, EPCRA, UST-2586, UNDERGROUND STORAGE TANK PROGRAM, UST-6795, (Resource Conservation and Recovery Act (tracking hazardous waste)) Organizations: GISH BART (CONTACT/OWNER)
Alternative names: BARTS BRAKE TECHNICIANS INC, #48 UNITED OIL SVC
COMMERCIAL PLATING (1142 E BATES ST in INDIANAPOLIS, IN)
STATE MASTER (Indiana facility tracking) - CRTK-19313, EPCRA Large Quantity Generators, more that 1000 kg of hazardous waste/month (Resource Conservation and Recovery Act (tracking hazardous waste)) Organizations: OWNER NOT REPORTED (CONTACT/OWNER)
, AL MAYO (CONTACT/OWNER)
PEPSI COLA BOTTLING CO (1030 E NEW YORK ST in INDIANAPOLIS, IN)
STATE MASTER (Indiana facility tracking) - CRTK-1494, EPCRA, LUST-199003134, LEAKING STORAGE TANK, SPILL-199003134, RELEASE ASSESSMENT, UST-7792, UNDERGROUND STORAGE TANK PROGRAM (Resource Conservation and Recovery Act (tracking hazardous waste)) Alternative names: PEPSI COLA OF INDIANAPOLIS INDIANA
BOWES IND INC (1324 N CAPITOL in INDIANAPOLIS, IN)
STATE MASTER (Indiana facility tracking) - UST-21455, UNDERGROUND STORAGE TANK PROGRAM, CRTK-2187, EPCRA (Resource Conservation and Recovery Act (tracking hazardous waste)) TRI REPORTER (Tracking of toxic chemicals releasing facilities) Business SIC classification: MISCELLANEOUS FABRICATED WIRE PRODUCTS; FABRICATED METAL PRODUCTS Alternative names: H N ADVERTISING AND DISPLAY CO INC, HN ADVERTISING & DISPLAY CO.
MPL CORPORATION (1017 E. 22ND ST. in INDIANAPOLIS, IN)
STATE MASTER (Indiana facility tracking) - CRTK-2100, EPCRA (Resource Conservation and Recovery Act (tracking hazardous waste)) TRI REPORTER (Tracking of toxic chemicals releasing facilities) Business SIC classification: PLASTICS PLUMBING FIXTURES Organizations: CROWLEY THOMAS (CONTACT/OWNER)
LILLY INDUSTRIES INCORPORATED PERFECTION PAINT BUSINESS UNIT (715 EAST MARYLAND STREET in INDIANAPOLIS, IN)
STATE MASTER (Indiana facility tracking) - UST-7851, UNDERGROUND STORAGE TANK PROGRAM, CRTK-275, EPCRA, LUST-199002540, LEAKING STORAGE TANK Conditionally Exempt Small Quantity Generators, less than 100 kg/month of hazardous waste (Resource Conservation and Recovery Act (tracking hazardous waste)) - notification HAZARDOUS WASTE BIENNIAL REPORTER (Resource Conservation and Recovery Act (tracking hazardous waste)) TRI REPORTER (Tracking of toxic chemicals releasing facilities) Business SIC classification: PAINTS, VARNISHES, LACQUERS, ENAMELS, AND ALLIED PRODUCTS Alternative names: LILLY IND. INC., PERFECTION PAINT BUS. UNIT, LILLY IND USA INC PERFECTION PAINT
Housing units lacking complete plumbing facilities: 2.2% Housing units lacking complete kitchen facilities: 2.6%
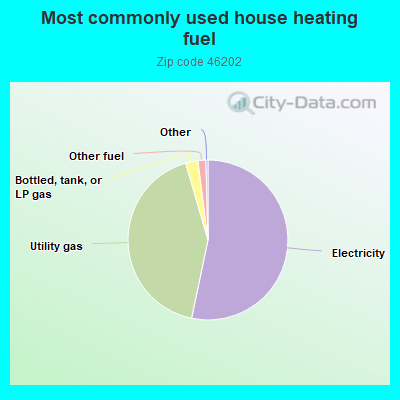
53.3%Electricity
42.2%Utility gas
2.5%Bottled, tank, or LP gas
1.6%Other fuel
Population in 1990: 15,672.
Place of birth for U.S.-born residents:
This state: 11,517
Northeast: 693
Midwest: 3,201
South: 2,150
West: 720
37% of the 46202 zip code residents lived in the same house 5 years ago. Out of people who lived in different houses, 58% lived in this county. Out of people who lived in different counties, 50% lived in Indiana.
70% of the 46202 zip code residents lived in the same house 1 year ago. Out of people who lived in different houses, 54% moved from this county. Out of people who lived in different houses, 13% moved from different county within same state. Out of people who lived in different houses, 20% moved from different state. Out of people who lived in different houses, 8% moved from abroad.
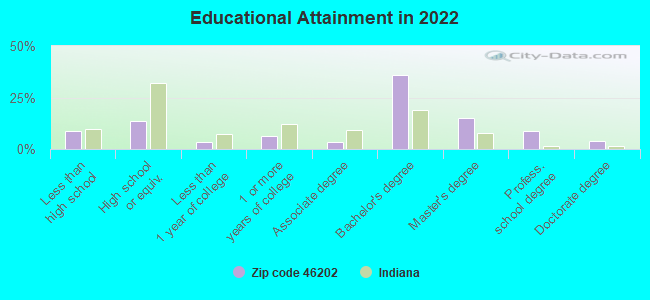
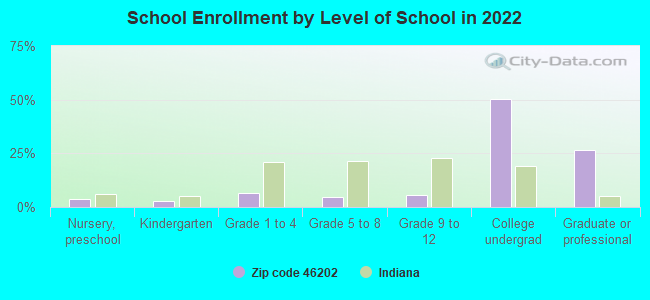
Private vs. public school enrollment:
Students in private schools in grades 1 to 8 (elementary and middle school): 252
Here:
37.4%
Indiana:
14.9%
Students in private schools in grades 9 to 12 (high school): 55
Here:
17.5%
Indiana:
11.4%
Students in private undergraduate colleges: 255
Here:
8.7%
Indiana:
22.3%
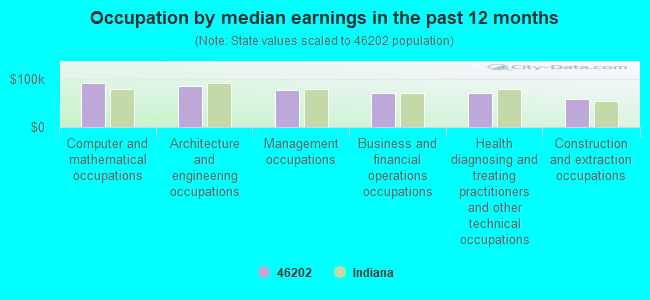
Occupation by median earnings in the past 12 months ($)
91,969Computer and mathematical occupations
84,774Architecture and engineering occupations
77,714Management occupations
71,784Business and financial operations occupations
71,556Health diagnosing and treating practitioners and other technical occupations
57,763Construction and extraction occupations
Companies with biggest federal contracts located in this zip code (INDIANAPOLIS, IN):
INDIANA UNIVERSITY (INC) (425 UNIVERSITY BLVD CA147) : $8,567,406 in 42 contractsfrom 1999 to 2006
Contracts for Educational Services, Tuition, Registration, and Membership Fees, Other Professional Services, Lectures For Training, and moreby Army, Navy, National Institutes of Health Signed by year:2000: $0; 2001: $0; 2002: $204,019; 2003: $2,732; 2004: $801,457; 2005: $6,820,159; 2006: $177,039.
Biggest contracts:
$6,190,350 with Army for Educational Services. Signed on 2005-12-19. Completion date: 2006-09-30.
$311,000 with Army for Tuition, Registration, and Membership Fees. Signed on 1999-12-17. Completion date: 2000-11-30.
$251,000, same as above.Signed on 1999-12-17. Completion date: 2000-11-30.
$182,300 with Navy for Tuition, Registration, and Membership Fees. Signed on 2004-12-16. Completion date: 2005-05-30.
DAVIS & ASSOCIATES INC (414 DORMAN ST; small business) : $6,573,842 in 17 contractsfrom 2001 to 2006
Contracts for Construction of Structures and Facilities -- Other Airfield Structures, Demolition of Structures or Facilities (Other than Buildings), Maintenance, Repair or Alteration of Real Property -- Electronic and Communications Facilities, Maintenance, Repair or Alteration of Real Property -- Parking Facilities Conservation, and moreby Army, Air Force, Department of Veterans Affairs, Public Buildings Service, and others Signed by year:2000: $0; 2001: $2,000; 2002: $0; 2003: $199,125; 2004: $839,652; 2005: $5,485,453; 2006: $47,612.
Biggest contracts:
$4,136,037 with Army for Construction of Structures and Facilities -- Other Airfield Structures. Signed on 2005-12-08. Completion date: 2006-07-28.
$1,349,416, same as above.Signed on 2005-09-29. Completion date: 2006-07-28.
$311,499 with Air Force for Demolition of Structures or Facilities (Other than Buildings). Signed on 2004-09-14. Completion date: 2005-01-21.
$191,505 with Air Force for Maintenance, Repair or Alteration of Real Property -- Electronic and Communications Facilities. Signed on 2004-09-30. Completion date: 2004-12-07.
REGENSTRIEF INSTITUTE (1050 WISHARD BLVD) : $1,553,875 in 10 contractsfrom 2003 to 2005
Contracts for Programming Services, Program Management/Support Services, Tuition, Registration, and Membership Fees by National Institutes of Health, Army, Air Force Signed by year:2000: $0; 2001: $0; 2002: $0; 2003: $672,386; 2004: $402,790; 2005: $478,699; 2006: $0.
Biggest contracts:
$478,699 with National Institutes of Health for Programming Services. Taking place in MD. Signed on 2005-08-15. Completion date: 2008-01-31.
$314,000, same as above.Signed on 2004-07-27. Completion date: 2008-01-31.
$276,636, same as above.Signed on 2003-09-15. Completion date: 2008-01-15.
$200,000, same as above.Signed on 2003-01-15. Completion date: 2008-01-15.
NETWISE RESOURCES LLC (217 WEST 10TH STREET; small business) : $1,175,140 in 6 contractsfrom 2005 to 2006
Contracts for Construction of Structures and Facilities -- Electronic and Communications Facilities, ADP Support Equipment by Army Signed by year:2000: $0; 2001: $0; 2002: $0; 2003: $0; 2004: $0; 2005: $1,132,866; 2006: $42,274.
Biggest contracts:
$995,774 with Army for Construction of Structures and Facilities -- Electronic and Communications Facilities. Signed on 2005-09-30. Completion date: 2006-09-30.
$137,092 with Army for ADP Support Equipment. Signed on 2005-09-24. Completion date: 2005-10-20.
$42,190 with Army for Construction of Structures and Facilities -- Electronic and Communications Facilities. Signed on 2006-03-31. Completion date: 2006-09-30.
$241, same as above.Signed on 2006-01-26. Completion date: 2006-09-30.
REGENSTRIEF FOUNDATION INC (1050 WISHARD BOULEVARD) : $802,500 in 5 contractsfrom 2000 to 2002
Contracts for Other Professional Services, Telecommunications Network Management Services by National Institutes of Health, Army Signed by year:2000: $409,000; 2001: $319,000; 2002: $74,500; 2003: $0; 2004: $0; 2005: $0; 2006: $0.
Biggest contracts:
$409,000 with National Institutes of Health for Other Professional Services. Signed on 2000-08-15. Completion date: 2001-09-15.
$319,000, same as above.Signed on 2001-09-15. Completion date: 2002-09-15.
$65,000, same as above.Signed on 2002-09-15. Completion date: 2003-01-15.
$9,500 with Army for Telecommunications Network Management Services. Taking place in TX. Signed on 2002-10-28. Completion date: 2003-09-30.
DR DONALD HORACE NEWELL (1121 WEST MICHIGAN STREET; small business) : $648,042 in 10 contractsfrom 2001 to 2002
Contracts for Tuition, Registration, and Membership Fees by Navy Signed by year:2000: $0; 2001: $231,103; 2002: $416,939; 2003: $0; 2004: $0; 2005: $0; 2006: $0.
Biggest contracts:
$129,777 with Navy for Tuition, Registration, and Membership Fees. Signed on 2002-12-20. Completion date: 2003-05-15.
$93,527, same as above.Signed on 2001-11-15. Completion date: 2002-04-05.
$93,123, same as above.Signed on 2002-06-17. Completion date: 2002-12-15.
$69,117, same as above.Signed on 2001-12-04. Completion date: 2002-04-15.
STERLING FLUID SYSTEMS (USA) L (2005 DR MARTIN LUTHER KIN) : $305,070 in 3 contractsfrom 2000 to 2005
$111,659 with U.S. Army Corps of Engineers - civil program financing only for Power and Hand Pumps. Signed on 2005-09-29. Completion date: 2006-04-27.
$111,659 with Army for Power and Hand Pumps. Signed on 2005-09-29. Completion date: 2006-04-27.
$81,752 with Air Force for Compressors and Vacuum Pumps. Taking place in PA. Signed on 2000-09-30. Completion date: 2000-12-01.
MCBROOM ELECTRIC CO INC (800 W 16TH ST; small business) : $228,116 in 25 contractsfrom 2004 to 2006
Contracts for Motors, Electrical, Radar Equipment, Except Airborne, Antennas, Waveguides, and Related Equipment, Equipment and Materials Testing -- Maintenance and Repair Shop Equipment by Navy Signed by year:2000: $0; 2001: $0; 2002: $0; 2003: $0; 2004: $28,578; 2005: $165,298; 2006: $34,240.
Biggest contracts:
$18,320 with Navy for Motors, Electrical. Signed on 2005-11-09. Completion date: 2005-11-23.
$18,320, same as above.Signed on 2005-07-22. Completion date: 2005-08-15.
$17,120, same as above.Signed on 2006-02-01. Completion date: 2006-02-20.
$17,120 with Navy for Radar Equipment, Except Airborne. Signed on 2006-03-13. Completion date: 2006-03-31.
JOHNSON CONTROLS, INC (1255 N SENATE AVE) : $151,988 in 2 contractsfrom 2001 to 2003
$99,988 with Defense Logistics Agency for Switches. Signed on 2003-10-30. Completion date: 2003-11-30.
$52,000 with Department of Veterans Affairs for A&E Production Engineering Services (including Design and Control, and Building Programming). Signed on 2001-04-15. Completion date: 2001-07-15.
DOALL CENTRAL COMPANY INC (1850 W 16TH ST)
$99,995 with Navy for Saws and Filing Machines. Signed on 2001-03-01. Completion date: 2001-07-01.
Top industries in this zip code by the number of employees in 2005:
Health Care and Social Assistance: General Medical and Surgical Hospitals (over 1000 employees: 6 establishments, 250-499 employees: 1 establishment, 1-4 employees: 1 establishment)
Other Services (except Public Administration): Religious Organizations (over 1000: 1, 20-49: 3, 10-19: 4, 5-9: 6, 1-4: 12)
Health Care and Social Assistance: Offices of Physicians (except Mental Health Specialists) (50-99: 9, 20-49: 19, 10-19: 16, 5-9: 6, 1-4: 21)
Information: Television Broadcasting (100-249: 4, 1-4: 1)
2003 - 2018 National Fire Incident Reporting System (NFIRS) incidents
Based on the data from the years 2003 - 2018 the average number of fire incidents per year is 31. The highest number of fires - 89 took place in 2017, and the least - 0 in 2014. The data has a growing trend.
When looking into fire subcategories, the most incidents belonged to: Structure Fires (45.2%), and Outside Fires (36.8%).
Fire incident types reported to NFIRS in Zip Code 46202
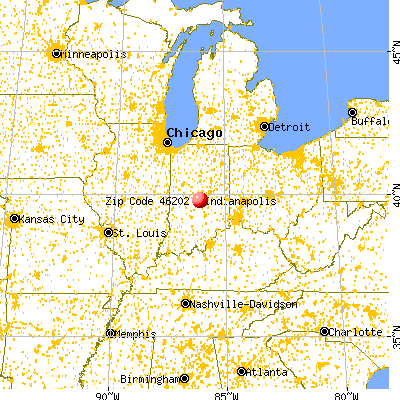


 Nearest zip codes: 46204, 46208, 46225, 46222, 46205, 46201.


 Based on the data from the years 2003 - 2018 the average number of fire incidents per year is 31. The highest number of fires - 89 took place in 2017, and the least - 0 in 2014. The data has a growing trend.
 When looking into fire subcategories, the most incidents belonged to: Structure Fires (45.2%), and Outside Fires (36.8%).