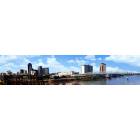
Indianapolis, Indiana, often referred to as "Indy," is a vibrant city known for its thriving sports culture and friendly communities. In comparison, Shreveport, Louisiana, known as the "Port City," is renowned for its rich musical tradition and charming southern hospitality. Both cities feature unique cultural offerings, economic opportunities, and distinct living conditions. This article aims to provide a comprehensive comparison of the two cities in aspects such as crime and safety, weather, cost of living, education, work, and more, to give a deep insight both for those considering relocation and tourists planning a visit.
Distance between
Indianapolis, IN and
Shreveport, LA : 660.5 miles
Indianapolis's population is larger by 379%. Its population has grown by 100,169 people (12.8%) since 2000. The population of Shreveport has decreased by 16,124 people (8.1%) during that time.
Both Indianapolis and Shreveport struggle with relatively high crime rates compared to the national average. However, the severity varies by neighborhood in both cities, and crime rate has been decreasing in recent years. For prospective residents and tourists, it's always suggested to research and choose safer neighborhoods and tourist areas. Additionally, both cities have robust police departments actively working to improve safety.
City-data.com crime index counts serious crimes and violent crime more heavily. It adjusts for the number of visitors and daily workers commuting into cities. (higher means more crime, U.S. average = 301.1)
City-data.com crime index counts serious crimes and violent crime more heavily. It adjusts for the number of visitors and daily workers commuting into cities. (higher means more crime, U.S. average = 301.1)
Sex Offenders
According to our data, there are 82 registered sex offenders living in Indianapolis and 661 registered sex offenders living in . The ratio of residents to sex offenders in Indianapolis is 10,396 to 1; the ratio in Shreveport is 295 to 1. The number of registered sex offenders compared to the number of residents is a lot smaller in Indianapolis than in Shreveport.
Cost of Living
Shreveport typically has a lower cost of living compared to Indianapolis due primarily to lower housing costs. However, individual expenses may differ greatly based on lifestyle, family size, and personal spending habits.
Income Tax
In terms of income tax, Indiana charges a flat rate of 3.23%, plus a county tax that ranges from 0.1% to 3.38%. Louisiana has a progressive state income tax that varies from 2% to 6% depending on income levels.
Property Tax
Property taxes in Indiana are generally lower than in Louisiana. Homeowners in Indianapolis usually pay about 0.85% of their property value, whereas in Shreveport, the rate is roughly 0.89%.
Sales Tax
Indianapolis and the rest of Indiana have a flat statewide sales tax of 7%, while in Shreveport and the rest of Louisiana the combined state and local sales taxes can range from 8.45% to 11.45%.
Income
Type
Indianapolis
Shreveport
Estimated median household income
$58,479
$42,034
Estimated per capita income
$32,792
$27,828
Cost of living index (U.S. average is 100)
87.7
84.7
If you make $50,000 in Shreveport, you will have to make $51,771 in Indianapolis to maintain the same standard of living.
Geographical Conditions
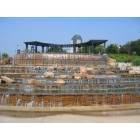
Indianapolis is predominantly flat with some small rolling hills and is located in the Midwest. Shreveport is located in the Northwestern part of Louisiana, known for its lush greenery, meandering Red River, and relatively flat landscape.
Both Indianapolis and Shreveport have good educational institutions. Indianapolis is home to the highly ranked Indiana University-Purdue University Indianapolis (IUPUI), while Shreveport houses the well-regarded Louisiana State University Shreveport. Both cities have numerous quality public and private primary and secondary schools.
Indianapolis has a diverse economy with strong sectors in healthcare, education, and finance. Shreveport, on the other hand, has an economy influenced by the oil industry, the riverboat gambling, and the military through Barksdale Air Force Base. Job growth has been steady in both cities, but Indianapolis offers a wider range of opportunities due to its larger size and more diverse economy.
Biggest Employers
The largest employers in Indianapolis include Indiana University Health, Eli Lilly and Company, and Amazon. In Shreveport, the biggest employers are Barksdale Air Force Base, LSU Health Shreveport, and Willis-Knighton Health System.
There were 1,221 building permits issued in Indianapolis in 2012 (704 more than in 2011) compared to 218 building permits issued in Shreveport in 2012 (75 less than in 2011).
In Indianapolis (Marion County), 60.1% voted for Democrats and 37.9% for Republicans in 2012 Presidential Election. In Shreveport (Caddo Parish), 52.2% voted for Democrats and 47.1% for Republicans.
Elections
Type
Democrats
Republicans
Other
Year
Indianapolis
Shreveport
Indianapolis
Shreveport
Indianapolis
Shreveport
2020
63.7%
52.8%
34.5%
46.0%
1.9%
1.3%
2016
58.2%
50.7%
35.6%
46.5%
6.2%
2.8%
2012
60.1%
52.2%
37.9%
47.1%
2.0%
0.7%
2008
63.8%
51.4%
35.4%
48.3%
0.8%
0.3%
2004
50.6%
48.8%
48.7%
51.2%
0.7%
0.0%
2000
48.0%
49.8%
49.3%
49.1%
2.8%
1.1%
1996
44.6%
79.7%
47.8%
17.8%
7.7%
2.5%
Breakdown of population affiliated with a religious congregation
Type
Adherents
Congregations
Religion
Indianapolis
Shreveport
Indianapolis
Shreveport
CATHOLIC CHURCH
11.1%
5.6%
4.6%
3.2%
SOUTHERN BAPTIST CONVENTION
1.6%
27.7%
5.7%
23.1%
AMERICAN BAPTIST CHURCHES IN THE USA
1.2%
0.0%
3.4%
0.0%
LUTHERAN CHURCH
0.8%
0.1%
1.5%
0.9%
EVANGELICAL LUTHERAN CHURCH IN AMERICA
0.5%
0.2%
1.6%
0.9%
SEVENTH DAY ADVENTIST CHURCH
0.5%
0.6%
1.6%
1.9%
EPISCOPAL CHURCH
0.4%
1.2%
1.1%
1.6%
SALVATION ARMY
0.3%
0.4%
0.3%
0.3%
Weather
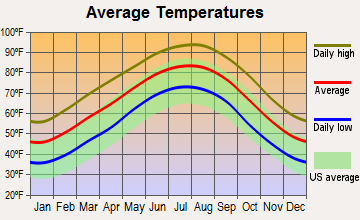
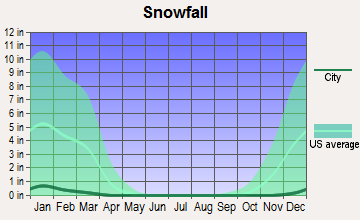
The weather in Indianapolis can be vastly different from Shreveport. Indy experiences all four seasons with cold, often snowy winters and temperate, humid summers. On the other hand, Shreveport has a subtropical climate with mild winters and hot, humid summers.
Weather and climate
Type
Indianapolis
Shreveport
Temperature - Average
52.1°F
65.5°F
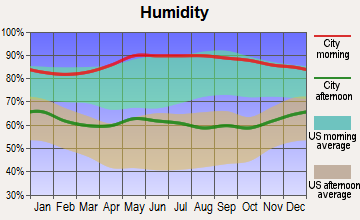
Humidity - Average morning or afternoon humidity
77%
78.3%
Humidity - Differences between morning and afternoon humidity
31%
36%
Humidity - Maximum monthly morning or afternoon humidity
86%
90%
Humidity - Minimum monthly morning or afternoon humidity
55%
54%
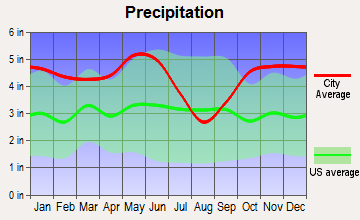
Precipitation - Yearly average
40.6 in
51.8 in
Snowfall - Yearly average
51 in
3 in
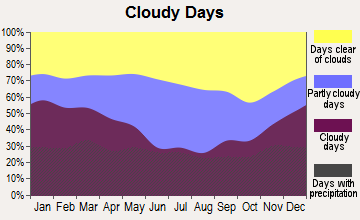
Clouds - Number of days clear of clouds
14.7%
19%
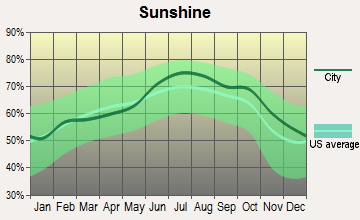
Sunshine amount - Average
56.2%
63.8%
Sunshine amount - Differences during a year
33%
25%
Sunshine amount - Maximum monthly
65%
70%
Sunshine amount - Minimum monthly
32%
45%
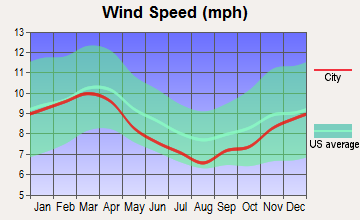
Wind speed - Average
10.3 mph
7.9 mph
Average climate in Indianapolis, Indiana
Average climate in Shreveport, Louisiana
Air pollution
Type
AQI
CO
NO2
OZONE
PB
PM10
PM25
SO2
Year
Indianapolis
Shreveport
Indianapolis
Indianapolis
Indianapolis
Shreveport
Indianapolis
Indianapolis
Shreveport
Indianapolis
Shreveport
Indianapolis
Shreveport
2018
94
64
0.58
N/A
13.2
N/A
23.1
25.7
N/A
N/A
18.2
18.5
10.4
6.5
0.3
0.8
2017
87
69
0.82
N/A
12.4
N/A
23.0
28.0
N/A
N/A
17.6
15.0
10.1
7.2
0.4
0.7
2016
91
66
0.62
N/A
13.0
N/A
22.5
27.4
N/A
N/A
18.0
17.4
9.9
9.0
0.4
1.5
2015
89
70
0.73
N/A
14.9
N/A
22.9
27.5
N/A
N/A
19.7
15.4
9.9
9.3
1.1
1.2
2014
100
69
0.62
N/A
16.1
N/A
25.1
27.1
N/A
N/A
20.6
15.3
12.1
9.8
3.2
1.1
2013
94
71
0.69
N/A
11.5
N/A
26.3
28.1
N/A
N/A
19.9
19.2
12.8
9.5
2.6
1.4
2012
103
72
0.65
N/A
10.4
N/A
25.7
28.7
N/A
N/A
20.8
21.4
12.9
8.5
2.9
N/A
2011
105
90
0.68
N/A
11.3
N/A
22.9
32.1
N/A
N/A
N/A
21.8
16.3
9.2
2.4
N/A
2010
101
88
0.54
N/A
12.7
N/A
21.6
30.5
N/A
N/A
N/A
20.3
15.9
9.2
3.3
N/A
2009
97
75
0.73
N/A
11.4
N/A
23.2
25.6
N/A
N/A
N/A
N/A
13.8
8.7
1.9
2.1
2008
91
72
0.62
N/A
11.5
N/A
N/A
26.1
0.010
N/A
N/A
N/A
13.2
9.5
3.0
2.3
2007
103
86
0.69
N/A
13.1
N/A
N/A
25.9
0.011
N/A
N/A
N/A
14.9
10.7
3.6
2.4
2006
95
91
0.59
N/A
14.5
N/A
N/A
29.7
0.009
N/A
N/A
N/A
14.5
10.9
3.6
2.7
2005
121
90
0.65
N/A
15.2
N/A
N/A
28.5
0.014
N/A
N/A
N/A
18.0
12.4
4.3
2.3
2004
104
81
0.62
N/A
15.8
N/A
N/A
24.7
0.010
N/A
N/A
N/A
15.1
10.3
4.6
2.5
2003
113
91
0.67
N/A
16.6
N/A
N/A
26.5
0.010
N/A
N/A
N/A
15.8
11.9
4.2
2.1
2002
125
80
0.76
N/A
17.4
N/A
N/A
25.8
0.009
N/A
N/A
N/A
16.8
10.0
3.9
1.3
2001
105
99
0.81
N/A
16.6
N/A
N/A
27.4
0.031
N/A
N/A
N/A
16.3
10.2
3.8
1.4
2000
98
98
0.87
N/A
17.3
N/A
N/A
27.9
N/A
N/A
N/A
N/A
N/A
10.7
4.5
1.1
Natural disasters
Type
Indianapolis
Shreveport
Tornado activity compared to U.S. average
226.7%
226.4%
Earthquake activity compared to U.S. average
179.6%
448.8%
Natural disasters compared to U.S. average
16%
18%
Transportation
Getting around Indianapolis is relatively easy, with a well-planned road network and public bus services provided by IndyGo. Shreveport has Sportran as its public transit system, but the city is car-dependent to a large extent. Both cities have international airports for long-distance travel.
Transport
Type
Indianapolis
Shreveport
Amtrak stations
1
1
Amtrak stations nearby
1
2
FAA registered aircraft
739
334
FAA registered aircraft manufacturers and dealers
18
2
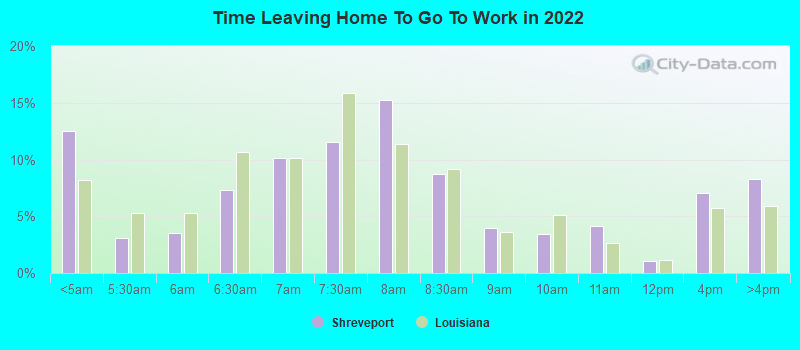
Means of transportation to work
Type
Indianapolis
Shreveport
Bicycle
0.5%
0.1%
Bus
1.2%
1.6%
Carpooled
8.5%
8.8%
Car alone
87.3%
87.4%
Motorcycle
0%
0.2%
Taxicab
0.1%
0.2%
Walked
1.6%
0.7%
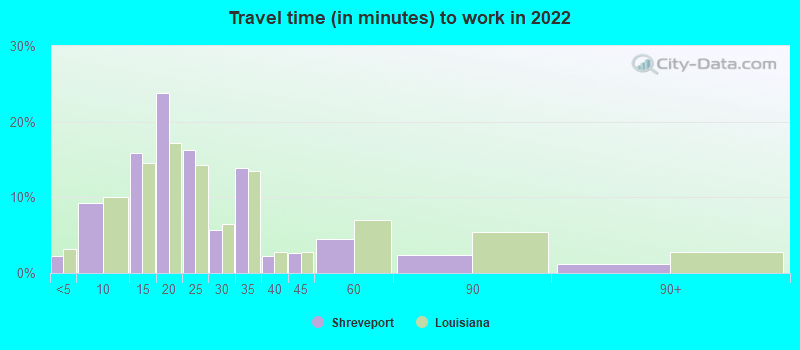
Average travel time to work
Type
Indianapolis
Shreveport
Average
28.1 min
26 min
Other means
22.5 min
19.5 min
Public transportation
40.2 min
40 min
Private vehicle occupancy
Type
Indianapolis
Shreveport
Average
1.2
1.1
Drove alone
88.2%
90.6%
In 2 person carpool
9.4%
7.5%
In 3 person carpool
1.3%
1.4%
In 4 person carpool
0.5%
0.2%
In 5-6 person carpool
0.4%
0.1%
In 7+ person carpool
0.1%
0.3%
How many people usually rode to work in the car, truck or van.
Real Estate
Real estate in Shreveport is generally more affordable than in Indianapolis, with the median home price in Shreveport significantly lower than the national average. Conversely, Indianapolis' housing market is more competitive, with prices above the national average.
Neighborhoods
Both Indianapolis and Shreveport have diverse neighborhoods that cater to a variety of lifestyles. Indianapolis has bustling downtown neighborhoods like Fountain Square while Shreveport boasts charming historical districts like Highland.
Houses and residents
Type
Indianapolis
Shreveport
Houses
399,820
90,211
Average household size (people)
2.4
2.4
Median year apartment built
1977
1975
Median year house/condo built
1971
1972
Length of stay in the house since moving in
13 years
14.7 years
Houses occupied
358,150 (89.6%)
76,167 (84.4%)
Houses occupied by owners
201,149 (56.2%)
40,664 (53.4%)
Houses occupied by renters
157,001 (43.8%)
35,503 (46.6%)
Median rent asked for vacant for-rent units
$876.58
$994.20
Median monthly housing costs
$980
$853
Median price asked for vacant for-sale houses and condos
$283,027
$46,043
Estimated median house or condo value
$188,700
$161,500
Median numbers of rooms
5.5
5.2
Median number of rooms in apartments
4.3
4.3
Median number of rooms in houses and condos
6.5
6.3
Median house price - detached houses
$231,490
$227,450
Median house price - in 2-unit structures
$257,253
$194,383
Median house price - in 3-to-4-unit structures
$240,688
$53,983
Median house price - in 5 or more unit structures
$247,275
$113,344
Median house price - mobile homes
$58,413
$70,748
Median house price - Townhouses or other attached units
$222,424
$167,641
Median house price - All housing units
$229,666
$222,391
Median house age
48
49
Renting percentage
44.2%
44.5%
Housing density (houses/condos per square mile)
1,106.1
874.6
House value disparities
36.1%
41.2%
Household income disparities
44.4%
49.7%
Median household income for houses/condes with a mortgage
$86,008
$74,880
Median household income for apartments without a mortgage
$61,922
$42,467
Housing units without a mortgage
4,552 (3.2%)
355 (1.5%)
Housing units with both a second mortgage and home equity loan
9,787 (6.8%)
677 (2.9%)
Housing units with a mortgage
138,622 (96.8%)
22,643 (98.5%)
Housing units with a home equity loan
271 (0.2%)
217 (0.9%)
Housing units with a second mortgage
12,987 (9.1%)
1,247 (5.4%)
House/condo owner moved in on average (years ago)
11
14
House/condo renter moved in on average (years ago)
1
2
Housing units lacking complete kitchen facilities
3.4%
4.1%
Housing units lacking complete plumbing facilities
1.1%
3.1%
Housing units in structures
Housing units in structures
Indianapolis
Shreveport
One, detached
59.0%
68.7%
One, attached
9.2%
2.7%
Two
2.5%
2.1%
3 or 4
6.2%
5.8%
5 to 9
7.7%
8.7%
10 to 19
6.3%
4.2%
20 to 49
3.1%
2.9%
50 or more
5.0%
2.9%
Mobile homes
1.0%
2.1%
Median real estate property taxes paid for housing units
Self-employed workers in own not incorporated business
17,131
2,951
State government workers
15,502
5,454
Unpaid family workers
1,601
126
Industries and Occupations
In Indianapolis, the healthcare, education, and finance sectors dominate. In Shreveport, the oil industry, gambling, and military are significant industries. The range of occupations in both cities is diverse, with opportunities ranging from blue-collar jobs to white-collar professions.
Indianapolis is renowned for its health care services, with Indiana University Health being one of the top hospital systems in the region. Shreveport is also recognized for health care, primarily due to the presence of Willis-Knighton Health System and the teaching hospital at LSU Health Shreveport.
Health (county statistics)
Type
Indianapolis
Shreveport
General health status score of residents in this county from 1 (poor) to 5 (excellent)
Indianapolis is known for its well-developed infrastructure that includes many interstates and highways. Shreveport also has a decent infrastructure but is smaller in terms of area and population. Both cities have committed to improving infrastructure, focusing on areas such as public transit, sidewalks, and bicycle lanes.
Infrastructure
Type
Indianapolis
Shreveport
Hospitals
76
45
TV stations
19
12
Arenas or stadiums
3
1
Bank branches located here
259
74
Bank institutions located here
27
18
Main business address for public companies
28
1
Drinking water stations with no reported violations in the past
1
1
Drinking water stations with reported violations in the past
HMDA - Conventional home purchase loans - Applications denied
Year
Indianapolis
Shreveport
1999
3,358
622
2000
3,562
651
2001
2,649
693
2002
1,915
398
2003
2,519
374
2004
3,702
441
2005
6,057
726
2006
5,811
822
2007
3,456
465
2008
1,247
203
2009
565
105
Culture and Food
Indianapolis is a huge sports city, home to the Indians, Colts, Pacers, and the world-famous Indy 500 race. It also boasts a thriving culinary scene with a range of international cuisines. Shreveport has a rich cultural scene with jazz music, Mardi Gras parades, and southern cuisine, especially Creole and Cajun dishes.
Sports Teams
Indianapolis is home to major sports teams such as the Indianapolis Colts (NFL), Indiana Pacers (NBA), and Indy Eleven (USL). Shreveport, though it lacks major league sports teams, has minor league teams like the Shreveport Mudbugs (NAHL) and hosts college sports events.


 Indianapolis, IN and
  Shreveport, LA : 660.5 miles