In comparing Jacksonville, Florida (FL) with Birmingham, Alabama (AL), it quickly becomes apparent that these two cities offer distinctly different lifestyle opportunities. Jacksonville is a lively coastal city with diverse employment sectors, multicultural cuisine, and a climate marked by hot summers and mild winters. In contrast, Birmingham is a Southern city with deep historical roots, a strong healthcare sector, and a more varied climate. Each city possesses unique attributes that may appeal to both long-term inhabitants and tourists alike.
Distance between
Jacksonville, FL and
Birmingham, AL : 374.5 miles
Jacksonville's population is larger by 383%. Its population has grown by 218,997 people (29.8%) since 2000. The population of Birmingham has decreased by 45,245 people (18.6%) during that time.
Crime in both Jacksonville and Birmingham is higher than the US average, with property crimes being particularly prevalent. Jacksonville's crime rate is, however, lower than Birmingham. For tourists, it would be advisable to research specific neighborhoods and be aware of your surroundings. Police presence is noticeable in both cities, and there are ongoing initiatives to ensure public safety. Birmingham has implemented several crime-reduction strategies, while Jacksonville has numerous neighborhood watch groups.
Cost of Living
The cost of living in Jacksonville is moderately lower than the national average, with housing being the biggest factor contributing to this. Birmingham also has a relatively low cost of living, with housing, groceries, and transportation costs all below the national average. The lower costs in both cities may be an appealing factor for those considering relocation and for visitors who plan extended stays.
Income Tax
Florida, including Jacksonville, does not impose a state income tax, which can result in significant savings for residents. Alabama does have a state income tax, with rates ranging from 2% to 5%, which would affect potential Birmingham residents.
Property Tax
Jacksonville, FL, has a property tax rate of around 0.94%. Meanwhile, Birmingham, AL has a lower property tax rate at approximately 0.66%. However, overall, Florida has among the lowest property taxes in the United States.
Sales Tax
In Jacksonville, the total sales tax rate is 7.0%, which includes a 6.0% state tax and a local county tax of 1.0%. Birmingham's total sales tax rate is 10%, which includes a 4% state tax, a 4% county tax, and a 2% city tax. These tax rates represent additional living costs for both residents and visitors.
Income
Type
Jacksonville
Birmingham
Estimated median household income
$58,621
$36,614
Estimated per capita income
$32,953
$27,211
Cost of living index (U.S. average is 100)
88.3
87.1
If you make $50,000 in Birmingham, you will have to make $50,689 in Jacksonville to maintain the same standard of living.
Geographical Conditions
Jacksonville is Florida's largest city by area and boasts over 22 miles of beaches, a river running through the city, and numerous parks and green spaces. Birmingham is surrounded by rolling hills and panoramic views, with the Red Mountain offering opportunities for hiking and outdoor activities.
In terms of education, both cities offer a range of public and private schools, including several nationally recognized high schools. Jacksonville's Duval County Public Schools is one of the largest school districts in Florida. For higher education, Jacksonville homes the University of North Florida and Jacksonville University among others. Birmingham is home to the University of Alabama at Birmingham, as well as several smaller colleges and universities.
The work and economy in both cities have shown resilience, despite challenges faced due to economic events like recessions. In Jacksonville, the job market is diverse with opportunities in logistics, finance, healthcare, and the military sector. Jacksonville also commonly attracts remote workers with its high quality of life. Birmingham's economy is driven primarily by the healthcare sector, banking, and construction. Major employers include the University of Alabama at Birmingham and Regions Financial Corporation.
Biggest Employers
In Jacksonville, the biggest employers include Naval Air Station Jacksonville, Duval County Public Schools, City of Jacksonville, and Baptist Health. In Birmingham, the University of Alabama at Birmingham, Regions Financial Corporation, and Children's of Alabama are among the largest employers.
There were 1,310 building permits issued in Jacksonville in 2012 (353 more than in 2011) compared to 90 building permits issued in Birmingham in 2012 (31 less than in 2011).
In Jacksonville (Duval County), 47.9% voted for Democrats and 51.5% for Republicans in 2012 Presidential Election. In Birmingham (Jefferson County), 52.7% voted for Democrats and 46.7% for Republicans.
Elections
Type
Democrats
Republicans
Other
Year
Jacksonville
Birmingham
Jacksonville
Birmingham
Jacksonville
Birmingham
2020
51.3%
55.8%
47.5%
42.6%
1.2%
1.6%
2016
47.2%
51.6%
48.6%
44.3%
4.2%
4.1%
2012
47.9%
52.7%
51.5%
46.7%
0.6%
0.5%
2008
49.0%
52.6%
51.0%
47.4%
0.0%
0.0%
2004
41.7%
45.3%
57.9%
54.3%
0.3%
0.3%
2000
40.9%
47.6%
57.7%
50.8%
1.4%
1.6%
1996
44.2%
46.1%
50.0%
50.2%
5.8%
3.7%
Breakdown of population affiliated with a religious congregation
Type
Adherents
Congregations
Religion
Jacksonville
Birmingham
Jacksonville
Birmingham
SOUTHERN BAPTIST CONVENTION
15.8%
28.2%
22.3%
22.7%
CATHOLIC CHURCH
9.0%
8.4%
2.8%
2.7%
EPISCOPAL CHURCH
1.2%
2.1%
2.3%
1.4%
MUSLIM ESTIMATE
0.7%
0.5%
0.6%
0.6%
SEVENTH DAY ADVENTIST CHURCH
0.3%
0.6%
1.4%
1.2%
PRESBYTERIAN CHURCH IN AMERICA
0.1%
1.4%
0.9%
1.1%
Weather
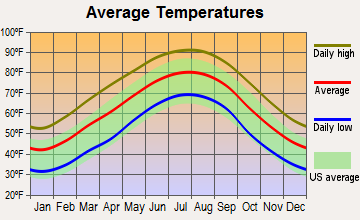
In terms of weather, Jacksonville boasts abundant sunshine with a subtropical climate, including hot summers and mild winters. It can be ideal for those looking to live near the beach and engage in outdoor activities year-round. Birmingham experiences all four seasons with hot summers, cooler winters, spring, and fall. It occasionally faces severe storms, which can result in tornadoes. This climate provides a colorful landscape change throughout the year, which may appeal to those who enjoy seasonal variations.
Weather and climate
Type
Jacksonville
Birmingham
Temperature - Average
68.3°F
62.1°F
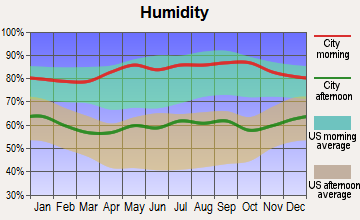
Humidity - Average morning or afternoon humidity
78.4%
75.5%
Humidity - Differences between morning and afternoon humidity
44%
38%
Humidity - Maximum monthly morning or afternoon humidity
92%
88%
Humidity - Minimum monthly morning or afternoon humidity
48%
50%
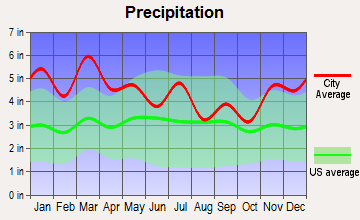
Precipitation - Yearly average
51.8 in
53.2 in
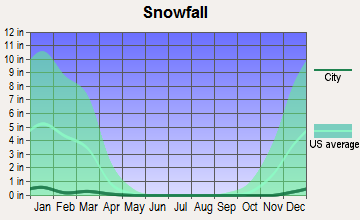
Snowfall - Yearly average
0 in
3.4 in
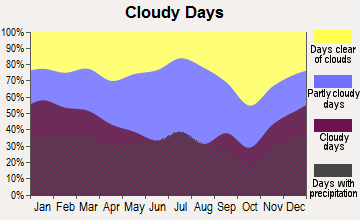
Clouds - Number of days clear of clouds
15.8%
16.4%
Sunshine amount - Average
69.6%
63.4%
Sunshine amount - Differences during a year
16%
21%
Sunshine amount - Maximum monthly
74%
67%
Sunshine amount - Minimum monthly
58%
46%
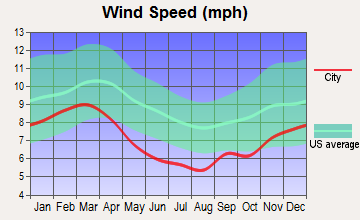
Wind speed - Average
7.2 mph
6.7 mph
Average climate in Jacksonville, Florida
Average climate in Birmingham, Alabama
Air pollution
Type
AQI
CO
NO2
OZONE
PB
PM10
PM25
SO2
Year
Jacksonville
Birmingham
Jacksonville
Birmingham
Birmingham
Jacksonville
Birmingham
Jacksonville
Birmingham
Jacksonville
Birmingham
Jacksonville
Birmingham
2018
78
83
N/A
0.29
9.6
N/A
24.5
26.2
N/A
N/A
18.9
N/A
7.1
10.5
N/A
2.3
2017
74
91
N/A
0.35
10.0
N/A
24.7
24.2
N/A
N/A
18.9
N/A
5.8
11.0
0.7
2.7
2016
65
87
0.50
0.34
12.1
N/A
24.9
27.6
N/A
N/A
19.7
N/A
5.2
10.4
0.4
1.1
2015
63
84
0.35
0.33
10.9
N/A
25.4
24.5
N/A
N/A
19.3
N/A
4.9
10.6
0.3
1.1
2014
66
84
0.27
0.29
11.7
N/A
24.3
24.1
N/A
N/A
21.3
N/A
5.9
11.4
0.7
1.1
2013
68
82
0.18
0.22
N/A
N/A
23.0
21.4
N/A
N/A
19.2
N/A
5.3
10.9
0.7
1.2
2012
66
92
0.10
0.28
N/A
N/A
24.0
24.4
N/A
N/A
21.8
N/A
5.8
11.5
0.6
1.6
2011
88
104
0.28
0.33
N/A
N/A
26.6
24.9
N/A
N/A
24.3
N/A
8.1
13.0
0.8
1.9
2010
77
101
0.31
0.24
N/A
N/A
26.4
24.1
N/A
N/A
25.6
N/A
7.1
12.9
0.8
N/A
2009
72
94
0.16
0.51
N/A
N/A
25.0
21.5
N/A
N/A
25.1
N/A
8.5
12.5
0.6
N/A
2008
75
105
0.15
0.72
N/A
N/A
27.6
23.9
N/A
N/A
32.2
N/A
10.0
15.2
0.9
N/A
2007
92
124
0.29
0.82
N/A
N/A
28.4
24.6
N/A
N/A
41.6
N/A
11.4
17.5
1.2
N/A
2006
87
131
0.35
1.16
N/A
N/A
29.0
24.0
N/A
N/A
33.2
N/A
10.8
18.0
1.4
N/A
2005
93
131
0.42
0.95
N/A
N/A
26.5
21.8
N/A
N/A
38.0
N/A
12.2
18.4
1.8
N/A
2004
92
116
0.40
0.68
N/A
N/A
25.2
19.1
N/A
N/A
39.7
N/A
12.4
17.1
1.4
N/A
2003
55
123
0.43
0.53
N/A
N/A
21.6
18.2
N/A
N/A
42.1
N/A
N/A
16.1
1.6
N/A
2002
59
133
0.49
0.70
N/A
N/A
22.2
21.2
0.003
N/A
37.1
N/A
N/A
17.2
1.7
N/A
2001
74
175
0.49
1.69
N/A
N/A
24.0
19.6
0.009
N/A
32.3
N/A
N/A
N/A
2.5
N/A
2000
85
136
0.52
1.35
N/A
N/A
25.1
23.3
0.017
N/A
38.3
N/A
N/A
N/A
3.0
N/A
Natural disasters
Type
Jacksonville
Birmingham
Tornado activity compared to U.S. average
75.2%
252.3%
Earthquake activity compared to U.S. average
18.1%
229.7%
Natural disasters compared to U.S. average
24%
32%
Transportation
Jacksonville gets around primarily by car, and the city has an extensive highway system. However, public transit options exist, including buses and a skyway monorail system. Birmingham also relies primarily on cars for commuting, with Interstate highways crisscrossing the area. Public transit includes the BJCTA bus system and a newly built intermodal facility catering to Amtrak and Greyhound passengers.
Transport
Type
Jacksonville
Birmingham
Amtrak stations
1
1
Amtrak stations nearby
1
1
FAA registered aircraft
566
358
FAA registered aircraft manufacturers and dealers
34
4
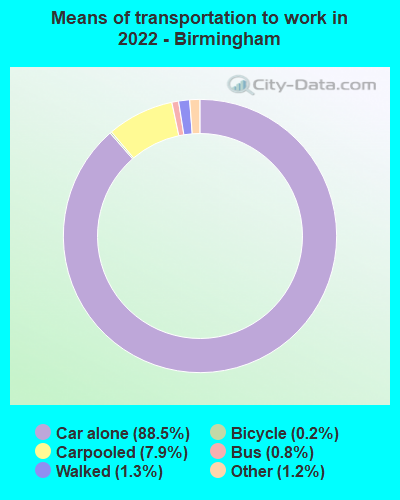
Means of transportation to work
Type
Jacksonville
Birmingham
Bicycle
0.2%
0.2%
Bus
1.1%
0.4%
Carpooled
9%
7.4%
Car alone
86.5%
89.4%
Motorcycle
0.2%
0.1%
Taxicab
0.2%
0.2%
Walked
1.2%
1.1%
Average travel time to work
Type
Jacksonville
Birmingham
Average
27.5 min
29.2 min
Other means
25 min
22.9 min
Public transportation
43.7 min
47 min
Private vehicle occupancy
Type
Jacksonville
Birmingham
Average
1.1
1.2
Drove alone
89.4%
90.6%
In 2 person carpool
8%
7.4%
In 3 person carpool
1.7%
0.5%
In 4 person carpool
0.7%
0.6%
In 5-6 person carpool
0%
0.3%
In 7+ person carpool
0.2%
0.6%
How many people usually rode to work in the car, truck or van.
Real Estate
Real estate in Jacksonville covers a broad range from beachfront properties to downtown condos, suburban homes, and farmhouses within reach of the city. On the other hand, Birmingham's real estate landscape ranges from historic homes to contemporary condos and suburban environments. Both cities offer a wide range of housing options to suit various lifestyles and budgets.
Neighborhoods
Jacksonville's neighborhoods vary greatly, from the cultural hotspots like Riverside and Avondale to beachside communities like Atlantic Beach. In Birmingham, Mountain Brook and Homewood are a couple of the most popular neighborhoods, offering green spaces, great schools, and proximity to downtown.
Houses and residents
Type
Jacksonville
Birmingham
Houses
422,315
108,533
Average household size (people)
2.5
2.3
Median year apartment built
1985
1973
Median year house/condo built
1987
1959
Length of stay in the house since moving in
12.5 years
17.5 years
Houses occupied
386,283 (91.5%)
87,570 (80.7%)
Houses occupied by owners
226,429 (58.6%)
40,665 (46.4%)
Houses occupied by renters
159,854 (41.4%)
46,905 (53.6%)
Median rent asked for vacant for-rent units
$1,444
$620.56
Median monthly housing costs
$1,154
$820
Median price asked for vacant for-sale houses and condos
$260,045
$51,535
Estimated median house or condo value
$239,400
$117,600
Median numbers of rooms
5.6
5.2
Median number of rooms in apartments
4.3
4.5
Median number of rooms in houses and condos
6.3
6.2
Median house price - detached houses
$282,276
$178,184
Median house price - in 2-unit structures
$177,341
$97,076
Median house price - in 3-to-4-unit structures
$144,947
$231,741
Median house price - in 5 or more unit structures
$220,508
$220,662
Median house price - mobile homes
$87,589
$47,467
Median house price - Townhouses or other attached units
$213,709
$189,730
Median house price - All housing units
$266,926
$184,367
Median house age
36
57
Renting percentage
38.3%
50.7%
Housing density (houses/condos per square mile)
557.4
724
House value disparities
33.2%
42.2%
Household income disparities
44.2%
50.2%
Median household income for houses/condes with a mortgage
$83,160
$63,812
Median household income for apartments without a mortgage
$59,777
$42,701
Housing units without a mortgage
2,439 (1.6%)
652 (3.2%)
Housing units with both a second mortgage and home equity loan
8,460 (5.5%)
837 (4%)
Housing units with a mortgage
150,468 (98.4%)
20,029 (96.8%)
Housing units with a home equity loan
255 (0.2%)
0 (0%)
Housing units with a second mortgage
11,378 (7.4%)
1,439 (7%)
House/condo owner moved in on average (years ago)
10
18
House/condo renter moved in on average (years ago)
1
1
Housing units lacking complete kitchen facilities
1.5%
5.3%
Housing units lacking complete plumbing facilities
1.4%
4.4%
Housing units in structures
Housing units in structures
Jacksonville
Birmingham
One, detached
59.4%
59.4%
One, attached
6.1%
2.1%
Two
2.1%
1.8%
3 or 4
5.3%
6.3%
5 to 9
5.0%
9.3%
10 to 19
7.9%
8.0%
20 to 49
4.9%
6.3%
50 or more
5.3%
6.1%
Mobile homes
3.8%
0.7%
Boats, RVs, vans, etc.
0.2%
0.0%
Median real estate property taxes paid for housing units
Self-employed workers in own not incorporated business
19,601
4,375
State government workers
13,692
5,819
Unpaid family workers
1,066
158
Industries and Occupations
Jacksonville's primary industries include transportation and logistics, finance, and healthcare. It boasts a large number of employees in sales, office, and administrative support roles. Birmingham's top industries are healthcare, education, and banking. The city has a strong concentration of workers in management, business, medical, and finance professions.
Both Jacksonville and Birmingham are known for their healthcare facilities. Jacksonville's Mayo Clinic and Baptist Medical Center are amongst the nation's top hospitals. Birmingham's University of Alabama Hospital and Children's of Alabama are also nationally recognized for their healthcare services.
Health (county statistics)
Type
Jacksonville
Birmingham
General health status score of residents in this county from 1 (poor) to 5 (excellent)
Jacksonville's city planning focuses on expanding and improving its transportation, utility systems, and public buildings. Its strategic coastal location serves as a significant advantage in attracting industrial development. Birmingham is known for its historic downtown area and has seen a resurgence of development. Its infrastructure includes well-developed utilities, public transportation, and improving roadways and bridges.
Infrastructure
Type
Jacksonville
Birmingham
Hospitals
25
34
TV stations
17
17
Arenas or stadiums
2
5
Bank branches located here
191
124
Bank institutions located here
31
24
Main business address for public companies
23
31
Drinking water stations with no reported violations in the past
20
0
Drinking water stations with reported violations in the past
HMDA - Conventional home purchase loans - Applications denied
Year
Jacksonville
Birmingham
1999
5,422
834
2000
4,132
835
2001
3,038
699
2002
2,017
548
2003
3,563
670
2004
4,781
928
2005
7,134
1,149
2006
8,812
1,235
2007
5,298
914
2008
1,719
426
2009
676
141
Culture and Food
Jacksonville's vibrant lifestyle includes various cultural and food festivals featuring international cuisines, seafood, and southern cooking. The city has historic areas, museums, galleries, and a thriving music scene. Birmingham also offers a rich culture and food scene, with deep Southern roots, soul food, and BBQ, along with festivals celebrating the city's heritage and diversity.
Sports Teams
Jacksonville is home to the Jacksonville Jaguars of the NFL. Additionally, it hosts major golf tournaments and showcases many other sports like baseball, soccer, and rugby. Birmingham does not have a major professional sports team but hosts many collegiate sports events, including the annual Magic City Classic football game and the SEC Baseball Tournament.


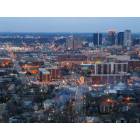


 Jacksonville, FL
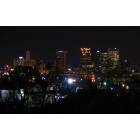
 Birmingham, AL