Las Vegas and Lancaster offer dramatically different living experiences, shaped by their geographical locations, economic statuses, and distinctive cultures. Las Vegas, most famous for its robust entertainment and tourism industry, contrasts Lancaster's quieter, more residential environment. While some aspects like living costs or education might offer close comparisons, factors like healthcare, work and economy, and culture/food reveal clear distinctions. This guide will provide an in-depth analysis of each facet.
Distance between
Las Vegas, NV and
Lancaster, CA : 195.1 miles
Las Vegas's population is larger by 280%. Its population has grown by 168,356 people (35.2%) since 2000. The population of Lancaster has grown by 51,432 people (43.3%) during that time.
Las Vegas reports a higher crime rate than Lancaster. However, it is crucial to remember that a significant portion of these incidents occur on the Las Vegas Strip, predominantly affecting the vast tourist population rather than residents. On the other hand, Lancaster's crime rate is slightly below the national average, making it a fairly safe place to reside, especially for families. Despite the differences, both cities consistently invest in improving safety and reducing crime.
City-data.com crime index counts serious crimes and violent crime more heavily. It adjusts for the number of visitors and daily workers commuting into cities. (higher means more crime, U.S. average = 301.1)
City-data.com crime index counts serious crimes and violent crime more heavily. It adjusts for the number of visitors and daily workers commuting into cities. (higher means more crime, U.S. average = 301.1)
Sex Offenders
According to our data, there are 4,783 registered sex offenders living in Las Vegas and 454 registered sex offenders living in . The ratio of residents to sex offenders in Las Vegas is 132 to 1; the ratio in Lancaster is 353 to 1. The number of registered sex offenders compared to the number of residents is much larger in Las Vegas than that in Lancaster.
Cost of Living
The cost of living is relatively lower in Lancaster compared to Las Vegas, particularly regarding housing. Overall, Lancaster offers a more cost-effective lifestyle. In contrast, the cost of living in Las Vegas may be higher due to entertainment, dining, and housing expenses, especially in areas closer to the city center.
Income Tax
Another key difference lies in the city/state income tax. Nevada, hence Las Vegas, has no state income tax. California, however, imposes a state income tax, which applies to Lancaster residents.
Property Tax
Property tax rates are reasonably similar in both cities. However, due to the higher average cost of homes in Las Vegas, homeowners may end up paying slightly more in property taxes.
Sales Tax
Nevada's sales tax is higher, at 8.23% (Las Vegas), compared to California's 7.25% (Lancaster). This difference is due in part to Nevada's lack of state income tax, which we will discuss next.
Income
Type
Las Vegas
Lancaster
Estimated median household income
$59,746
$64,242
Estimated per capita income
$33,825
$26,470
Cost of living index (U.S. average is 100)
99.1
129.8
If you make $50,000 in Las Vegas, you will have to make $65,489 in Lancaster to maintain the same standard of living.
Geographical Conditions
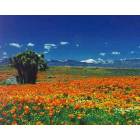
Geographically, Las Vegas is set in a basin within the Mojave Desert and surrounded by mountain ranges. Lancaster, in contrast, is located in the Antelope Valley, with significant desert area and proximity to several natural parks and mountains.
The Clark County School District, serving Las Vegas, is one of the largest in the U.S, offering diverse educational programs. Meanwhile, Lancaster mainly has public schools governed by the Antelope Valley Union High School District, focused on providing quality education on a smaller scale. Both cities have community colleges and near universities for higher education.
Las Vegas's economy heavily leans on entertainment, tourism, and gaming industries. While the city deals with job fluctuations depending on tourism trends, generally, it boasts strong employment. Lancaster's economy is more diversified, with significant contributions from the aerospace industry, retail, and healthcare fields.
Biggest Employers
MGM Resorts International and Caesars Entertainment are among the largest employers in Las Vegas, indicative of the city's robust hospitality industry. For Lancaster, the Antelope Valley Union High School District and Antelope Valley Hospital are significant employers, alongside the aeronautical sector.
There were 2,700 building permits issued in Las Vegas in 2012 (1886 more than in 2011) compared to 263 building permits issued in Lancaster in 2012 (88 more than in 2011).
In Las Vegas (Clark County), 56.4% voted for Democrats and 41.8% for Republicans in 2012 Presidential Election. In Lancaster (Los Angeles County), 69.7% voted for Democrats and 27.8% for Republicans.
Elections
Type
Democrats
Republicans
Other
Year
Las Vegas
Lancaster
Las Vegas
Lancaster
Las Vegas
Lancaster
2020
53.7%
71.0%
44.3%
26.9%
2.0%
2.1%
2016
52.4%
72.0%
41.7%
22.5%
5.8%
5.5%
2012
56.4%
69.7%
41.8%
27.8%
1.8%
2.4%
2008
58.5%
69.2%
39.5%
28.8%
2.0%
1.9%
2004
51.8%
63.3%
46.9%
35.7%
1.3%
1.0%
2000
51.4%
63.6%
44.8%
32.4%
3.8%
4.0%
1996
75.5%
59.3%
18.8%
31.0%
5.7%
9.7%
Breakdown of population affiliated with a religious congregation
Type
Adherents
Congregations
Religion
Las Vegas
Lancaster
Las Vegas
Lancaster
CATHOLIC CHURCH
18.1%
36.1%
4.0%
4.7%
SOUTHERN BAPTIST CONVENTION
1.6%
1.0%
11.2%
9.0%
EVANGELICAL LUTHERAN CHURCH IN AMERICA
0.4%
0.2%
1.6%
1.9%
AMERICAN BAPTIST CHURCHES IN THE USA
0.2%
0.5%
1.4%
3.1%
SEVENTH DAY ADVENTIST CHURCH
0.2%
0.5%
1.6%
2.4%
EPISCOPAL CHURCH
0.1%
0.4%
1.1%
1.4%
MUSLIM ESTIMATE
0.1%
0.7%
0.6%
1.0%
Weather
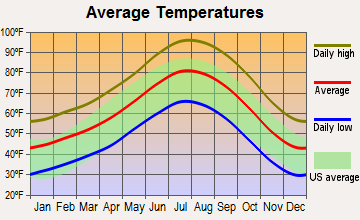
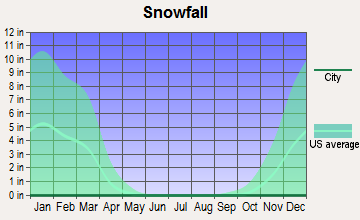
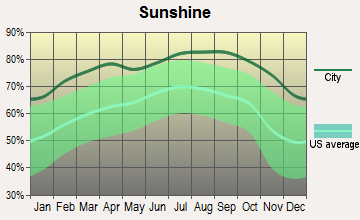
Weather-wise, both cities are located in desert regions and experience similar climates - hot, dry summers and mild, cooler winters. However, being at a higher elevation, Lancaster tends to be colder than Las Vegas in winter. Las Vegas, due to its location in the Mojave Desert, sees a lot more sunshine throughout the year.
Weather and climate
Type
Las Vegas
Lancaster
Temperature - Average
65.5°F
61.3°F
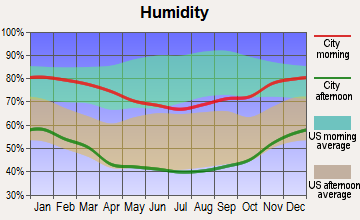
Humidity - Average morning or afternoon humidity
30.7%
61.2%
Humidity - Differences between morning and afternoon humidity
42%
17.6%
Humidity - Maximum monthly morning or afternoon humidity
52%
64.6%
Humidity - Minimum monthly morning or afternoon humidity
10%
47%
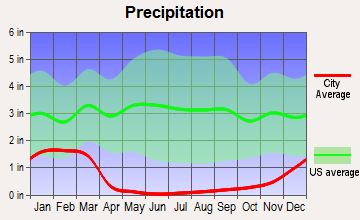
Precipitation - Yearly average
5.7 in
7.5 in
Snowfall - Yearly average
1.6 in
0 in
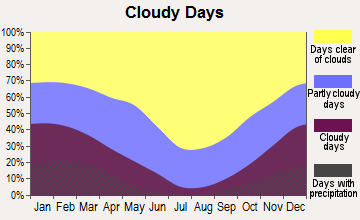
Clouds - Number of days clear of clouds
35.1%
28.8%
Sunshine amount - Average
91.8%
78.4%
Sunshine amount - Differences during a year
16%
21.4%
Sunshine amount - Maximum monthly
92%
84.8%
Sunshine amount - Minimum monthly
76%
63.4%
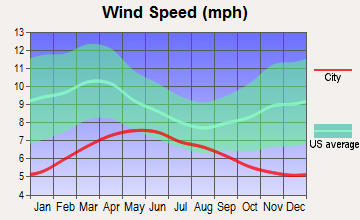
Wind speed - Average
9.2 mph
4.3 mph
Average climate in Las Vegas, Nevada
Average climate in Lancaster, California
Air pollution
Type
AQI
CO
NO2
OZONE
PM10
PM25
SO2
Year
Las Vegas
Lancaster
Las Vegas
Lancaster
Las Vegas
Lancaster
Las Vegas
Lancaster
Las Vegas
Lancaster
Las Vegas
Lancaster
Las Vegas
2018
100
95
0.42
0.21
13.1
8.7
37.2
39.8
24.4
25.4
6.0
7.3
0.7
N/A
2017
101
89
0.29
0.26
13.0
7.8
38.5
38.3
20.3
25.4
7.3
7.4
0.8
N/A
2016
97
91
0.38
0.25
11.2
8.1
36.5
40.2
20.6
25.0
8.7
7.7
0.8
N/A
2015
92
104
0.36
0.27
12.4
6.7
35.6
41.5
18.9
18.4
8.4
N/A
1.2
N/A
2014
91
90
0.40
0.16
10.8
8.2
36.5
38.7
21.1
22.7
9.2
N/A
1.4
N/A
2013
103
96
0.45
0.20
9.6
8.0
36.9
39.4
22.1
22.5
8.6
N/A
1.5
N/A
2012
94
89
0.49
0.28
5.9
8.9
38.5
40.5
21.5
29.5
8.3
N/A
1.4
N/A
2011
85
97
0.40
0.27
5.3
11.7
37.5
41.9
18.2
19.7
7.8
N/A
1.2
N/A
2010
86
93
0.50
0.16
5.7
11.7
36.6
41.8
16.1
19.0
7.1
N/A
N/A
N/A
2009
87
103
0.56
0.15
6.0
12.7
33.3
40.9
20.9
20.6
8.3
N/A
N/A
N/A
2008
82
98
0.66
0.17
8.2
13.2
33.0
37.7
N/A
26.5
9.2
N/A
N/A
N/A
2007
97
97
0.61
0.20
11.7
14.5
32.4
37.5
N/A
23.8
8.6
N/A
0.1
N/A
2006
102
95
0.75
0.24
13.4
14.9
32.7
35.6
N/A
23.6
8.3
N/A
0.8
N/A
2005
100
102
0.76
0.23
15.1
15.4
30.2
36.4
N/A
22.2
7.8
N/A
5.3
N/A
2004
85
109
0.71
0.25
16.0
14.5
30.6
39.1
N/A
24.8
N/A
N/A
1.6
N/A
2003
99
112
0.67
0.27
15.9
15.0
29.8
38.1
N/A
26.4
N/A
N/A
1.0
N/A
2002
94
113
0.73
0.30
15.7
15.7
30.6
38.5
N/A
28.8
N/A
N/A
0.7
N/A
2001
95
103
0.76
0.39
15.0
15.8
29.4
37.8
N/A
25.9
N/A
N/A
1.1
N/A
2000
95
109
0.88
0.52
14.7
15.6
29.7
37.2
N/A
26.6
N/A
N/A
0.4
N/A
Natural disasters
Type
Las Vegas
Lancaster
Tornado activity compared to U.S. average
2.1%
11%
Earthquake activity compared to U.S. average
6,093.4%
7,695.2%
Natural disasters compared to U.S. average
12%
57%
Transportation
Las Vegas offers various public transit options, with a reliable bus service and connectivity to major venues. Lancaster relies on the Antelope Valley Transit Authority for public transportation services. However, most residents prefer driving due to the city's sizable land area.
Transport
Type
Las Vegas
Lancaster
Amtrak stations
1
1
Amtrak stations nearby
1
3
FAA registered aircraft
1
159
FAA registered aircraft manufacturers and dealers
81
0
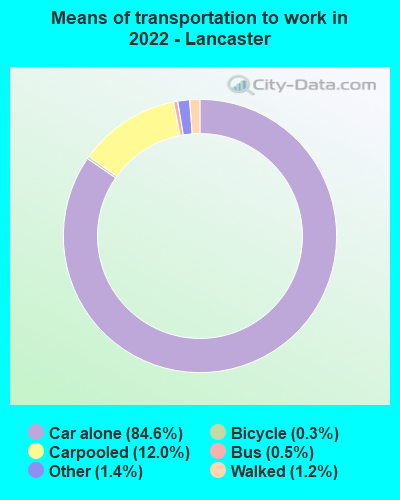
Means of transportation to work
Type
Las Vegas
Lancaster
Bicycle
0.1%
0.3%
Bus
2.2%
0.7%
Carpooled
10.3%
11.6%
Car alone
82.7%
84.9%
Motorcycle
0.4%
0.4%
Railroad
0%
0.5%
Walked
1.4%
1.2%
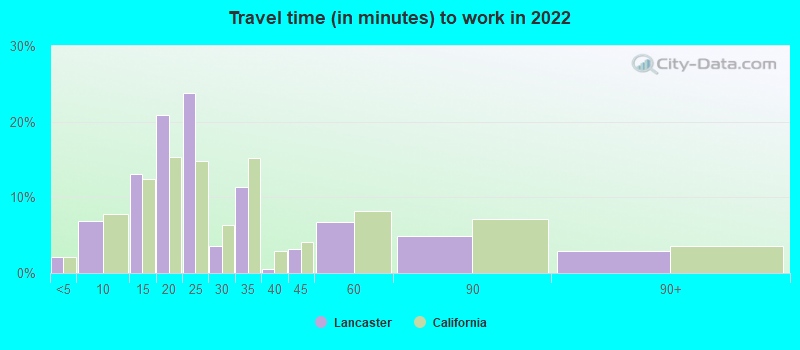
Average travel time to work
Type
Las Vegas
Lancaster
Average
26.3 min
25.9 min
Other means
24 min
31.3 min
Public transportation
49.9 min
54.2 min
Private vehicle occupancy
Type
Las Vegas
Lancaster
Average
1.2
1.2
Drove alone
88.9%
87.9%
In 2 person carpool
8.2%
8.8%
In 3 person carpool
2.1%
1.5%
In 4 person carpool
0.2%
1%
In 5-6 person carpool
0.4%
0.5%
In 7+ person carpool
0.2%
0.2%
How many people usually rode to work in the car, truck or van.
Real Estate
Real estate in Las Vegas is moderate-to-high, depending on location proximity to the Strip. Lancaster's real estate is more affordable, given its residential nature and distance from major city hubs like Los Angeles.
Neighborhoods
Las Vegas neighborhoods are diverse, ranging from high-energy areas near the Strip to quieter, family-friendly suburbs. Lancaster offers family-oriented neighborhoods with a suburban feel, and is closer to natural parks and wilderness.
Houses and residents
Type
Las Vegas
Lancaster
Houses
269,602
53,460
Average household size (people)
2.7
3.2
Median year apartment built
1991
1983
Median year house/condo built
1995
1988
Length of stay in the house since moving in
10.1 years
10.6 years
Houses occupied
250,350 (92.9%)
51,333 (96%)
Houses occupied by owners
138,677 (55.4%)
29,878 (58.2%)
Houses occupied by renters
111,673 (44.6%)
21,455 (41.8%)
Median rent asked for vacant for-rent units
$1,176
$1,086
Median monthly housing costs
$1,255
$1,531
Median price asked for vacant for-sale houses and condos
$989,410
$485,841
Estimated median house or condo value
$362,400
$377,200
Median numbers of rooms
5.2
5.9
Median number of rooms in apartments
4.1
4.5
Median number of rooms in houses and condos
6.1
6.6
Median house price - detached houses
$439,169
$352,592
Median house price - in 3-to-4-unit structures
$201,871
$739,769
Median house price - in 5 or more unit structures
$327,174
$208,950
Median house price - mobile homes
$113,235
$95,691
Median house price - Townhouses or other attached units
$274,961
$391,150
Median house price - All housing units
$417,434
$329,782
Median house age
27
36
Renting percentage
43.5%
39.6%
Housing density (houses/condos per square mile)
2,379.4
568.7
House value disparities
27.1%
28.2%
Household income disparities
47.1%
46.3%
Median household income for houses/condes with a mortgage
$90,388
$95,484
Median household income for apartments without a mortgage
$62,287
$59,553
Housing units without a mortgage
1,172 (1.2%)
0 (0%)
Housing units with both a second mortgage and home equity loan
4,450 (4.6%)
591 (2.8%)
Housing units with a mortgage
95,992 (98.8%)
21,098 (100%)
Housing units with a home equity loan
178 (0.2%)
0 (0%)
Housing units with a second mortgage
5,092 (5.2%)
678 (3.2%)
House/condo owner moved in on average (years ago)
7
9
House/condo renter moved in on average (years ago)
2
4
Housing units lacking complete kitchen facilities
1.3%
1.2%
Housing units lacking complete plumbing facilities
1%
0.1%
Housing units in structures
Housing units in structures
Las Vegas
Lancaster
One, detached
61.5%
70.2%
One, attached
5.3%
1.9%
Two
1.3%
1.3%
3 or 4
7.7%
3.5%
5 to 9
8.4%
7.4%
10 to 19
4.8%
1.5%
20 to 49
2.8%
2.3%
50 or more
6.8%
5.3%
Mobile homes
1.4%
6.5%
Boats, RVs, vans, etc.
0.1%
0.1%
Median real estate property taxes paid for housing units
Self-employed workers in own not incorporated business
18,990
2,428
State government workers
6,950
3,166
Unpaid family workers
614
241
Industries and Occupations
While hospitality, food service, and retail dominate Las Vegas's employment sector, Lancaster boasts a heavy presence of the aerospace industry. Edwards Air Force Base and the NASA Armstrong Flight Research Center offer significant employment opportunities in Lancaster.
Both cities offer reliable healthcare facilities. Las Vegas, given its larger size and population, has more hospitals and specialized healthcare facilities. Lancaster, while smaller, also provides high-quality healthcare through the Antelope Valley Hospital and several other medical centers.
Health (county statistics)
Type
Las Vegas
Lancaster
General health status score of residents in this county from 1 (poor) to 5 (excellent)
Las Vegas is renowned for its vibrant infrastructure, characterized by numerous recreational spots, glowing neon lights, and iconic structures. Lancaster, on the other hand, features more residential and business infrastructures, maintaining a quieter, more conservative cityscape.
Infrastructure
Type
Las Vegas
Lancaster
Hospitals
39
5
TV stations
12
3
Bank branches located here
281
20
Bank institutions located here
34
9
Main business address for public companies
57
1
Drinking water stations with no reported violations in the past
32
7
Drinking water stations with reported violations in the past
HMDA - Conventional home purchase loans - Applications denied
Year
Las Vegas
Lancaster
1999
2,657
440
2000
579
46
2001
371
42
2002
380
53
2003
3,590
844
2004
5,908
1,465
2005
7,894
2,410
2006
6,914
2,897
2007
3,733
1,582
2008
1,431
544
2009
813
239
Culture and Food
Las Vegas’s culture is heavily influenced by entertainment and the hospitality industry, boasting a cosmopolitan culinary scene and a prolific performing arts sector. Lancaster's culture is more traditional, with local festivals, farmer's markets, and a more homely food scene.
Sports Teams
Las Vegas hosts several major sports teams, including the Las Vegas Raiders (NFL), Vegas Golden Knights (NHL), and the Las Vegas Aces (WNBA). Lancaster doesn't have major league sports teams but is home to the Lancaster JetHawks, a Minor League Baseball team.


 Las Vegas, NV
 Lancaster, CA