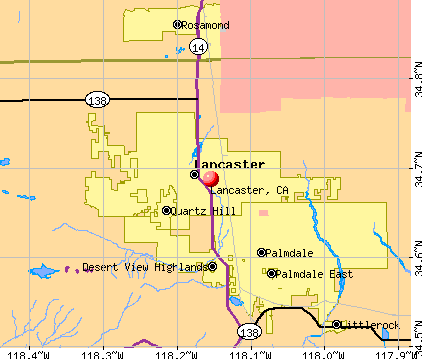
Lancaster, California
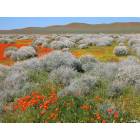
Lancaster: Lancaster poppies
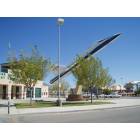
Lancaster: "Go JetHawks Go", Lancaster, CA. October 2007
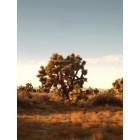
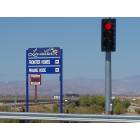
Lancaster: Joshua Tree at Sunset - Lancaster, CA East Side
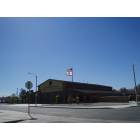
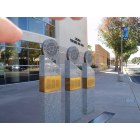
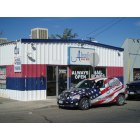
Lancaster: Firefighters home. Lancaster, CA. October 2007
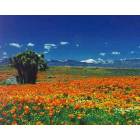
Lancaster: Antelope Valley Poppy Reserve-west Lancaster, California
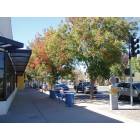
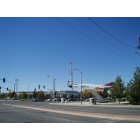
Lancaster: A cold but beautyful day in Lancaster, CA. October 2007
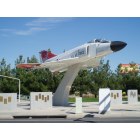
Lancaster: Promised land, Lancaster, CA. October 2007
Lancaster: Lancaster, CA.
Lancaster: Lancaster, CA.
Lancaster: Lancaster, CA. Hopefully we'll never need that service
Lancaster: Lancaster, CA. Hopefully we'll never need that service
- see
40
more - add
your
Submit your own pictures of this city and show them to the world
- OSM Map
- General Map
- Google Map
- MSN Map
Population change since 2000: +42.5%
| Males: 84,387 | |
| Females: 84,798 |
| Median resident age: | 35.5 years |
| California median age: | 37.9 years |
Zip codes: 93534.
| Lancaster: | $79,113 |
| CA: | $91,551 |
Estimated per capita income in 2022: $29,378 (it was $16,935 in 2000)
Lancaster city income, earnings, and wages data
Estimated median house or condo value in 2022: $449,300 (it was $97,800 in 2000)
| Lancaster: | $449,300 |
| CA: | $715,900 |
Mean prices in 2022: all housing units: $388,048; detached houses: $415,799; townhouses or other attached units: $454,998; in 3-to-4-unit structures: $857,607; in 5-or-more-unit structures: $240,542; mobile homes: $115,098; occupied boats, rvs, vans, etc.: $202,689
Median gross rent in 2022: $1,692.
(12.7% for White Non-Hispanic residents, 21.4% for Black residents, 19.2% for Hispanic or Latino residents, 27.0% for American Indian residents, 0.6% for Native Hawaiian and other Pacific Islander residents, 22.7% for other race residents, 10.6% for two or more races residents)
Detailed information about poverty and poor residents in Lancaster, CA


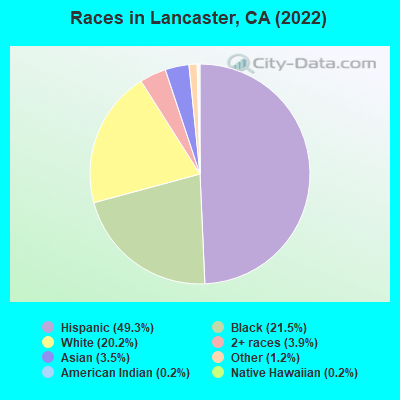
- 83,39849.3%Hispanic
- 36,38721.5%Black alone
- 34,20620.2%White alone
- 6,6413.9%Two or more races
- 5,8723.5%Asian alone
- 2,0361.2%Other race alone
- 3560.2%American Indian alone
- 2960.2%Native Hawaiian and Other
Pacific Islander alone
According to our research of California and other state lists, there were 454 registered sex offenders living in Lancaster, California as of April 27, 2024.
The ratio of all residents to sex offenders in Lancaster is 353 to 1.
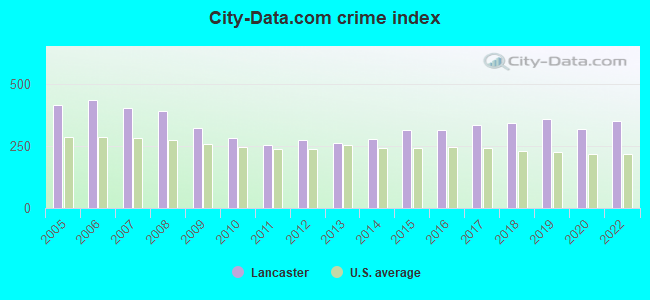
The City-Data.com crime index weighs serious crimes and violent crimes more heavily. Higher means more crime, U.S. average is 246.1. It adjusts for the number of visitors and daily workers commuting into cities.
- means the value is smaller than the state average.- means the value is about the same as the state average.
- means the value is bigger than the state average.
- means the value is much bigger than the state average.
Crime rate in Lancaster detailed stats: murders, rapes, robberies, assaults, burglaries, thefts, arson
Full-time law enforcement employees in 2015, including police officers: 1 (1 officers - 1 male; 0 female).
| Officers per 1,000 residents here: | 0.01 |
| California average: | 1.98 |
 Recent articles from our blog. Our writers, many of them Ph.D. graduates or candidates, create easy-to-read articles on a wide variety of topics.

 | Palmdale and Lancaster? Looking to Buy Land-Is it safe? (32 replies) |
| Lancaster Ca. (25 replies) |
| New to Edwards CA (45 replies) |
| "He wouldn't hurt a fly." Criminal murders Sheriff sergeant in Lancaster (31 replies) |
| Possibly moving to Palmdale (45 replies) |
| Inland Empire areas to avoid? (24 replies) |
Latest news from Lancaster, CA collected exclusively by city-data.com from local newspapers, TV, and radio stations
Ancestries: American (2.5%), German (2.1%), Italian (1.8%), English (1.8%), Irish (1.3%), African (1.3%).
Current Local Time: PST time zone
Elevation: 2355 feet
Land area: 94.0 square miles.
Population density: 1,800 people per square mile (low).
22,202 residents are foreign born (8.8% Latin America, 3.1% Asia).
| This city: | 13.2% |
| California: | 26.5% |
Median real estate property taxes paid for housing units with mortgages in 2022: $3,931 (0.8%)
Median real estate property taxes paid for housing units with no mortgage in 2022: $3,272 (0.9%)
Nearest city with pop. 200,000+: Upper San Gabriel Valley, CA (40.6 miles  , pop. 320,969).
Nearest city with pop. 1,000,000+: Los Angeles, CA (43.4 miles , pop. 3,694,820).
Nearest cities:
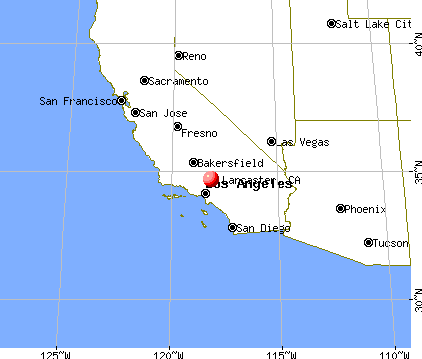
), ), ), ), )Latitude: 34.69 N, Longitude: 118.15 W
Daytime population change due to commuting: -7,162 (-4.2%)
Workers who live and work in this city: 32,524 (49.0%)
Area code: 661
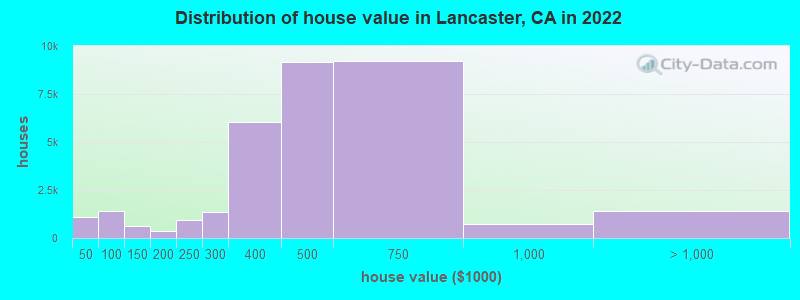
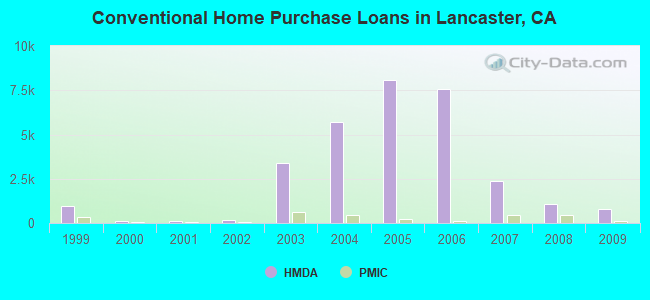
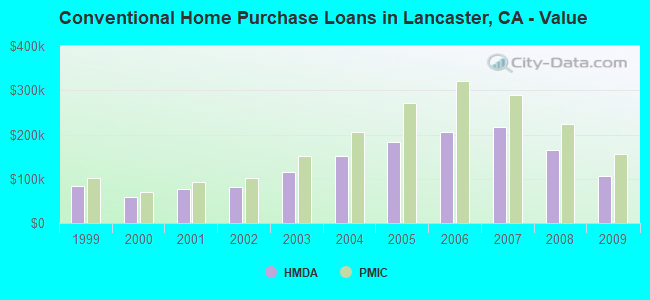
Property values in Lancaster, CA
Detailed articles:
- Lancaster: Introduction
- Lancaster Basic Facts
- Lancaster: Communications
- Lancaster: Convention Facilities
- Lancaster: Economy
- Lancaster: Education and Research
- Lancaster: Geography and Climate
- Lancaster: Health Care
- Lancaster: History
- Lancaster: Municipal Government
- Lancaster: Population Profile
- Lancaster: Recreation
- Lancaster: Transportation
Lancaster, California accommodation & food services, waste management - Economy and Business Data
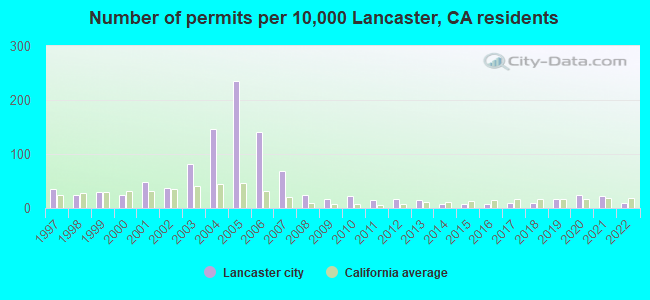
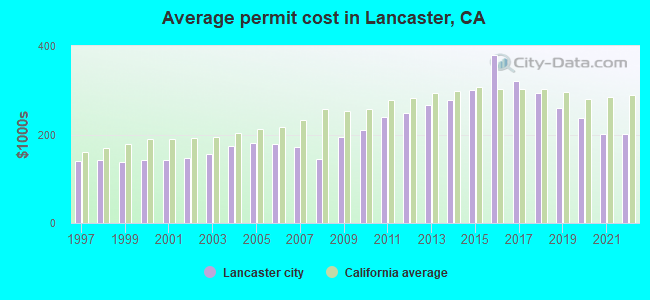
Single-family new house construction building permits:
- 2022: 112 buildings, average cost: $201,200
- 2021: 263 buildings, average cost: $200,500
- 2020: 297 buildings, average cost: $237,200
- 2019: 207 buildings, average cost: $261,400
- 2018: 102 buildings, average cost: $292,500
- 2017: 121 buildings, average cost: $321,100
- 2016: 91 buildings, average cost: $378,600
- 2015: 95 buildings, average cost: $300,400
- 2014: 93 buildings, average cost: $278,100
- 2013: 177 buildings, average cost: $267,400
- 2012: 192 buildings, average cost: $248,700
- 2011: 175 buildings, average cost: $240,400
- 2010: 277 buildings, average cost: $210,400
- 2009: 187 buildings, average cost: $195,200
- 2008: 296 buildings, average cost: $144,700
- 2007: 806 buildings, average cost: $171,600
- 2006: 1663 buildings, average cost: $179,400
- 2005: 2799 buildings, average cost: $181,000
- 2004: 1740 buildings, average cost: $173,800
- 2003: 972 buildings, average cost: $156,900
- 2002: 437 buildings, average cost: $146,300
- 2001: 577 buildings, average cost: $141,500
- 2000: 279 buildings, average cost: $143,000
- 1999: 341 buildings, average cost: $138,400
- 1998: 296 buildings, average cost: $141,500
- 1997: 422 buildings, average cost: $138,800
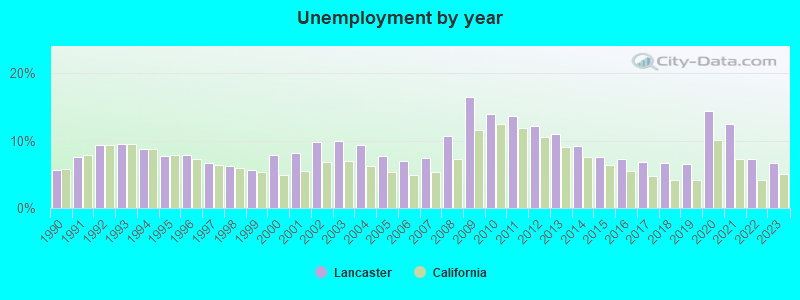
| Here: | 6.7% |
| California: | 5.1% |
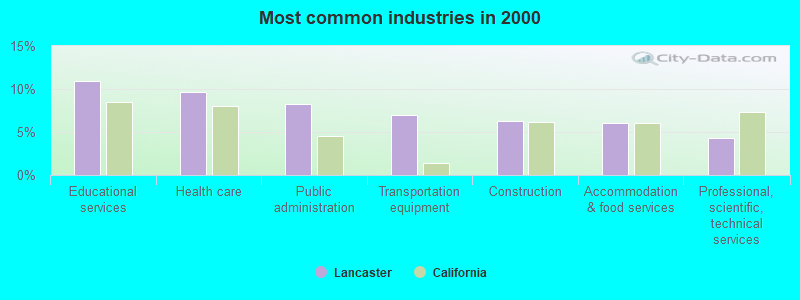
- Educational services (10.9%)
- Health care (9.7%)
- Public administration (8.3%)
- Transportation equipment (7.0%)
- Construction (6.3%)
- Accommodation & food services (6.1%)
- Professional, scientific, technical services (4.3%)
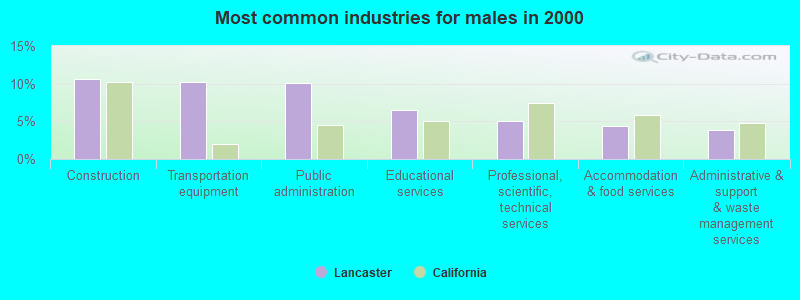
- Construction (10.6%)
- Transportation equipment (10.2%)
- Public administration (10.1%)
- Educational services (6.6%)
- Professional, scientific, technical services (5.0%)
- Accommodation & food services (4.4%)
- Administrative & support & waste management services (3.9%)
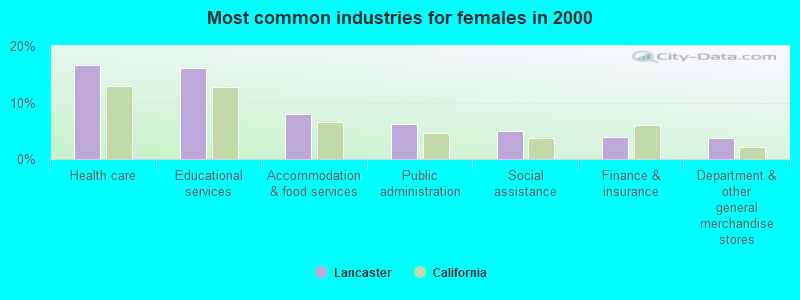
- Health care (16.6%)
- Educational services (16.2%)
- Accommodation & food services (8.0%)
- Public administration (6.1%)
- Social assistance (5.0%)
- Finance & insurance (3.9%)
- Department & other general merchandise stores (3.6%)
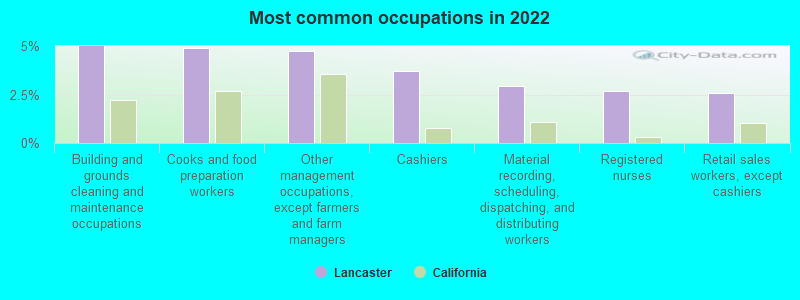
- Building and grounds cleaning and maintenance occupations (5.0%)
- Cooks and food preparation workers (4.9%)
- Other management occupations, except farmers and farm managers (4.8%)
- Cashiers (3.7%)
- Material recording, scheduling, dispatching, and distributing workers (2.9%)
- Registered nurses (2.7%)
- Retail sales workers, except cashiers (2.6%)
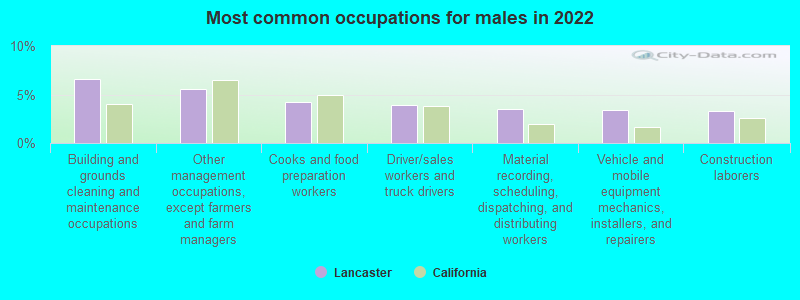
- Building and grounds cleaning and maintenance occupations (6.6%)
- Other management occupations, except farmers and farm managers (5.5%)
- Cooks and food preparation workers (4.2%)
- Driver/sales workers and truck drivers (3.9%)
- Material recording, scheduling, dispatching, and distributing workers (3.5%)
- Vehicle and mobile equipment mechanics, installers, and repairers (3.4%)
- Construction laborers (3.3%)
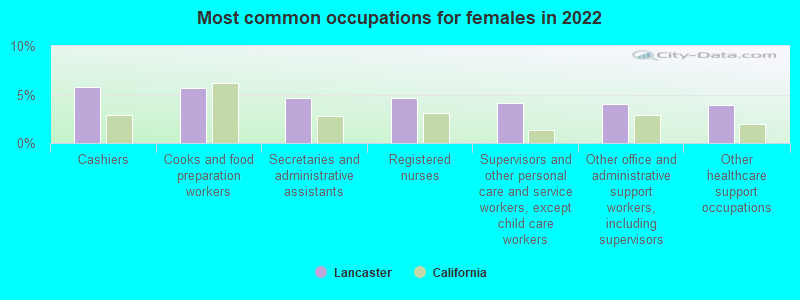
- Cashiers (5.8%)
- Cooks and food preparation workers (5.7%)
- Secretaries and administrative assistants (4.7%)
- Registered nurses (4.6%)
- Supervisors and other personal care and service workers, except child care workers (4.1%)
- Other office and administrative support workers, including supervisors (4.0%)
- Other healthcare support occupations (4.0%)
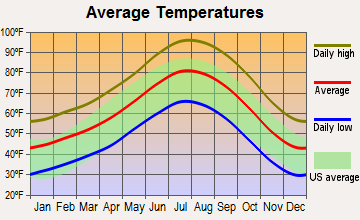
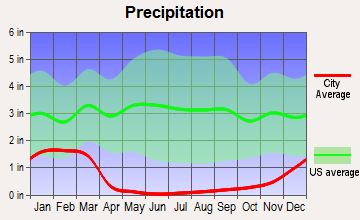
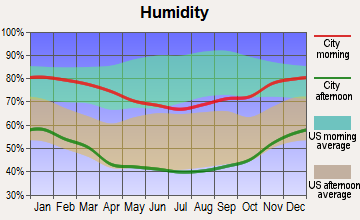
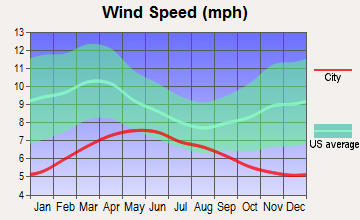
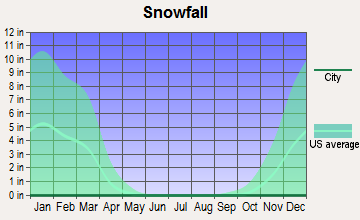
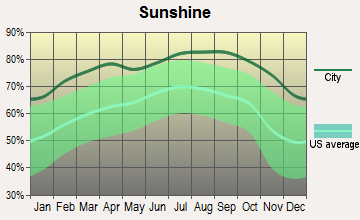
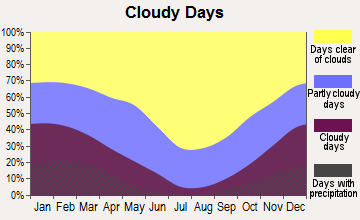
Average climate in Lancaster, California
Based on data reported by over 4,000 weather stations
|
|

(lower is better)
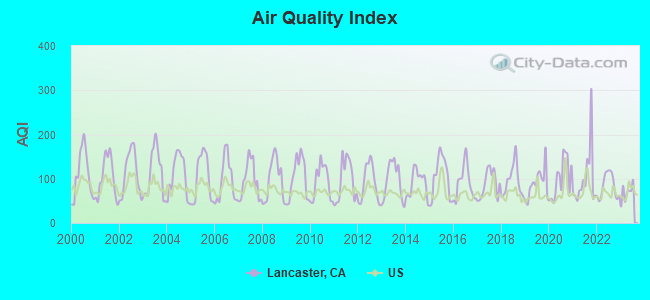
Air Quality Index (AQI) level in 2023 was 68.5. This is about average.
| City: | 68.5 |
| U.S.: | 72.6 |
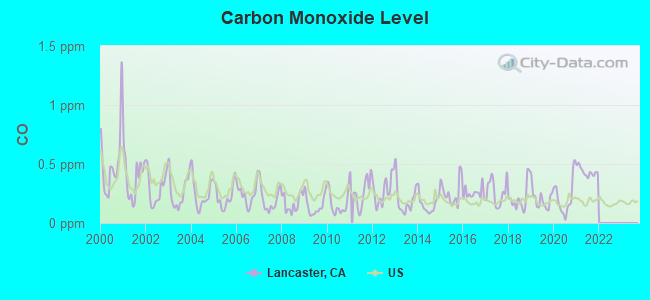
Carbon Monoxide (CO) [ppm] level in 2021 was 0.435. This is significantly worse than average. Closest monitor was 1.2 miles away from the city center.
| City: | 0.435 |
| U.S.: | 0.251 |
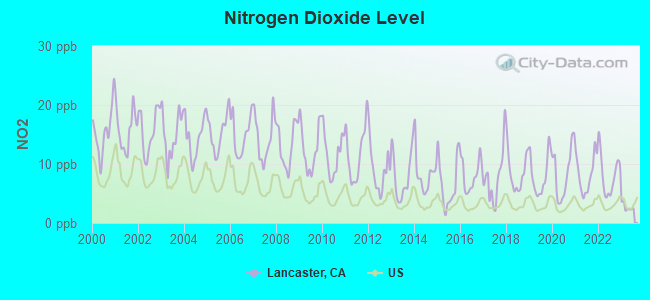
Nitrogen Dioxide (NO2) [ppb] level in 2023 was 2.68. This is significantly better than average. Closest monitor was 1.2 miles away from the city center.
| City: | 2.68 |
| U.S.: | 5.11 |
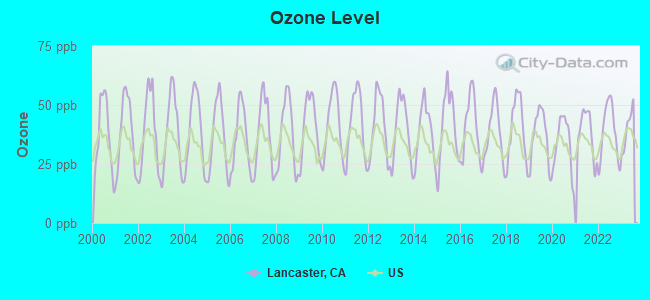
Ozone [ppb] level in 2023 was 40.0. This is worse than average. Closest monitor was 1.2 miles away from the city center.
| City: | 40.0 |
| U.S.: | 33.3 |
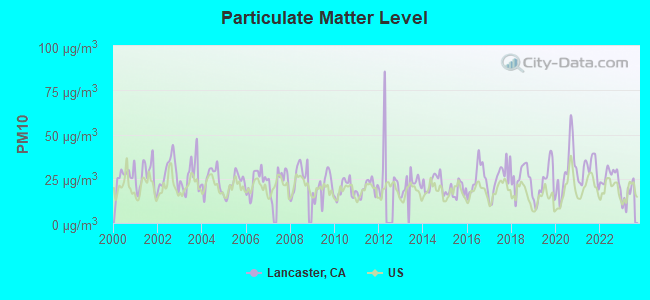
Particulate Matter (PM10) [µg/m3] level in 2023 was 16.0. This is better than average. Closest monitor was 1.2 miles away from the city center.
| City: | 16.0 |
| U.S.: | 19.2 |
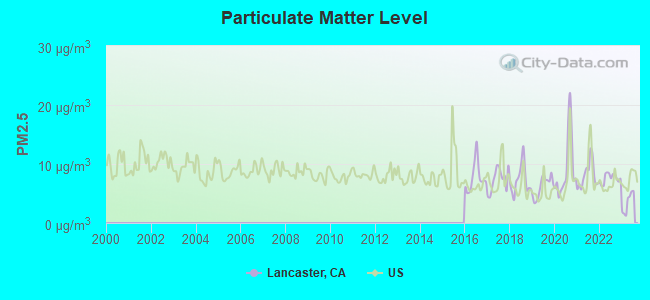
Particulate Matter (PM2.5) [µg/m3] level in 2023 was 3.46. This is significantly better than average. Closest monitor was 1.2 miles away from the city center.
| City: | 3.46 |
| U.S.: | 8.11 |
Earthquake activity:
Lancaster-area historical earthquake activity is significantly above California state average. It is 7595% greater than the overall U.S. average.On 7/21/1952 at 11:52:14, a magnitude 7.7 (7.7 UK, Class: Major, Intensity: VIII - XII) earthquake occurred 52.7 miles away from Lancaster center, causing $50,000,000 total damage
On 6/28/1992 at 11:57:34, a magnitude 7.6 (6.2 MB, 7.6 MS, 7.3 MW, Depth: 0.7 mi) earthquake occurred 98.9 miles away from Lancaster center, causing 3 deaths (1 shaking deaths, 2 other deaths) and 400 injuries, causing $100,000,000 total damage and $40,000,000 insured losses
On 10/16/1999 at 09:46:44, a magnitude 7.4 (6.3 MB, 7.4 MS, 7.2 MW, 7.3 ML) earthquake occurred 98.6 miles away from Lancaster center
On 11/4/1927 at 13:51:53, a magnitude 7.5 (7.5 UK) earthquake occurred 164.2 miles away from the city center
On 1/17/1994 at 12:30:55, a magnitude 6.8 (6.4 MB, 6.8 MS, 6.7 MW, Depth: 11.4 mi, Class: Strong, Intensity: VII - IX) earthquake occurred 43.9 miles away from Lancaster center, causing 60 deaths (60 shaking deaths) and 7000 injuries
On 6/28/1992 at 15:05:30, a magnitude 6.9 (6.3 MB, 6.7 MS, 6.5 MW, 6.9 ME, Depth: 3.1 mi) earthquake occurred 81.0 miles away from Lancaster center
Magnitude types: body-wave magnitude (MB), energy magnitude (ME), local magnitude (ML), surface-wave magnitude (MS), moment magnitude (MW)
Natural disasters:
The number of natural disasters in Los Angeles County (57) is a lot greater than the US average (15).Major Disasters (Presidential) Declared: 27
Emergencies Declared: 3
Causes of natural disasters: Fires: 37, Floods: 16, Storms: 9, Winter Storms: 6, Landslides: 5, Mudslides: 5, Earthquakes: 3, Freeze: 1, Heavy Rain: 1, Hurricane: 1, Snow: 1, Tornado: 1, Wind: 1, Other: 1 (Note: some incidents may be assigned to more than one category).

Main business address for: REXHALL INDUSTRIES INC (MOTOR HOMES).
Hospitals in Lancaster:
- ANTELOPE VALLEY HOSPICE (44325 LOWTREE AVENUE)
- ANTELOPE VALLEY HOSPITAL (Government - Hospital District or Authority, provides emergency services, 1600 W AVE J)
- LAC/HIGH DESERT HOSPITAL (44900 N 60TH ST W)
- PROCARE HOSPICE (42442 NORTH 10TH STREET WEST SUITE E)
- REGIONAL VALLEY SURGERY CENTER (1720 WEST AVENUE J)
Nursing Homes in Lancaster:
- ANTELOPE VALLEY CARE CENTER (44567 NORTH 15TH ST. WEST)
- ANTELOPE VALLEY HEALTHCARE (44445 NO.15TH ST. WEST)
- ANTELOPE VY HOSP MED CTR D P S (1600 WEST AVE J)
- LANCASTER COMMUNITY HOSPITAL D/P SNF (43830 N 10TH ST W)
- LANCASTER HEALTH CARE CENTER (1642 WEST AVENUE J)
- MAYFLOWER GARDENS CONV HOSP (6705 WEST AVENUE M)
Dialysis Facilities in Lancaster:
- ANTELOPE VALLEY KIDNEY INSTITUTE (43932 15TH STREET, SUITE 103)
- DAVITA-ANTELOPE VALLEY DIALYSIS (1759 W. AVENUE J, SUITE 102)
- FMC-ANTELOPE VALLEY (44950 VALLEY CENTRAL WAY, SUITE 108)
Home Health Centers in Lancaster:
Airports and heliports located in Lancaster:
- General Wm J Fox Airfield Airport (WJF) (Runways: 1, Air Taxi Ops: 1,661, Itinerant Ops: 39,000, Local Ops: 40,515, Military Ops: 675)
- Quail Lake Sky Park Airport (CL46) (Runways: 1)
- Bohunk's Airpark Airport (0CL6) (Runways: 1)
- Little Buttes Antique Airfield Airport (1CL1) (Runways: 1)
- Antelope Valley Service Center Heliport (CL40)
- La County Sheriff Lancaster Stn Heliport (21CL)
Colleges/Universities in Lancaster:
- Antelope Valley College (Full-time enrollment: 9,206; Location: 3041 West Ave K; Public; Website: www.avc.edu)
- University of Antelope Valley (Full-time enrollment: 1,063; Location: 44055 Sierra Highway; Private, for-profit; Website: www.uav.edu/index.aspx?page=288; Offers Master's degree)
- Career Care Institute (Full-time enrollment: 593; Location: 43770 Fifteenth St W Ste 115; Private, for-profit; Website: www.ccicolleges.edu)
- Western Beauty Institute (Full-time enrollment: 234; Location: 2733 W Avenue L; Private, for-profit; Website: www.wbi.edu)
- Lancaster Beauty School (Full-time enrollment: 123; Location: 44646 N 10th St W; Private, for-profit; Website: lancasterbeautyschool.com)
- San Joaquin Valley College-Lancaster (Full-time enrollment: 99; Location: 42135 10th Street West; Private, for-profit; Website: www.sjvc.edu/)
Other colleges/universities with over 2000 students near Lancaster:
- Los Angeles Mission College (about 30 miles; Sylmar, CA; Full-time enrollment: 4,825)
- College of the Canyons (about 31 miles; Santa Clarita, CA; FT enrollment: 11,307)
- Art Center College of Design (about 36 miles; Pasadena, CA; FT enrollment: 2,346)
- Glendale Community College (about 37 miles; Glendale, CA; FT enrollment: 11,348)
- Le Cordon Bleu College of Culinary Arts-Pasadena (about 38 miles; Pasadena, CA; FT enrollment: 2,934)
- Pasadena City College (about 38 miles; Pasadena, CA; FT enrollment: 14,712)
- California State University-Northridge (about 38 miles; Northridge, CA; FT enrollment: 28,060)
Biggest public high schools in Lancaster:
- LANCASTER HIGH (Students: 1,892, Location: 44701 32ND ST. W., Grades: 9-12)
- EASTSIDE HIGH (Students: 1,561, Location: 3200 E. AVE. J-8, Grades: 9-12)
- ANTELOPE VALLEY HIGH (Students: 1,092, Location: 44900 N. DIVISION ST., Grades: 9-12)
- DESERT SANDS CHARTER (Students: 825, Location: 44130 20TH ST. W., Grades: 9-12, Charter school)
- SOAR HIGH (STUDENTS ON ACADEMIC RISE) (Students: 207, Location: 3041 W. AVE. K, Grades: 9-12)
- DESERT WINDS CONTINUATION HIGH (Students: 167, Location: 45030 THIRD ST. E., Grades: 9-12)
- MCNAIR CAMP (Location: 5300 WEST AVE. L, Grades: 7-12)
- JARVIS CAMP (Location: 5300 WEST AVE. L, Grades: 7-12)
- SMITH CAMP (Location: 5300 WEST AVE. L, Grades: 7-12)
- RESNIK CAMP (Location: 5300 WEST AVE. L, Grades: 7-12)
Private high schools in Lancaster:
- DESERT CHRISTIAN SCHOOLS (Students: 1,314, Location: 44662 15TH ST W, Grades: PK-12)
- PARACLETE HIGH SCHOOL (Students: 724, Location: 42145 30TH ST W, Grades: 9-12)
- LANCASTER BAPTIST SCHOOL (Students: 398, Location: 4020 E LANCASTER BLVD, Grades: KG-12)
- BETHEL CHRISTIAN SCHOOL (Students: 393, Location: 3100 W AVENUE K, Grades: PK-12)
- ANTELOPE VALLEY CHRISTIAN SCHOOL (Students: 270, Location: 3700 W AVENUE L, Grades: PK-12)
Biggest public elementary/middle schools in Lancaster:
- NEW VISTA MIDDLE (Students: 1,034, Location: 753 E. AVE. K-2, Grades: 6-8)
- AMARGOSA CREEK MIDDLE (Students: 956, Location: 44333 27TH ST., W., Grades: 6-8)
- PIUTE MIDDLE (Students: 944, Location: 425 E. AVE. H-11, Grades: 6-8)
- JOE WALKER MIDDLE (Students: 812, Location: 5632 W. AVE. L-8, Grades: 6-8)
- SUNDOWN ELEMENTARY (Students: 748, Location: 6151 W. AVE. J-8, Grades: KG-6)
- GIFFORD C. COLE MIDDLE (Students: 747, Location: 3126 E. AVE. I, Grades: 7-8)
- DEL SUR SENIOR ELEMENTARY (Students: 684, Location: 9023 W. AVE. H, Grades: KG-8)
- ENDEAVOUR MIDDLE (Students: 676, Location: 43755 45TH ST., W., Grades: 6-8)
- WEST WIND ELEMENTARY (Students: 645, Location: 44044 36TH ST., W., Grades: KG-5)
- VALLEY VIEW ELEMENTARY (Students: 561, Location: 3310 W. AVE. L-8, Grades: KG-8)
Private elementary/middle schools in Lancaster:
- SACRED HEART ELEMENTARY SCHOOL (Students: 313, Location: 625 W KETTERING ST, Grades: KG-8)
- PINECREST SCHOOL - LANCASTER (Students: 242, Location: 2110 W AVENUE K, Grades: PK-8)
- VINEYARD CHRISTIAN SCHOOL (Students: 184, Location: 1011 E AVENUE I, Grades: PK-8)
- GRACE LUTHERAN SCHOOL (Students: 92, Location: 856 W NEWGROVE ST, Grades: PK-8)
- ANTELOPE VALLEY ADVENTIST SCHOOL (Students: 90, Location: 45002 FERN AVE, Grades: KG-8)
- DESERT MONTESSORI ACADEMY (Students: 40, Location: 44503 FERN AVE, Grades: PK-3)
- LANCASTER MONTESSORI SCHOOL (Students: 16, Location: NEW GROVE AVE, Grades: PK-2)
User-submitted facts and corrections:
- Notable location: Antelope Valley Indian Museum, www.avim.parks.ca.gov Avenue M between East 150th & 170th streets, Lancaster
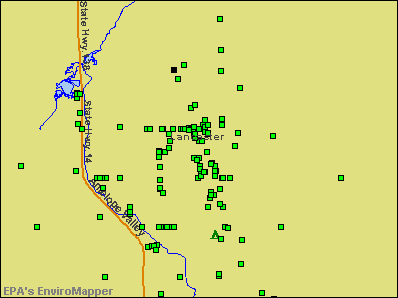
Points of interest:
Notable locations in Lancaster: Cochems Ranch (A), Mira Loma Detention Facility (B), Los Angeles County Animal Shelter Number 5 (C), Challenger Memorial Youth Center (D), Antelope Substation (E), Lancaster Performing Arts Center (F), Lancaster Museum (G), Lancaster City Hall (H), Lancaster Branch County of Los Angeles Public Library (I), Antelope Valley County Administration Center (J), American Medical Response Antelope Valley (K), Antelope Ambulance Service (L), Rescue Services International (M), California State Prison - Los Angeles County Fire Department (N), Los Angeles County Fire Department Station 129 (O), Los Angeles County Fire Department Station 33 (P), Los Angeles County Fire Department Station 135 (Q), Los Angeles County Fire Department Station 134 (R), Los Angeles County Fire Department Station 130 (S), Los Angeles County Fire Department Station 117 (T). Display/hide their locations on the map
Shopping Centers: West Lancaster Plaza Shopping Center (1), Valley Central Shopping Center (2), Lancaster Commerce Center Shopping Center (3), East Lancaster Plaza Shopping Center (4), Antelope Valley Plaza Shopping Center (5), Antelope Valley Center Shopping Center (6). Display/hide their locations on the map
Main business address in Lancaster: REXHALL INDUSTRIES INC (A). Display/hide its location on the map
Churches in Lancaster include: Antelope Valley Christian Center (A), Living Word Fellowship Church (B), Grace Lutheran Church (C), Grace Chapel (D), Growing Valley Baptist Church (E), Our Savior's Lutheran Church (F), Church of Jesus Christ of Latter Day Saints (G), Lancaster Presbyterian Church (H), Sacred Heart Catholic Church (I). Display/hide their locations on the map
Cemeteries: Joshua Memorial Park (1), Lancaster Cemetery (2). Display/hide their locations on the map
Reservoir: Pond Two (A). Display/hide its location on the map
Parks in Lancaster include: Marauder Stadium (1), Mays Field (2), Antelope Valley Fairgrounds (3), Apollo Park (4), Eastside Park (5), El Dorado Park (6), George Lane Park (7), Hull Park (8), Jane Reynolds Park (9). Display/hide their locations on the map
Tourist attractions: California State - Parks & Recreation Dept- High Desert Area Hdqtrs- A V Indian Mu (Museums; 15701 East Avenue M) (1), Antelope Valley Indian Museum (15701 East Avenue M) (2), Allied Arts Cedar Centre (Cultural Attractions- Events- & Facilities; 44845 North Cedar Av) (3), AAA Automobile Club of Southern California - Local Offices- Lancaster (Tours & Charters; 1234 Commerce Center Drive) (4). Display/hide their approximate locations on the map
Hotels: Best Western Antelope Valley I (44055 North Sierra Highway) (1), Aloha Motel (42329 Sierra Highway) (2), Bonaire Motel (42445 Sierra Highway) (3). Display/hide their approximate locations on the map
Courts: Los Angeles County - Juvenile Delinquency- Superior Court Of California-County Of Los Ang (1010 West Avenue J) (1), Los Angeles County - Superior Court Of California-County Of Los Angeles- Lancaster C (42011 4th Street West) (2), Los Angeles County - Civil Management Unit- Sheriff- Court Services Divi (42011 4th Street West) (3), Los Angeles County - Juvenile Dependency- Superior Court Of California-County Of Los Ang (1000 West Avenue J) (4), Social Security Administration - Office Location (44451 20th West) (5), Los Angeles County - Sheriff- Court Services Division- Lancaster Juvenile C (1040 West Avenue J) (6). Display/hide their approximate locations on the map
Birthplace of: Bob Hannah - Motorcycle racer, Chris Gocong - Football player, Kevin Appier - Baseball player, Michael Glenn Williams - Composer, Sean Douglass - 2005 Major League Baseball player (Detroit Tigers, born: Apr 28, 1979), Steve Buechele - Baseball player, Bruce Van Dyke - Football player, Chaz Schilens - Football wide receiver, Christopher Avalos - Boxer, Jonathan Smith - College basketball player (CS Northridge Matadors).
Drinking water stations with addresses in Lancaster and their reported violations in the past:
AVERYDALE MWC (Population served: 1,500, Groundwater):Past health violations:CSP - FORT TEJON (Population served: 156, Groundwater):
- MCL, Monthly (TCR) - In JUN-2005, Contaminant: Coliform. Follow-up actions: St Compliance achieved (MAR-30-2006), St Violation/Reminder Notice (MAR-30-2006)
Past monitoring violations:CSP - TULE ELK (Population served: 103, Groundwater):
- One routine major monitoring violation
Past health violations:AQUA J MUTUAL WATER COMPANY (Population served: 100, Groundwater):
- MCL, Monthly (TCR) - In JUN-2012, Contaminant: Coliform. Follow-up actions: St AO (w/o penalty) issued (JUN-10-2013)
- MCL, Monthly (TCR) - In AUG-2008, Contaminant: Coliform
- MCL, Monthly (TCR) - In JUL-2008, Contaminant: Coliform
- MCL, Monthly (TCR) - In MAY-2005, Contaminant: Coliform. Follow-up actions: St AO (w/o penalty) issued (SEP-12-2005)
- MCL, Monthly (TCR) - In MAR-2005, Contaminant: Coliform. Follow-up actions: St AO (w/o penalty) issued (SEP-12-2005)
Past health violations:BLEICH FLATS MUTUAL (Population served: 93, Groundwater):
- MCL, Monthly (TCR) - In NOV-2011, Contaminant: Coliform. Follow-up actions: St AO (w/o penalty) issued (DEC-08-2011)
Past health violations:DEL SUR GARDENS TRAILER PARK (Population served: 25, Groundwater):
- MCL, Monthly (TCR) - In OCT-2012, Contaminant: Coliform. Follow-up actions: St AO (w/o penalty) issued (NOV-19-2012)
Past health violations:RANCHO SIERRA ACRES (Population served: 25, Groundwater):
- MCL, Monthly (TCR) - In JAN-2012, Contaminant: Coliform. Follow-up actions: St AO (w/o penalty) issued (FEB-28-2012)
Past health violations:Past monitoring violations:
- MCL, Monthly (TCR) - In AUG-2012, Contaminant: Coliform. Follow-up actions: St AO (w/o penalty) issued (NOV-26-2012)
- MCL, Monthly (TCR) - In JUL-2012, Contaminant: Coliform. Follow-up actions: St AO (w/o penalty) issued (NOV-26-2012)
- 2 routine major monitoring violations
Drinking water stations with addresses in Lancaster that have no violations reported:
- CITY OF LANCASTER, SOCCER COMPLEX (Population served: 500, Primary Water Source Type: Groundwater)
- CSP - RED ROCK CANYON (Population served: 408, Primary Water Source Type: Surface water)
- ANTELOPE PARK MUTUAL WATER COMPANY (Population served: 380, Primary Water Source Type: Groundwater)
- CALIFORNIAN MOBILE HOME PARK (Population served: 332, Primary Water Source Type: Groundwater)
- WASTE MANAGEMENT OF LANCASTER (Population served: 49, Primary Water Source Type: Groundwater)
- BAXTER MUTUAL WATER CO. (Population served: 30, Primary Water Source Type: Groundwater)
- PROVIDENCE MTNS SRA (Population served: 25, Primary Water Source Type: Groundwater)
| This city: | 3.2 people |
| California: | 2.9 people |
| This city: | 74.4% |
| Whole state: | 68.7% |
| This city: | 8.0% |
| Whole state: | 7.2% |
Likely homosexual households (counted as self-reported same-sex unmarried-partner households)
- Lesbian couples: 0.5% of all households
- Gay men: 0.3% of all households
People in group quarters in Lancaster in 2010:
- 4,562 people in state prisons
- 1,113 people in federal detention centers
- 714 people in college/university student housing
- 513 people in correctional facilities intended for juveniles
- 486 people in nursing facilities/skilled-nursing facilities
- 292 people in other noninstitutional facilities
- 261 people in group homes intended for adults
- 103 people in workers' group living quarters and job corps centers
- 66 people in residential treatment centers for adults
- 49 people in group homes for juveniles (non-correctional)
- 48 people in emergency and transitional shelters (with sleeping facilities) for people experiencing homelessness
- 22 people in correctional residential facilities
- 22 people in residential treatment centers for juveniles (non-correctional)
- 8 people in local jails and other municipal confinement facilities
People in group quarters in Lancaster in 2000:
- 4,221 people in state prisons
- 749 people in nursing homes
- 713 people in federal prisons and detention centers
- 682 people in training schools for juvenile delinquents
- 290 people in other noninstitutional group quarters
- 138 people in college dormitories (includes college quarters off campus)
- 96 people in homes for the mentally ill
- 37 people in orthopedic wards and institutions for the physically handicapped
- 33 people in homes for the mentally retarded
- 23 people in other nonhousehold living situations
- 21 people in homes or halfway houses for drug/alcohol abuse
- 7 people in other workers' dormitories
- 5 people in other group homes
Banks with most branches in Lancaster (2011 data):
- Wells Fargo Bank, National Association: Century Plaza East Branch, 20th Street West And Avenue K Branch, Quartz Hill Towne Center Branch, Lancaster Branch. Info updated 2011/04/05: Bank assets: $1,161,490.0 mil, Deposits: $905,653.0 mil, headquarters in Sioux Falls, SD, positive income, 6395 total offices, Holding Company: Wells Fargo & Company
- JPMorgan Chase Bank, National Association: Lancaster Office, West 40th & Avenue L Banking Center, 805 W Lancaster Blvd Branch, Lancaster Branch. Info updated 2011/11/10: Bank assets: $1,811,678.0 mil, Deposits: $1,190,738.0 mil, headquarters in Columbus, OH, positive income, International Specialization, 5577 total offices, Holding Company: Jpmorgan Chase & Co.
- Bank of America, National Association: Lancaster Main Branch, Quartz Hill Branch, East Palmdale Branch, 10th And K Branch. Info updated 2009/11/18: Bank assets: $1,451,969.3 mil, Deposits: $1,077,176.8 mil, headquarters in Charlotte, NC, positive income, 5782 total offices, Holding Company: Bank Of America Corporation
- U.S. Bank National Association: East Lancaster Branch, Valley Central Branch, West Lancaster Branch. Info updated 2012/01/30: Bank assets: $330,470.8 mil, Deposits: $236,091.5 mil, headquarters in Cincinnati, OH, positive income, 3121 total offices, Holding Company: U.S. Bancorp
- Union Bank, National Association: Lancaster Branch at 843 West Lancaster Boulevard, branch established on 1990/12/10. Info updated 2011/09/01: Bank assets: $88,967.5 mil, Deposits: $65,286.4 mil, headquarters in San Francisco, CA, positive income, Commercial Lending Specialization, 403 total offices, Holding Company: Mitsubishi Ufj Financial Group, Inc.
- Silvergate Bank: Lancaster Branch at 539 West Lancaster Boulevard, branch established on 1982/05/28. Info updated 2009/12/04: Bank assets: $470.5 mil, Deposits: $282.6 mil, headquarters in La Jolla, CA, positive income, Commercial Lending Specialization, 6 total offices, Holding Company: Silvergate Capital Corporation
- Mojave Desert Bank, National Association: Lancaster Branch at 43830 20th Street West, branch established on 2007/04/25. Info updated 2006/11/03: Bank assets: $105.1 mil, Deposits: $96.0 mil, headquarters in Mojave, CA, negative income in the last year, Commercial Lending Specialization, 5 total offices
- California Bank & Trust: Lancaster at 831 West Lancaster Boulevard, branch established on 1981/02/02. Info updated 2009/07/20: Bank assets: $10,894.1 mil, Deposits: $9,193.9 mil, headquarters in San Diego, CA, positive income, Commercial Lending Specialization, 109 total offices, Holding Company: Zions Bancorporation
- American Security Bank: Lancaster Branch at 42548 Tenth Street West, branch established on 1997/09/02. Info updated 2008/09/12: Bank assets: $424.0 mil, Deposits: $370.1 mil, headquarters in Newport Beach, CA, positive income, Commercial Lending Specialization, 10 total offices, Holding Company: America Bancshares, Inc.
For population 15 years and over in Lancaster:
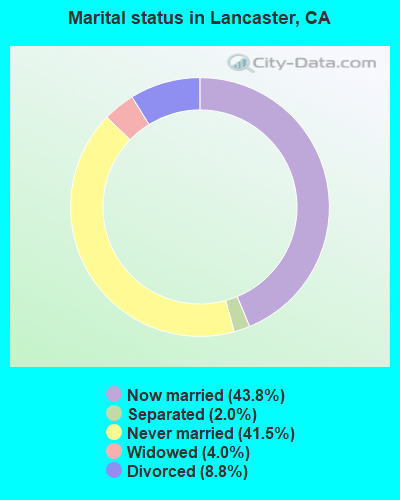
- Never married: 41.5%
- Now married: 43.8%
- Separated: 2.0%
- Widowed: 4.0%
- Divorced: 8.8%
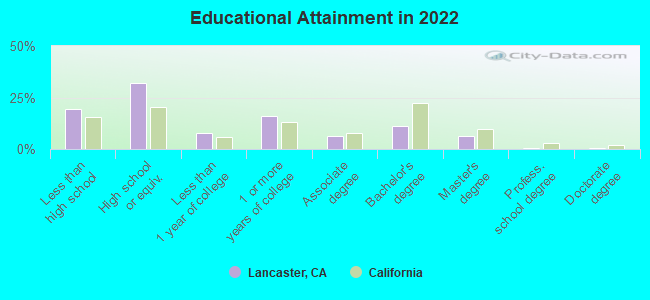
For population 25 years and over in Lancaster:
- High school or higher: 80.8%
- Bachelor's degree or higher: 18.3%
- Graduate or professional degree: 7.3%
- Unemployed: 11.2%
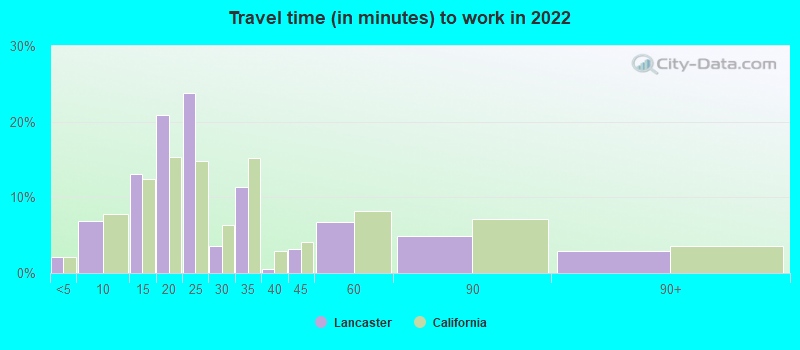
- Mean travel time to work (commute): 29.6 minutes
| Here: | 13.8 |
| California average: | 15.5 |


Graphs represent county-level data. Detailed 2008 Election Results
Religion statistics for Lancaster, CA (based on Los Angeles County data)


| Religion | Adherents | Congregations |
|---|---|---|
| Catholic | 3,542,994 | 275 |
| Evangelical Protestant | 814,611 | 3,249 |
| Other | 451,594 | 1,023 |
| Mainline Protestant | 229,056 | 860 |
| Black Protestant | 112,338 | 290 |
| Orthodox | 63,517 | 76 |
| None | 4,604,495 | - |
Food Environment Statistics:
| Los Angeles County: | 2.12 / 10,000 pop. |
| California: | 2.14 / 10,000 pop. |
| Here: | 0.03 / 10,000 pop. |
| California: | 0.04 / 10,000 pop. |
| Los Angeles County: | 0.58 / 10,000 pop. |
| California: | 0.62 / 10,000 pop. |
| This county: | 1.23 / 10,000 pop. |
| California: | 1.49 / 10,000 pop. |
| Los Angeles County: | 7.15 / 10,000 pop. |
| California: | 7.42 / 10,000 pop. |
| Los Angeles County: | 7.5% |
| State: | 7.3% |
| This county: | 20.4% |
| California: | 21.3% |
| Los Angeles County: | 18.6% |
| California: | 17.9% |
Health and Nutrition:
| This city: | 48.1% |
| California: | 49.4% |
| This city: | 46.1% |
| California: | 48.0% |
| Lancaster: | 28.7 |
| California: | 28.1 |
| This city: | 21.0% |
| California: | 20.2% |
| Lancaster: | 10.8% |
| State: | 11.2% |
| This city: | 6.7 |
| State: | 6.8 |
| Lancaster: | 33.1% |
| California: | 31.5% |
| This city: | 55.6% |
| California: | 56.4% |
| Lancaster: | 80.8% |
| California: | 80.9% |
More about Health and Nutrition of Lancaster, CA Residents
| Local government employment and payroll (March 2022) | |||||
| Function | Full-time employees | Monthly full-time payroll | Average yearly full-time wage | Part-time employees | Monthly part-time payroll |
|---|---|---|---|---|---|
| Streets and Highways | 83 | $651,348 | $94,171 | 1 | $830 |
| Other Government Administration | 55 | $394,030 | $85,970 | 8 | $13,972 |
| Parks and Recreation | 48 | $301,169 | $75,292 | 268 | $295,031 |
| Water Supply | 26 | $165,040 | $76,172 | 0 | $0 |
| Sewerage | 25 | $163,715 | $78,583 | 1 | $1,275 |
| Financial Administration | 24 | $181,321 | $90,661 | 0 | $0 |
| Housing and Community Development (Local) | 24 | $217,585 | $108,793 | 1 | $4,296 |
| Police - Other | 13 | $100,628 | $92,887 | 1 | $2,037 |
| Other and Unallocable | 10 | $99,968 | $119,962 | 2 | $4,349 |
| Judicial and Legal | 1 | $14,194 | $170,328 | 0 | $0 |
| Totals for Government | 309 | $2,288,998 | $88,893 | 282 | $321,791 |
Lancaster government finances - Expenditure in 2017 (per resident):
- Construction - Housing and Community Development: $7,520,000 ($44.45)
Protective Inspection and Regulation - Other: $7,386,000 ($43.66)
Regular Highways: $6,921,000 ($40.91)
Central Staff Services: $6,762,000 ($39.97)
- Current Operations - Electric Utilities: $33,962,000 ($200.74)
Police Protection: $29,684,000 ($175.45)
Regular Highways: $27,808,000 ($164.36)
Central Staff Services: $26,129,000 ($154.44)
Parks and Recreation: $11,985,000 ($70.84)
Housing and Community Development: $7,469,000 ($44.15)
Financial Administration: $4,038,000 ($23.87)
Protective Inspection and Regulation - Other: $3,541,000 ($20.93)
Transit Utilities: $3,250,000 ($19.21)
Health - Other: $529,000 ($3.13)
Water Utilities: $139,000 ($0.82)
- Electric Utilities - Interest on Debt: $1,003,000 ($5.93)
- General - Interest on Debt: $8,807,000 ($52.06)
- Other Capital Outlay - General - Other: $761,000 ($4.50)
Parks and Recreation: $109,000 ($0.64)
Regular Highways: $8,000 ($0.05)
Housing and Community Development: $3,000 ($0.02)
Lancaster government finances - Revenue in 2017 (per resident):
- Charges - Other: $5,534,000 ($32.71)
Regular Highways: $4,467,000 ($26.40)
Parks and Recreation: $3,453,000 ($20.41)
Housing and Community Development: $802,000 ($4.74)
- Federal Intergovernmental - Other: $2,356,000 ($13.93)
Housing and Community Development: $1,166,000 ($6.89)
- Local Intergovernmental - Other: $574,000 ($3.39)
- Miscellaneous - General Revenue - Other: $3,999,000 ($23.64)
Rents: $1,215,000 ($7.18)
Fines and Forfeits: $1,077,000 ($6.37)
Interest Earnings: $289,000 ($1.71)
Donations From Private Sources: $204,000 ($1.21)
- Revenue - Electric Utilities: $38,843,000 ($229.59)
Water Utilities: $117,000 ($0.69)
- State Intergovernmental - Highways: $2,982,000 ($17.63)
Other: $2,579,000 ($15.24)
General Local Government Support: $24,000 ($0.14)
- Tax - Property: $37,757,000 ($223.17)
General Sales and Gross Receipts: $30,502,000 ($180.29)
Other: $9,302,000 ($54.98)
Public Utilities Sales: $2,992,000 ($17.68)
Other Selective Sales: $2,065,000 ($12.21)
Other License: $1,933,000 ($11.43)
Occupation and Business License - Other: $847,000 ($5.01)
Documentary and Stock Transfer: $549,000 ($3.24)
Lancaster government finances - Debt in 2017 (per resident):
- Long Term Debt - Beginning Outstanding - Unspecified Public Purpose: $233,385,000 ($1379.47)
Outstanding Unspecified Public Purpose: $230,801,000 ($1364.19)
Retired Unspecified Public Purpose: $83,040,000 ($490.82)
Issue, Unspecified Public Purpose: $80,455,000 ($475.54)
Beginning Outstanding - Public Debt for Private Purpose: $2,895,000 ($17.11)
Outstanding Nonguaranteed - Industrial Revenue: $2,895,000 ($17.11)
Lancaster government finances - Cash and Securities in 2017 (per resident):
- Bond Funds - Cash and Securities: $2,724,000 ($16.10)
- Other Funds - Cash and Securities: $212,357,000 ($1255.18)
- Sinking Funds - Cash and Securities: $17,999,000 ($106.39)
2.98% of this county's 2021 resident taxpayers lived in other counties in 2020 ($81,235 average adjusted gross income)
| Here: | 2.98% |
| California average: | 5.19% |
0.01% of residents moved from foreign countries ($155 average AGI)
Los Angeles County: 0.01% California average: 0.03%
Top counties from which taxpayers relocated into this county between 2020 and 2021:
| from Orange County, CA | |
| from San Bernardino County, CA | |
| from Riverside County, CA |
4.68% of this county's 2020 resident taxpayers moved to other counties in 2021 ($97,324 average adjusted gross income)
| Here: | 4.68% |
| California average: | 6.14% |
0.01% of residents moved to foreign countries ($196 average AGI)
Los Angeles County: 0.01% California average: 0.02%
Top counties to which taxpayers relocated from this county between 2020 and 2021:
| to Orange County, CA | |
| to San Bernardino County, CA | |
| to Riverside County, CA |
| Businesses in Lancaster, CA | ||||
| Name | Count | Name | Count | |
|---|---|---|---|---|
| 24 Hour Fitness | 2 | Kmart | 1 | |
| 7-Eleven | 4 | Kroger | 2 | |
| 99 Cents Only Stores | 2 | La-Z-Boy | 1 | |
| AT&T | 2 | Lane Furniture | 2 | |
| Albertsons | 1 | LensCrafters | 1 | |
| AutoZone | 2 | Levi Strauss & Co. | 1 | |
| Avenue | 1 | Little Caesars Pizza | 4 | |
| Baskin-Robbins | 2 | Long John Silver's | 2 | |
| Big O Tires | 1 | Lowe's | 1 | |
| Blockbuster | 1 | Marshalls | 1 | |
| Brunswick Bowling & Billiards | 1 | MasterBrand Cabinets | 2 | |
| Budget Car Rental | 1 | Mazda | 1 | |
| Burger King | 3 | McDonald's | 8 | |
| CVS | 5 | Motel 6 | 1 | |
| Carl\s Jr. | 4 | Nike | 2 | |
| Chevrolet | 1 | Panda Express | 4 | |
| Chuck E. Cheese's | 1 | Panera Bread | 1 | |
| Church's Chicken | 1 | Payless | 2 | |
| Circle K | 1 | PetSmart | 1 | |
| Cold Stone Creamery | 1 | Pizza Hut | 3 | |
| Comfort Inn | 1 | Popeyes | 1 | |
| Costco | 1 | RadioShack | 3 | |
| Curves | 2 | Rite Aid | 1 | |
| Decora Cabinetry | 1 | Safeway | 1 | |
| Dennys | 2 | Sears | 2 | |
| Discount Tire | 1 | Sprint Nextel | 1 | |
| Domino's Pizza | 2 | Staples | 1 | |
| El Pollo Loco | 1 | Starbucks | 4 | |
| Famous Footwear | 1 | Subaru | 1 | |
| Fashion Bug | 1 | Subway | 10 | |
| FedEx | 13 | T-Mobile | 4 | |
| Ford | 1 | Taco Bell | 4 | |
| GNC | 2 | Target | 1 | |
| GameStop | 1 | Toyota | 1 | |
| Goodwill | 2 | Toys"R"Us | 1 | |
| H&R Block | 5 | U-Haul | 9 | |
| Holiday Inn | 1 | UPS | 13 | |
| Home Depot | 1 | Vans | 2 | |
| HomeTown Buffet | 1 | Verizon Wireless | 2 | |
| Honda | 1 | Vons | 1 | |
| IHOP | 1 | Walgreens | 4 | |
| Jack In The Box | 4 | Walmart | 2 | |
| Jamba Juice | 1 | Wendy's | 2 | |
| Jones New York | 6 | YMCA | 1 | |
| KFC | 3 | |||
Strongest AM radio stations in Lancaster:
- KAVL (610 AM; 5 kW; LANCASTER, CA; Owner: CITICASTERS LICENSES, L.P.)
- KIRN (670 AM; 35 kW; SIMI VALLEY, CA; Owner: LOTUS OXNARD CORP.)
- KWJL (1380 AM; 1 kW; LANCASTER, CA; Owner: HIGH DESERT BROADCASTING LLC)
- KUTY (1470 AM; 5 kW; PALMDALE, CA; Owner: HIGH DESERT BROADCASTING LLC)
- KLAC (570 AM; 50 kW; LOS ANGELES, CA; Owner: AMFM RADIO LICENSES, L.L.C.)
- KSPN (710 AM; 50 kW; LOS ANGELES, CA; Owner: KABC-AM RADIO, INC.)
- KFWB (980 AM; 50 kW; LOS ANGELES, CA; Owner: INFINITY BROADCASTING OPERATIONS, INC.)
- KDIS (1110 AM; 50 kW; PASADENA, CA; Owner: ABC,INC.)
- KFI (640 AM; 50 kW; LOS ANGELES, CA; Owner: CAPSTAR TX LIMITED PARTNERSHIP)
- KTNQ (1020 AM; 50 kW; LOS ANGELES, CA; Owner: KTNQ-AM LICENSE CORP.)
- KXTA (1150 AM; 50 kW; LOS ANGELES, CA; Owner: CITICASTERS LICENSES, L.P.)
- KMPC (1540 AM; 50 kW; LOS ANGELES, CA; Owner: ROSE CITY RADIO CORPORATION)
- KBLA (1580 AM; 50 kW; SANTA MONICA, CA)
Strongest FM radio stations in Lancaster:
- KTLW (88.9 FM; LANCASTER, CA; Owner: LIFE ON THE WAY COMMUNICATIONS, INC.)
- K202DJ (88.3 FM; PALMDALE, CA; Owner: SANTA MONICA COMMUNITY COLLEGE DIST.)
- KGMX (106.3 FM; LANCASTER, CA; Owner: HIGH DESERT BROADCASTING LLC)
- KCBS-FM (93.1 FM; LOS ANGELES, CA; Owner: INFINITY BROADCASTING OPERATIONS, INC.)
- KSCA (101.9 FM; GLENDALE, CA; Owner: HBC LICENSE CORPORATION)
- K212FA (90.3 FM; TEMPLE CITY, CA; Owner: EDUCATIONAL MEDIA FOUNDATION)
- KLOS (95.5 FM; LOS ANGELES, CA; Owner: KLOS-FM RADIO, INC.)
- KOST (103.5 FM; LOS ANGELES, CA; Owner: CAPSTAR TX LIMITED PARTNERSHIP)
- KLVE (107.5 FM; LOS ANGELES, CA; Owner: KLVE-FM LICENSE CORP.)
- KIIS-FM (102.7 FM; LOS ANGELES, CA; Owner: CITICASTERS LICENSES, L.P.)
- KPCC (89.3 FM; PASADENA, CA; Owner: PASADENA AREA COMMUNITY COLLEGE DISTRICT)
- KHHT (92.3 FM; LOS ANGELES, CA; Owner: AMFM RADIO LICENSES, L.L.C.)
- KMZT-FM (105.1 FM; LOS ANGELES, CA; Owner: MOUNT WILSON FM BROADCASTERS, INC.)
- KBIG-FM (104.3 FM; LOS ANGELES, CA; Owner: AMFM RADIO LICENSES, L.L.C.)
- KPFK (90.7 FM; LOS ANGELES, CA; Owner: PACIFICA FOUNDATION, INC)
- KRTH-FM (101.1 FM; LOS ANGELES, CA; Owner: INFINITY BROADCASTING OPERATIONS, INC.)
- K216EM (91.1 FM; ARCADIA, CA; Owner: LIFE ON THE WAY COMMUNICATIONS, INC.)
- KTWV (94.7 FM; LOS ANGELES, CA; Owner: INFINITY BROADCASTING OPERATIONS, INC.)
- KZLA-FM (93.9 FM; LOS ANGELES, CA; Owner: EMMIS RADIO LICENSE CORPORATION)
- KPWR (105.9 FM; LOS ANGELES, CA; Owner: EMMIS RADIO LICENSE CORPORATION)
TV broadcast stations around Lancaster:
- KTRO-LP (Channel 50; LANCASTER, CA; Owner: ROBERT D. ADELMAN)
- KCBS-TV (Channel 2; LOS ANGELES, CA; Owner: CBS BROADCASTING INC.)
- KHIZ (Channel 64; BARSTOW, CA; Owner: SUNBELT TELEVISION, INC.)
- National Bridge Inventory (NBI) Statistics
- 72Number of bridges
- 732ft / 223mTotal length
- 1,884,683Total average daily traffic
- 85,454Total average daily truck traffic
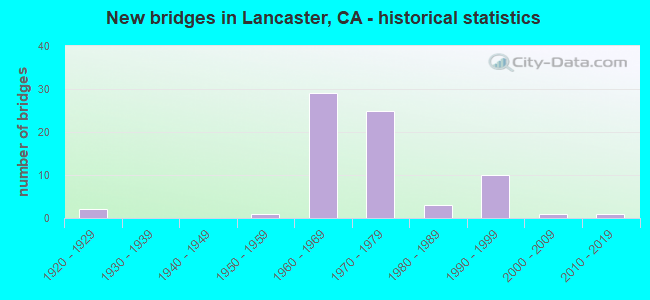
- New bridges - historical statistics
- 21920-1929
- 11950-1959
- 291960-1969
- 251970-1979
- 31980-1989
- 101990-1999
- 12000-2009
- 12010-2019
FCC Registered Antenna Towers: 220 (See the full list of FCC Registered Antenna Towers)
FCC Registered Commercial Land Mobile Towers: 3 (See the full list of FCC Registered Commercial Land Mobile Towers in Lancaster, CA)
FCC Registered Private Land Mobile Towers: 4 (See the full list of FCC Registered Private Land Mobile Towers)
FCC Registered Broadcast Land Mobile Towers: 87 (See the full list of FCC Registered Broadcast Land Mobile Towers)
FCC Registered Microwave Towers: 263 (See the full list of FCC Registered Microwave Towers in this town)
FCC Registered Paging Towers: 2 (See the full list of FCC Registered Paging Towers)
FCC Registered Maritime Coast & Aviation Ground Towers: 12 (See the full list of FCC Registered Maritime Coast & Aviation Ground Towers)
FCC Registered Amateur Radio Licenses: 970 (See the full list of FCC Registered Amateur Radio Licenses in Lancaster)
FAA Registered Aircraft: 159 (See the full list of FAA Registered Aircraft in Lancaster)
| Home Mortgage Disclosure Act Aggregated Statistics For Year 2009 (Based on 21 full and 6 partial tracts) | ||||||||||||||
| A) FHA, FSA/RHS & VA Home Purchase Loans | B) Conventional Home Purchase Loans | C) Refinancings | D) Home Improvement Loans | E) Loans on Dwellings For 5+ Families | F) Non-occupant Loans on < 5 Family Dwellings (A B C & D) | G) Loans On Manufactured Home Dwelling (A B C & D) | ||||||||
|---|---|---|---|---|---|---|---|---|---|---|---|---|---|---|
| Number | Average Value | Number | Average Value | Number | Average Value | Number | Average Value | Number | Average Value | Number | Average Value | Number | Average Value | |
| LOANS ORIGINATED | 1,690 | $153,639 | 800 | $106,758 | 775 | $182,568 | 32 | $79,283 | 4 | $3,522,472 | 489 | $86,453 | 11 | $85,515 |
| APPLICATIONS APPROVED, NOT ACCEPTED | 120 | $139,749 | 115 | $94,910 | 121 | $186,350 | 14 | $25,989 | 0 | $0 | 52 | $88,701 | 23 | $45,250 |
| APPLICATIONS DENIED | 302 | $154,294 | 239 | $109,628 | 612 | $188,154 | 77 | $56,702 | 0 | $0 | 200 | $99,366 | 35 | $55,563 |
| APPLICATIONS WITHDRAWN | 210 | $155,684 | 121 | $115,463 | 334 | $186,864 | 23 | $84,310 | 0 | $0 | 76 | $96,363 | 1 | $109,300 |
| FILES CLOSED FOR INCOMPLETENESS | 49 | $149,605 | 47 | $119,250 | 89 | $201,594 | 6 | $89,242 | 0 | $0 | 23 | $99,574 | 3 | $55,283 |
Detailed mortgage data for all 28 tracts in Lancaster, CA
| Private Mortgage Insurance Companies Aggregated Statistics For Year 2009 (Based on 20 full and 6 partial tracts) | ||||||
| A) Conventional Home Purchase Loans | B) Refinancings | C) Non-occupant Loans on < 5 Family Dwellings (A & B) | ||||
|---|---|---|---|---|---|---|
| Number | Average Value | Number | Average Value | Number | Average Value | |
| LOANS ORIGINATED | 93 | $156,224 | 5 | $183,452 | 0 | $0 |
| APPLICATIONS APPROVED, NOT ACCEPTED | 62 | $190,326 | 14 | $203,284 | 1 | $225,450 |
| APPLICATIONS DENIED | 19 | $132,981 | 4 | $229,870 | 1 | $77,000 |
| APPLICATIONS WITHDRAWN | 13 | $158,721 | 1 | $168,500 | 1 | $56,000 |
| FILES CLOSED FOR INCOMPLETENESS | 12 | $181,167 | 2 | $268,800 | 1 | $187,000 |
2005 - 2018 National Fire Incident Reporting System (NFIRS) incidents
- Fire incident types reported to NFIRS in Lancaster, CA
- 1,86952.2%Outside Fires
- 92525.9%Structure Fires
- 54915.3%Mobile Property/Vehicle Fires
- 2356.6%Other
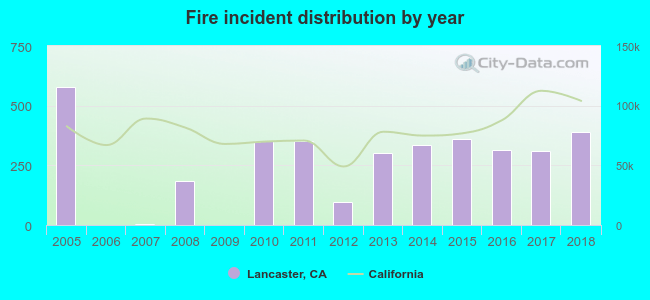 According to the data from the years 2005 - 2018 the average number of fire incidents per year is 256. The highest number of fires - 579 took place in 2005, and the least - 0 in 2006. The data has a decreasing trend.
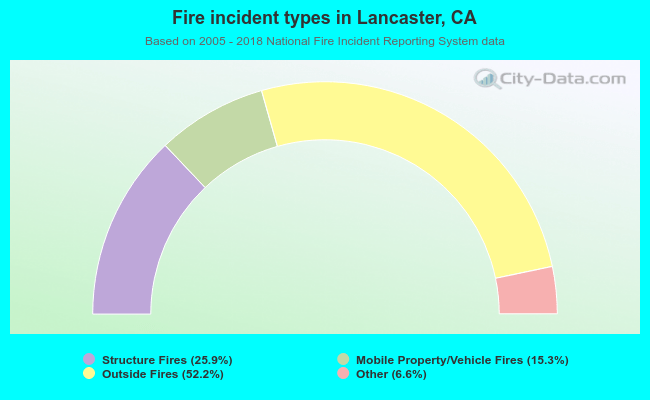 When looking into fire subcategories, the most incidents belonged to: Outside Fires (52.2%), and Structure Fires (25.9%).
Fire-safe hotels and motels in Lancaster, California:
- Best Western Antelope Valley Inn, 44055 N Sierra Hwy, Lancaster, California 93534 , Phone: (661) 948-4651, Fax: (661) 948-4532
- Oxford Inns & Suites, 1651 West Ave K, Lancaster, California 93534 , Phone: (661) 949-3423, Fax: (661) 949-0896
- Essex House Hotel & Convention Center, 44916 N 10TH St W, Lancaster, California 93534 , Phone: (661) 948-0961, Fax: (661) 945-3821
- Motel 6, 43540 17TH St West, Lancaster, California 93534 , Phone: (661) 948-0435, Fax: (661) 940-0657
- Americas Best Value Inn & Suites, 44131 Sierra Hwy, Lancaster, California 93534 , Phone: (661) 945-8771, Fax: (661) 948-3355
- Comfort Inn & Suites, 1825 West Ave J12, Lancaster, California 93534 , Phone: (661) 723-2001, Fax: (661) 723-0292
- Holiday Inn Express Lancaster, 43719 17St, Lancaster, California 93534 , Phone: (661) 951-8848, Fax: (661) 951-8838
- Hampton Inn & Suites Lancaster, 2300 Double Play Way, Lancaster, California 93536 , Phone: (661) 940-9194, Fax: (661) 940-9167
- 4 other hotels and motels
| Most common first names in Lancaster, CA among deceased individuals | ||
| Name | Count | Lived (average) |
|---|---|---|
| John | 508 | 73.3 years |
| William | 478 | 72.9 years |
| Robert | 457 | 70.0 years |
| Mary | 436 | 78.4 years |
| James | 392 | 70.6 years |
| Charles | 308 | 74.3 years |
| George | 260 | 74.0 years |
| Dorothy | 249 | 77.5 years |
| Richard | 219 | 67.4 years |
| Joseph | 218 | 72.8 years |
| Most common last names in Lancaster, CA among deceased individuals | ||
| Last name | Count | Lived (average) |
|---|---|---|
| Smith | 219 | 73.8 years |
| Johnson | 167 | 74.7 years |
| Jones | 157 | 74.3 years |
| Williams | 121 | 71.0 years |
| Brown | 114 | 70.8 years |
| Wilson | 110 | 72.7 years |
| Thompson | 97 | 74.1 years |
| Miller | 96 | 74.7 years |
| Anderson | 90 | 73.7 years |
| Davis | 86 | 73.9 years |
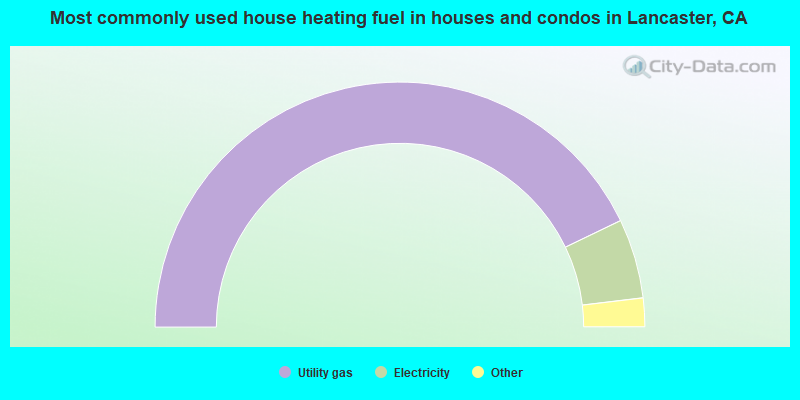
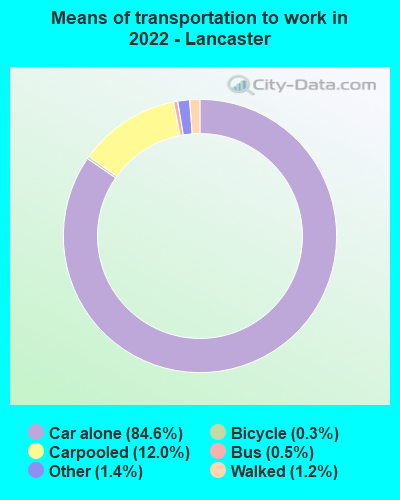
- 85.7%Utility gas
- 10.5%Electricity
- 1.2%Bottled, tank, or LP gas
- 1.0%Solar energy
- 0.7%No fuel used
- 0.5%Wood
- 0.3%Other fuel
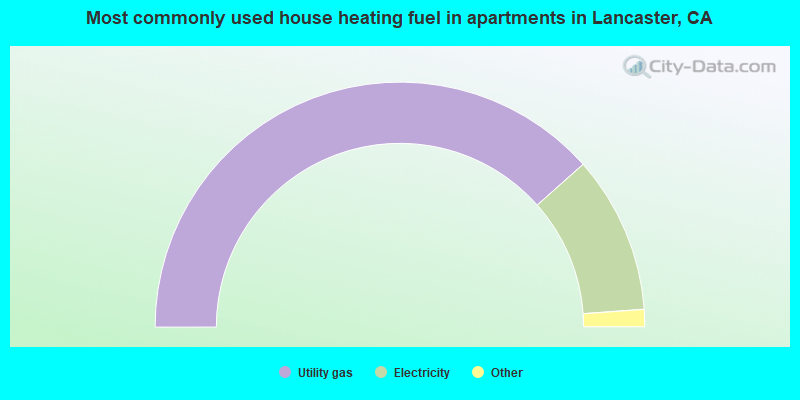
- 76.9%Utility gas
- 20.8%Electricity
- 1.4%Bottled, tank, or LP gas
- 0.5%No fuel used
- 0.3%Solar energy
- 0.1%Wood
Lancaster compared to California state average:
- Median house value below state average.
- Black race population percentage significantly above state average.
- Hispanic race population percentage above state average.
- Length of stay since moving in below state average.
- House age below state average.
- Institutionalized population percentage significantly above state average.
Lancaster, CA compared to other similar cities:
Lancaster on our top lists:
- #8 on the list of "Top 101 cities with largest percentage of males in occupations: community and social service occupations (population 50,000+)"
- #9 on the list of "Top 101 cities with largest percentage of females in occupations: personal care and service occupations (population 50,000+)"
- #20 on the list of "Top 101 cities with the lowest average yearly precipitation (population 50,000+)"
- #38 on the list of "Top 101 cities with largest percentage of females in occupations: construction and extraction occupations (population 50,000+)"
- #41 on the list of "Top 101 cities with largest percentage of males in occupations: construction and extraction occupations (population 50,000+)"
- #43 on the list of "Top 101 cities with largest percentage of females in occupations: community and social service occupations (population 50,000+)"
- #62 on the list of "Top 101 cities with the lowest average snowfall in a year (population 50,000+)"
- #63 on the list of "Top 101 cities with largest percentage of females in industries: other services, except public administration (population 50,000+)"
- #64 on the list of "Top 101 cities with the largest city-data.com crime index decrease from 2002 to 2012 (population 50,000+)"
- #70 on the list of "Top 101 cities with largest percentage of males in industries: construction (population 50,000+)"
- #71 on the list of "Top 101 cities with the largest differences between daily high and daily low temperatures (population 50,000+)"
- #71 on the list of "Top 101 cities with the highest percentage of family households, population 100,000+"
- #75 on the list of "Top 101 cities with the largest percentage of people in federal prisons and detention centers (population 1,000+)"
- #77 on the list of "Top 101 cities with the largest percentage of people in training schools for juvenile delinquents (population 1,000+)"
- #78 on the list of "Top 101 cities with the highest daily high temperatures (population 50,000+)"
- #79 on the list of "Top 100 highest located cities (pop. 50,000+)"
- #83 on the list of "Top 101 cities with the highest number of arson incidents per 100,000 residents, excludes tourist destinations and others with a lot of outsiders visiting based on city industries data (population 50,000+)"
- #83 on the list of "Top 101 cities with the highest average snowfall in a year (population 50,000+)"
- #84 on the list of "Top 101 cities with largest percentage of females in occupations: farming, fishing, and forestry occupations (population 50,000+)"
- #87 on the list of "Top 101 cities with the most residents born in Other Southern Africa (population 500+)"
- #98 (93534) on the list of "Top 101 zip codes with the most offices of physicians in 2005"
- #1 on the list of "Top 101 counties with the most Evangelical Protestant congregations"
- #1 on the list of "Top 101 counties with the most Mainline Protestant congregations"
- #1 on the list of "Top 101 counties with the most Orthodox adherents"
- #1 on the list of "Top 101 counties with the highest ground withdrawal of fresh water for public supply (pop. 50,000+)"
- #1 on the list of "Top 101 counties with the most Catholic adherents (pop. 50,000+)"
State forum archive:
- California Pages: 2 3 4 5 6 7 8 9 10 11 12 13 14 15 16 17 18 19 20 21 22 23 24 25 26 27 28 29 30 31 32 33 34 35 36 37 38 39 40 41 42 43 44 45 46 47 48 49 50 51 52 53 54 55 56 57 58 59 60 61 62 63 64 65 66 67 68 69 70 71 72 73 74 75 76 77 78 79
- Los Angeles Pages: 2 3 4 5 6 7 8 9 10 11 12 13 14 15 16 17 18 19 20 21 22 23 24 25 26 27 28 29 30 31 32 33 34 35 36 37 38 39 40 41 42 43 44 45 46 47 48 49 50 51 52 53 54 55 56 57 58 59 60 61 62 63 64 65 66 67 68 69 70 71 72 73 74 75 76 77 78 79 80 81 82 83 84 85 86 87 88 89 90 91 92 93 94 95 96 97 98 99 100 101 102 103 104 105 106 107 108 109 110 111 112 113 114 115 116 117 118 119 120 121 122 123
- Monterey County Pages: 2 3
- Orange County Pages: 2 3 4 5 6 7 8 9 10 11 12 13 14 15 16 17 18 19 20 21 22 23 24 25 26 27 28 29 30 31 32 33 34 35 36
- Sacramento Pages: 2 3 4 5 6 7 8 9 10 11 12 13 14 15 16 17 18 19 20 21 22 23 24 25 26 27 28 29 30 31 32
- San Bernardino and Riverside Counties Pages: 2 3 4 5 6 7 8 9 10 11 12 13 14 15 16 17 18 19 20 21 22 23
- San Diego Pages: 2 3 4 5 6 7 8 9 10 11 12 13 14 15 16 17 18 19 20 21 22 23 24 25 26 27 28 29 30 31 32 33 34 35 36 37 38 39 40 41 42 43 44 45 46 47 48 49 50 51 52 53 54 55 56 57 58 59 60 61 62 63 64 65 66 67 68 69 70 71 72 73 74 75 76
- San Francisco - Oakland Pages: 2 3 4 5 6 7 8 9 10 11 12 13 14 15 16 17 18 19 20 21 22 23 24 25 26 27 28 29 30 31 32 33 34 35 36 37 38 39 40 41 42 43 44 45 46 47 48 49 50 51 52 53 54 55 56 57 58 59 60 61 62 63 64 65 66 67 68 69 70 71 72
- San Jose Pages: 2 3 4 5 6 7 8 9 10 11 12 13 14 15 16 17 18 19 20 21 22 23 24
- Ventura County Pages: 2 3 4 5 6 7

|
|
Total of 216 patent applications in 2008-2024.