Rosamond, California Submit your own pictures of this place and show them to the world
OSM Map
General Map
Google Map
MSN Map
OSM Map
General Map
Google Map
MSN Map
OSM Map
General Map
Google Map
MSN Map
OSM Map
General Map
Google Map
MSN Map
Please wait while loading the map...
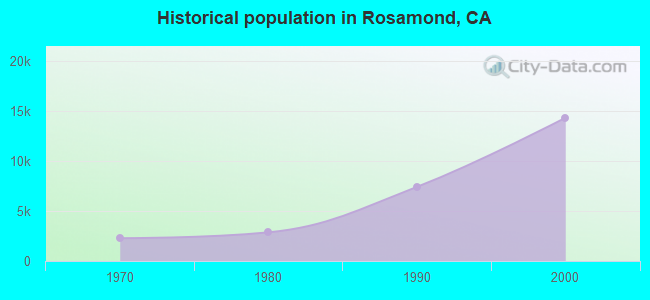
Population in 2010: 18,150. Population change since 2000: +26.5%Males: 9,523 Females: 8,627
March 2022 cost of living index in Rosamond: 91.5 (less than average, U.S. average is 100) Percentage of residents living in poverty in 2022: 14.7%for White Non-Hispanic residents , 34.4% for Black residents , 13.3% for Hispanic or Latino residents , 25.2% for American Indian residents , 6.4% for other race residents , 14.4% for two or more races residents )
Profiles of local businesses
Business Search - 14 Million verified businesses
Data:
Median household income ($)
Median household income (% change since 2000)
Household income diversity
Ratio of average income to average house value (%)
Ratio of average income to average rent
Median household income ($) - White
Median household income ($) - Black or African American
Median household income ($) - Asian
Median household income ($) - Hispanic or Latino
Median household income ($) - American Indian and Alaska Native
Median household income ($) - Multirace
Median household income ($) - Other Race
Median household income for houses/condos with a mortgage ($)
Median household income for apartments without a mortgage ($)
Races - White alone (%)
Races - White alone (% change since 2000)
Races - Black alone (%)
Races - Black alone (% change since 2000)
Races - American Indian alone (%)
Races - American Indian alone (% change since 2000)
Races - Asian alone (%)
Races - Asian alone (% change since 2000)
Races - Hispanic (%)
Races - Hispanic (% change since 2000)
Races - Native Hawaiian and Other Pacific Islander alone (%)
Races - Native Hawaiian and Other Pacific Islander alone (% change since 2000)
Races - Two or more races (%)
Races - Two or more races (% change since 2000)
Races - Other race alone (%)
Races - Other race alone (% change since 2000)
Racial diversity
Unemployment (%)
Unemployment (% change since 2000)
Unemployment (%) - White
Unemployment (%) - Black or African American
Unemployment (%) - Asian
Unemployment (%) - Hispanic or Latino
Unemployment (%) - American Indian and Alaska Native
Unemployment (%) - Multirace
Unemployment (%) - Other Race
Population density (people per square mile)
Population - Males (%)
Population - Females (%)
Population - Males (%) - White
Population - Males (%) - Black or African American
Population - Males (%) - Asian
Population - Males (%) - Hispanic or Latino
Population - Males (%) - American Indian and Alaska Native
Population - Males (%) - Multirace
Population - Males (%) - Other Race
Population - Females (%) - White
Population - Females (%) - Black or African American
Population - Females (%) - Asian
Population - Females (%) - Hispanic or Latino
Population - Females (%) - American Indian and Alaska Native
Population - Females (%) - Multirace
Population - Females (%) - Other Race
Coronavirus confirmed cases (Apr 27, 2024)
Deaths caused by coronavirus (Apr 27, 2024)
Coronavirus confirmed cases (per 100k population) (Apr 27, 2024)
Deaths caused by coronavirus (per 100k population) (Apr 27, 2024)
Daily increase in number of cases (Apr 27, 2024)
Weekly increase in number of cases (Apr 27, 2024)
Cases doubled (in days) (Apr 27, 2024)
Hospitalized patients (Apr 18, 2022)
Negative test results (Apr 18, 2022)
Total test results (Apr 18, 2022)
COVID Vaccine doses distributed (per 100k population) (Sep 19, 2023)
COVID Vaccine doses administered (per 100k population) (Sep 19, 2023)
COVID Vaccine doses distributed (Sep 19, 2023)
COVID Vaccine doses administered (Sep 19, 2023)
Likely homosexual households (%)
Likely homosexual households (% change since 2000)
Likely homosexual households - Lesbian couples (%)
Likely homosexual households - Lesbian couples (% change since 2000)
Likely homosexual households - Gay men (%)
Likely homosexual households - Gay men (% change since 2000)
Cost of living index
Median gross rent ($)
Median contract rent ($)
Median monthly housing costs ($)
Median house or condo value ($)
Median house or condo value ($ change since 2000)
Mean house or condo value by units in structure - 1, detached ($)
Mean house or condo value by units in structure - 1, attached ($)
Mean house or condo value by units in structure - 2 ($)
Mean house or condo value by units in structure by units in structure - 3 or 4 ($)
Mean house or condo value by units in structure - 5 or more ($)
Mean house or condo value by units in structure - Boat, RV, van, etc. ($)
Mean house or condo value by units in structure - Mobile home ($)
Median house or condo value ($) - White
Median house or condo value ($) - Black or African American
Median house or condo value ($) - Asian
Median house or condo value ($) - Hispanic or Latino
Median house or condo value ($) - American Indian and Alaska Native
Median house or condo value ($) - Multirace
Median house or condo value ($) - Other Race
Median resident age
Resident age diversity
Median resident age - Males
Median resident age - Females
Median resident age - White
Median resident age - Black or African American
Median resident age - Asian
Median resident age - Hispanic or Latino
Median resident age - American Indian and Alaska Native
Median resident age - Multirace
Median resident age - Other Race
Median resident age - Males - White
Median resident age - Males - Black or African American
Median resident age - Males - Asian
Median resident age - Males - Hispanic or Latino
Median resident age - Males - American Indian and Alaska Native
Median resident age - Males - Multirace
Median resident age - Males - Other Race
Median resident age - Females - White
Median resident age - Females - Black or African American
Median resident age - Females - Asian
Median resident age - Females - Hispanic or Latino
Median resident age - Females - American Indian and Alaska Native
Median resident age - Females - Multirace
Median resident age - Females - Other Race
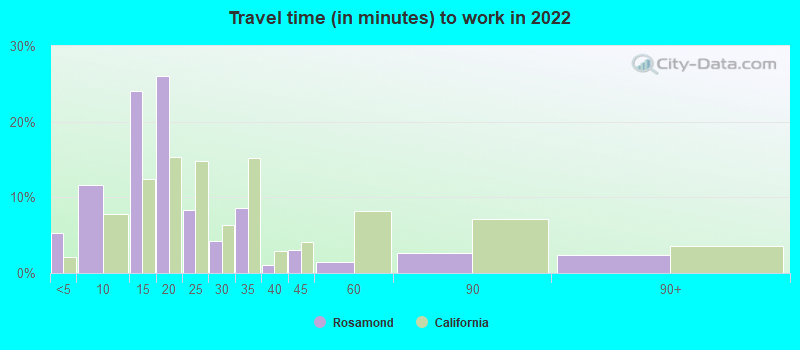
Commute - mean travel time to work (minutes)
Travel time to work - Less than 5 minutes (%)
Travel time to work - Less than 5 minutes (% change since 2000)
Travel time to work - 5 to 9 minutes (%)
Travel time to work - 5 to 9 minutes (% change since 2000)
Travel time to work - 10 to 19 minutes (%)
Travel time to work - 10 to 19 minutes (% change since 2000)
Travel time to work - 20 to 29 minutes (%)
Travel time to work - 20 to 29 minutes (% change since 2000)
Travel time to work - 30 to 39 minutes (%)
Travel time to work - 30 to 39 minutes (% change since 2000)
Travel time to work - 40 to 59 minutes (%)
Travel time to work - 40 to 59 minutes (% change since 2000)
Travel time to work - 60 to 89 minutes (%)
Travel time to work - 60 to 89 minutes (% change since 2000)
Travel time to work - 90 or more minutes (%)
Travel time to work - 90 or more minutes (% change since 2000)
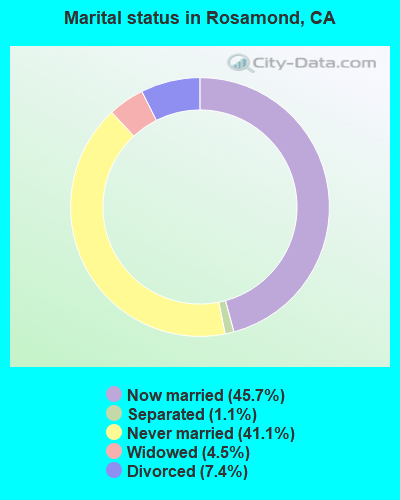
Marital status - Never married (%)
Marital status - Now married (%)
Marital status - Separated (%)
Marital status - Widowed (%)
Marital status - Divorced (%)
Median family income ($)
Median family income (% change since 2000)
Median non-family income ($)
Median non-family income (% change since 2000)
Median per capita income ($)
Median per capita income (% change since 2000)
Median family income ($) - White
Median family income ($) - Black or African American
Median family income ($) - Asian
Median family income ($) - Hispanic or Latino
Median family income ($) - American Indian and Alaska Native
Median family income ($) - Multirace
Median family income ($) - Other Race
Median year house/condo built
Median year apartment built
Year house built - Built 2005 or later (%)
Year house built - Built 2000 to 2004 (%)
Year house built - Built 1990 to 1999 (%)
Year house built - Built 1980 to 1989 (%)
Year house built - Built 1970 to 1979 (%)
Year house built - Built 1960 to 1969 (%)
Year house built - Built 1950 to 1959 (%)
Year house built - Built 1940 to 1949 (%)
Year house built - Built 1939 or earlier (%)
Average household size
Household density (households per square mile)
Average household size - White
Average household size - Black or African American
Average household size - Asian
Average household size - Hispanic or Latino
Average household size - American Indian and Alaska Native
Average household size - Multirace
Average household size - Other Race
Occupied housing units (%)
Vacant housing units (%)
Owner occupied housing units (%)
Renter occupied housing units (%)
Vacancy status - For rent (%)
Vacancy status - For sale only (%)
Vacancy status - Rented or sold, not occupied (%)
Vacancy status - For seasonal, recreational, or occasional use (%)
Vacancy status - For migrant workers (%)
Vacancy status - Other vacant (%)
Residents with income below the poverty level (%)
Residents with income below 50% of the poverty level (%)
Children below poverty level (%)
Poor families by family type - Married-couple family (%)
Poor families by family type - Male, no wife present (%)
Poor families by family type - Female, no husband present (%)
Poverty status for native-born residents (%)
Poverty status for foreign-born residents (%)
Poverty among high school graduates not in families (%)
Poverty among people who did not graduate high school not in families (%)
Residents with income below the poverty level (%) - White
Residents with income below the poverty level (%) - Black or African American
Residents with income below the poverty level (%) - Asian
Residents with income below the poverty level (%) - Hispanic or Latino
Residents with income below the poverty level (%) - American Indian and Alaska Native
Residents with income below the poverty level (%) - Multirace
Residents with income below the poverty level (%) - Other Race
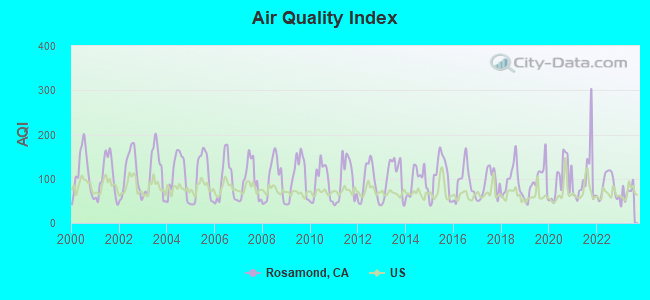
Air pollution - Air Quality Index (AQI)
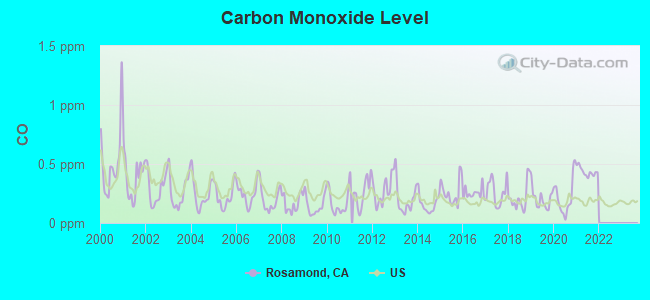
Air pollution - CO
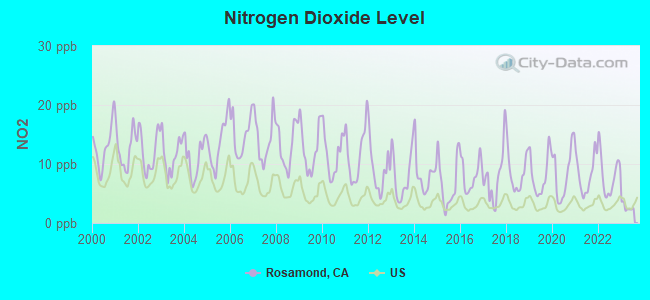
Air pollution - NO2
Air pollution - SO2
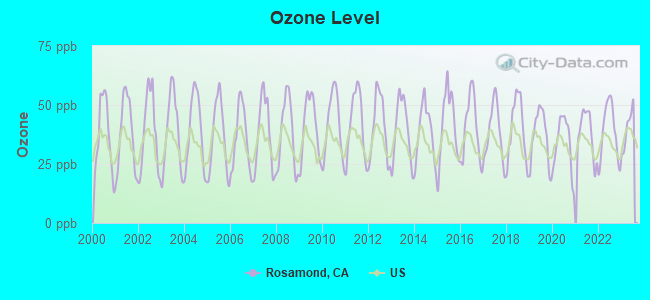
Air pollution - Ozone
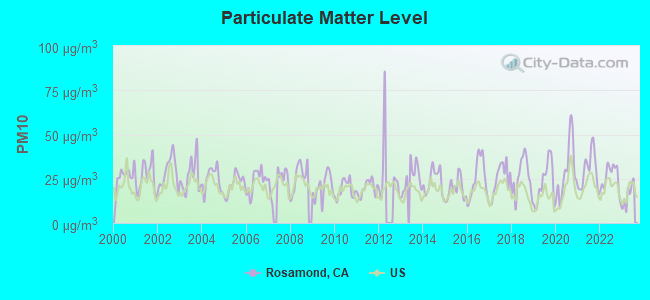
Air pollution - PM10
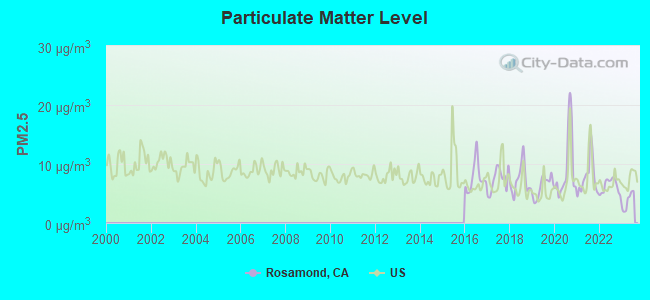
Air pollution - PM25
Air pollution - Pb
Crime - Murders per 100,000 population
Crime - Rapes per 100,000 population
Crime - Robberies per 100,000 population
Crime - Assaults per 100,000 population
Crime - Burglaries per 100,000 population
Crime - Thefts per 100,000 population
Crime - Auto thefts per 100,000 population
Crime - Arson per 100,000 population
Crime - City-data.com crime index
Crime - Violent crime index
Crime - Property crime index
Crime - Murders per 100,000 population (5 year average)
Crime - Rapes per 100,000 population (5 year average)
Crime - Robberies per 100,000 population (5 year average)
Crime - Assaults per 100,000 population (5 year average)
Crime - Burglaries per 100,000 population (5 year average)
Crime - Thefts per 100,000 population (5 year average)
Crime - Auto thefts per 100,000 population (5 year average)
Crime - Arson per 100,000 population (5 year average)
Crime - City-data.com crime index (5 year average)
Crime - Violent crime index (5 year average)
Crime - Property crime index (5 year average)
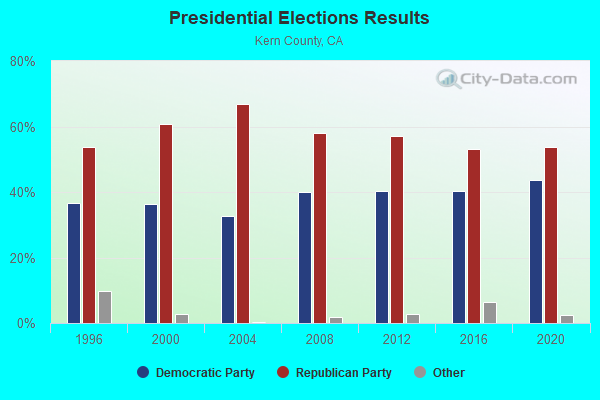
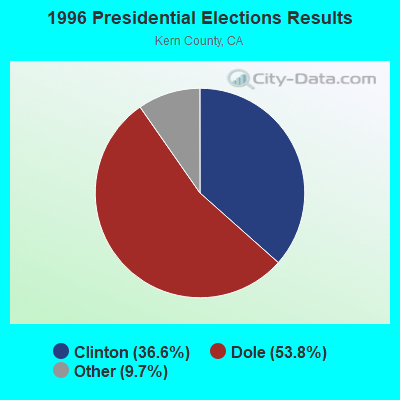
1996 Presidential Elections Results (%) - Democratic Party (Clinton)
1996 Presidential Elections Results (%) - Republican Party (Dole)
1996 Presidential Elections Results (%) - Other
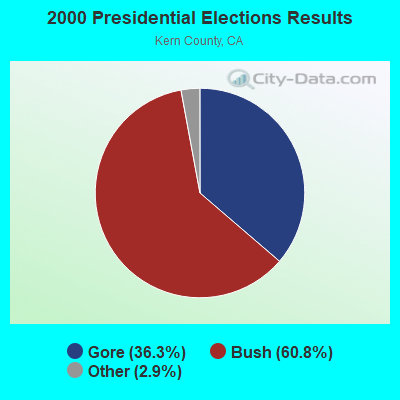
2000 Presidential Elections Results (%) - Democratic Party (Gore)
2000 Presidential Elections Results (%) - Republican Party (Bush)
2000 Presidential Elections Results (%) - Other
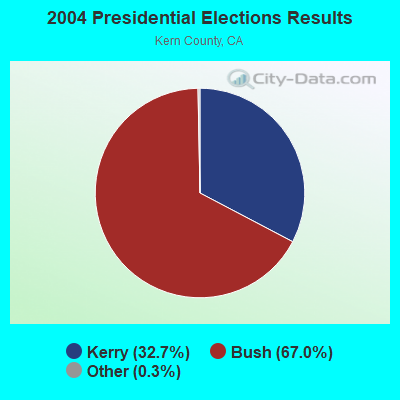
2004 Presidential Elections Results (%) - Democratic Party (Kerry)
2004 Presidential Elections Results (%) - Republican Party (Bush)
2004 Presidential Elections Results (%) - Other
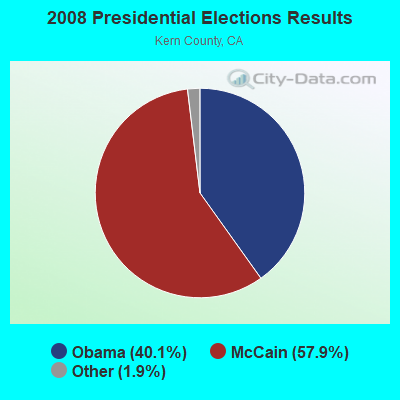
2008 Presidential Elections Results (%) - Democratic Party (Obama)
2008 Presidential Elections Results (%) - Republican Party (McCain)
2008 Presidential Elections Results (%) - Other
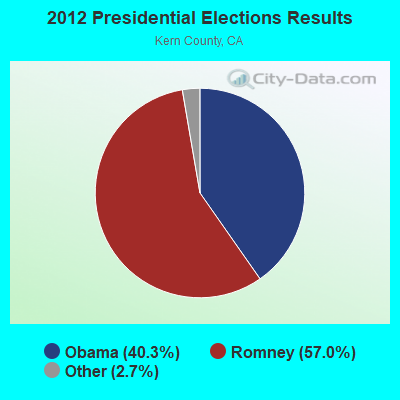
2012 Presidential Elections Results (%) - Democratic Party (Obama)
2012 Presidential Elections Results (%) - Republican Party (Romney)
2012 Presidential Elections Results (%) - Other
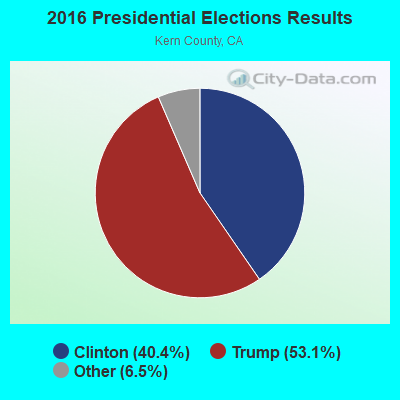
2016 Presidential Elections Results (%) - Democratic Party (Clinton)
2016 Presidential Elections Results (%) - Republican Party (Trump)
2016 Presidential Elections Results (%) - Other
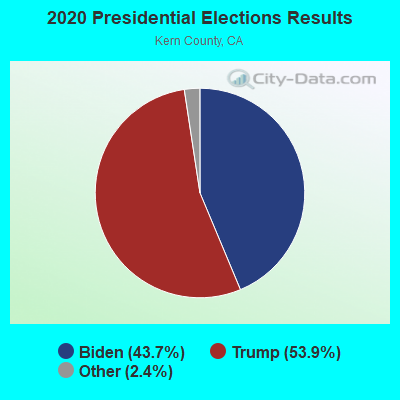
2020 Presidential Elections Results (%) - Democratic Party (Biden)
2020 Presidential Elections Results (%) - Republican Party (Trump)
2020 Presidential Elections Results (%) - Other
Ancestries Reported - Arab (%)
Ancestries Reported - Czech (%)
Ancestries Reported - Danish (%)
Ancestries Reported - Dutch (%)
Ancestries Reported - English (%)
Ancestries Reported - French (%)
Ancestries Reported - French Canadian (%)
Ancestries Reported - German (%)
Ancestries Reported - Greek (%)
Ancestries Reported - Hungarian (%)
Ancestries Reported - Irish (%)
Ancestries Reported - Italian (%)
Ancestries Reported - Lithuanian (%)
Ancestries Reported - Norwegian (%)
Ancestries Reported - Polish (%)
Ancestries Reported - Portuguese (%)
Ancestries Reported - Russian (%)
Ancestries Reported - Scotch-Irish (%)
Ancestries Reported - Scottish (%)
Ancestries Reported - Slovak (%)
Ancestries Reported - Subsaharan African (%)
Ancestries Reported - Swedish (%)
Ancestries Reported - Swiss (%)
Ancestries Reported - Ukrainian (%)
Ancestries Reported - United States (%)
Ancestries Reported - Welsh (%)
Ancestries Reported - West Indian (%)
Ancestries Reported - Other (%)
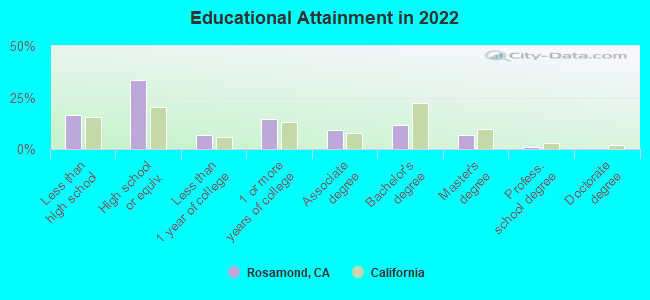
Educational Attainment - No schooling completed (%)
Educational Attainment - Less than high school (%)
Educational Attainment - High school or equivalent (%)
Educational Attainment - Less than 1 year of college (%)
Educational Attainment - 1 or more years of college (%)
Educational Attainment - Associate degree (%)
Educational Attainment - Bachelor's degree (%)
Educational Attainment - Master's degree (%)
Educational Attainment - Professional school degree (%)
Educational Attainment - Doctorate degree (%)
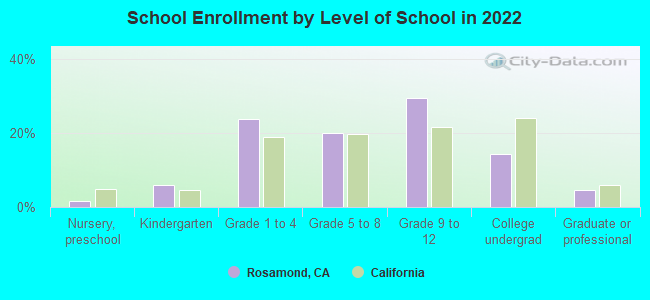
School Enrollment - Nursery, preschool (%)
School Enrollment - Kindergarten (%)
School Enrollment - Grade 1 to 4 (%)
School Enrollment - Grade 5 to 8 (%)
School Enrollment - Grade 9 to 12 (%)
School Enrollment - College undergrad (%)
School Enrollment - Graduate or professional (%)
School Enrollment - Not enrolled in school (%)
School enrollment - Public schools (%)
School enrollment - Private schools (%)
School enrollment - Not enrolled (%)
Median number of rooms in houses and condos
Median number of rooms in apartments
Housing units lacking complete plumbing facilities (%)
Housing units lacking complete kitchen facilities (%)
Density of houses
Urban houses (%)
Rural houses (%)
Households with people 60 years and over (%)
Households with people 65 years and over (%)
Households with people 75 years and over (%)
Households with one or more nonrelatives (%)
Households with no nonrelatives (%)
Population in households (%)
Family households (%)
Nonfamily households (%)
Population in families (%)
Family households with own children (%)
Median number of bedrooms in owner occupied houses
Mean number of bedrooms in owner occupied houses
Median number of bedrooms in renter occupied houses
Mean number of bedrooms in renter occupied houses
Median number of vehichles in owner occupied houses
Mean number of vehichles in owner occupied houses
Median number of vehichles in renter occupied houses
Mean number of vehichles in renter occupied houses
Mortgage status - with mortgage (%)
Mortgage status - with second mortgage (%)
Mortgage status - with home equity loan (%)
Mortgage status - with both second mortgage and home equity loan (%)
Mortgage status - without a mortgage (%)
Average family size
Average family size - White
Average family size - Black or African American
Average family size - Asian
Average family size - Hispanic or Latino
Average family size - American Indian and Alaska Native
Average family size - Multirace
Average family size - Other Race
Geographical mobility - Same house 1 year ago (%)
Geographical mobility - Moved within same county (%)
Geographical mobility - Moved from different county within same state (%)
Geographical mobility - Moved from different state (%)
Geographical mobility - Moved from abroad (%)
Place of birth - Born in state of residence (%)
Place of birth - Born in other state (%)
Place of birth - Native, outside of US (%)
Place of birth - Foreign born (%)
Housing units in structures - 1, detached (%)
Housing units in structures - 1, attached (%)
Housing units in structures - 2 (%)
Housing units in structures - 3 or 4 (%)
Housing units in structures - 5 to 9 (%)
Housing units in structures - 10 to 19 (%)
Housing units in structures - 20 to 49 (%)
Housing units in structures - 50 or more (%)
Housing units in structures - Mobile home (%)
Housing units in structures - Boat, RV, van, etc. (%)
House/condo owner moved in on average (years ago)
Renter moved in on average (years ago)
Year householder moved into unit - Moved in 1999 to March 2000 (%)
Year householder moved into unit - Moved in 1995 to 1998 (%)
Year householder moved into unit - Moved in 1990 to 1994 (%)
Year householder moved into unit - Moved in 1980 to 1989 (%)
Year householder moved into unit - Moved in 1970 to 1979 (%)
Year householder moved into unit - Moved in 1969 or earlier (%)
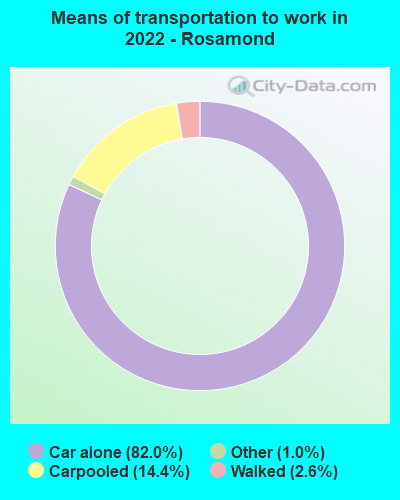
Means of transportation to work - Drove car alone (%)
Means of transportation to work - Carpooled (%)
Means of transportation to work - Public transportation (%)
Means of transportation to work - Bus or trolley bus (%)
Means of transportation to work - Streetcar or trolley car (%)
Means of transportation to work - Subway or elevated (%)
Means of transportation to work - Railroad (%)
Means of transportation to work - Ferryboat (%)
Means of transportation to work - Taxicab (%)
Means of transportation to work - Motorcycle (%)
Means of transportation to work - Bicycle (%)
Means of transportation to work - Walked (%)
Means of transportation to work - Other means (%)
Working at home (%)
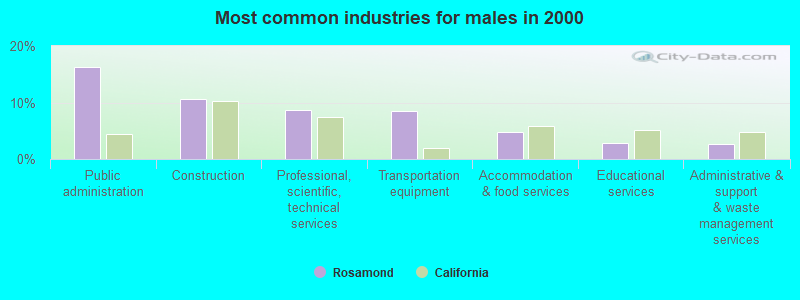
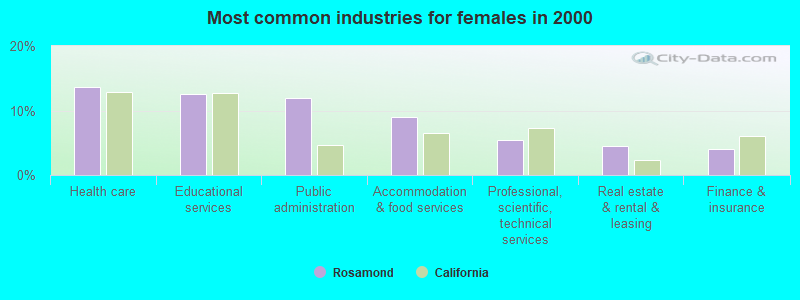
Industry diversity
Most Common Industries - Agriculture, forestry, fishing and hunting, and mining (%)
Most Common Industries - Agriculture, forestry, fishing and hunting (%)
Most Common Industries - Mining, quarrying, and oil and gas extraction (%)
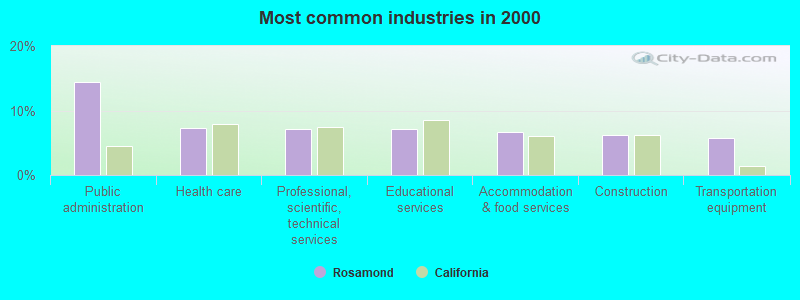
Most Common Industries - Construction (%)
Most Common Industries - Manufacturing (%)
Most Common Industries - Wholesale trade (%)
Most Common Industries - Retail trade (%)
Most Common Industries - Transportation and warehousing, and utilities (%)
Most Common Industries - Transportation and warehousing (%)
Most Common Industries - Utilities (%)
Most Common Industries - Information (%)
Most Common Industries - Finance and insurance, and real estate and rental and leasing (%)
Most Common Industries - Finance and insurance (%)
Most Common Industries - Real estate and rental and leasing (%)
Most Common Industries - Professional, scientific, and management, and administrative and waste management services (%)
Most Common Industries - Professional, scientific, and technical services (%)
Most Common Industries - Management of companies and enterprises (%)
Most Common Industries - Administrative and support and waste management services (%)
Most Common Industries - Educational services, and health care and social assistance (%)
Most Common Industries - Educational services (%)
Most Common Industries - Health care and social assistance (%)
Most Common Industries - Arts, entertainment, and recreation, and accommodation and food services (%)
Most Common Industries - Arts, entertainment, and recreation (%)
Most Common Industries - Accommodation and food services (%)
Most Common Industries - Other services, except public administration (%)
Most Common Industries - Public administration (%)
Occupation diversity
Most Common Occupations - Management, business, science, and arts occupations (%)
Most Common Occupations - Management, business, and financial occupations (%)
Most Common Occupations - Management occupations (%)
Most Common Occupations - Business and financial operations occupations (%)
Most Common Occupations - Computer, engineering, and science occupations (%)
Most Common Occupations - Computer and mathematical occupations (%)
Most Common Occupations - Architecture and engineering occupations (%)
Most Common Occupations - Life, physical, and social science occupations (%)
Most Common Occupations - Education, legal, community service, arts, and media occupations (%)
Most Common Occupations - Community and social service occupations (%)
Most Common Occupations - Legal occupations (%)
Most Common Occupations - Education, training, and library occupations (%)
Most Common Occupations - Arts, design, entertainment, sports, and media occupations (%)
Most Common Occupations - Healthcare practitioners and technical occupations (%)
Most Common Occupations - Health diagnosing and treating practitioners and other technical occupations (%)
Most Common Occupations - Health technologists and technicians (%)
Most Common Occupations - Service occupations (%)
Most Common Occupations - Healthcare support occupations (%)
Most Common Occupations - Protective service occupations (%)
Most Common Occupations - Fire fighting and prevention, and other protective service workers including supervisors (%)
Most Common Occupations - Law enforcement workers including supervisors (%)
Most Common Occupations - Food preparation and serving related occupations (%)
Most Common Occupations - Building and grounds cleaning and maintenance occupations (%)
Most Common Occupations - Personal care and service occupations (%)
Most Common Occupations - Sales and office occupations (%)
Most Common Occupations - Sales and related occupations (%)
Most Common Occupations - Office and administrative support occupations (%)
Most Common Occupations - Natural resources, construction, and maintenance occupations (%)
Most Common Occupations - Farming, fishing, and forestry occupations (%)
Most Common Occupations - Construction and extraction occupations (%)
Most Common Occupations - Installation, maintenance, and repair occupations (%)
Most Common Occupations - Production, transportation, and material moving occupations (%)
Most Common Occupations - Production occupations (%)
Most Common Occupations - Transportation occupations (%)
Most Common Occupations - Material moving occupations (%)
People in Group quarters - Institutionalized population (%)
People in Group quarters - Correctional institutions (%)
People in Group quarters - Federal prisons and detention centers (%)
People in Group quarters - Halfway houses (%)
People in Group quarters - Local jails and other confinement facilities (including police lockups) (%)
People in Group quarters - Military disciplinary barracks (%)
People in Group quarters - State prisons (%)
People in Group quarters - Other types of correctional institutions (%)
People in Group quarters - Nursing homes (%)
People in Group quarters - Hospitals/wards, hospices, and schools for the handicapped (%)
People in Group quarters - Hospitals/wards and hospices for chronically ill (%)
People in Group quarters - Hospices or homes for chronically ill (%)
People in Group quarters - Military hospitals or wards for chronically ill (%)
People in Group quarters - Other hospitals or wards for chronically ill (%)
People in Group quarters - Hospitals or wards for drug/alcohol abuse (%)
People in Group quarters - Mental (Psychiatric) hospitals or wards (%)
People in Group quarters - Schools, hospitals, or wards for the mentally retarded (%)
People in Group quarters - Schools, hospitals, or wards for the physically handicapped (%)
People in Group quarters - Institutions for the deaf (%)
People in Group quarters - Institutions for the blind (%)
People in Group quarters - Orthopedic wards and institutions for the physically handicapped (%)
People in Group quarters - Wards in general hospitals for patients who have no usual home elsewhere (%)
People in Group quarters - Wards in military hospitals for patients who have no usual home elsewhere (%)
People in Group quarters - Juvenile institutions (%)
People in Group quarters - Long-term care (%)
People in Group quarters - Homes for abused, dependent, and neglected children (%)
People in Group quarters - Residential treatment centers for emotionally disturbed children (%)
People in Group quarters - Training schools for juvenile delinquents (%)
People in Group quarters - Short-term care, detention or diagnostic centers for delinquent children (%)
People in Group quarters - Type of juvenile institution unknown (%)
People in Group quarters - Noninstitutionalized population (%)
People in Group quarters - College dormitories (includes college quarters off campus) (%)
People in Group quarters - Military quarters (%)
People in Group quarters - On base (%)
People in Group quarters - Barracks, unaccompanied personnel housing (UPH), (Enlisted/Officer), ;and similar group living quarters for military personnel (%)
People in Group quarters - Transient quarters for temporary residents (%)
People in Group quarters - Military ships (%)
People in Group quarters - Group homes (%)
People in Group quarters - Homes or halfway houses for drug/alcohol abuse (%)
People in Group quarters - Homes for the mentally ill (%)
People in Group quarters - Homes for the mentally retarded (%)
People in Group quarters - Homes for the physically handicapped (%)
People in Group quarters - Other group homes (%)
People in Group quarters - Religious group quarters (%)
People in Group quarters - Dormitories (%)
People in Group quarters - Agriculture workers' dormitories on farms (%)
People in Group quarters - Job Corps and vocational training facilities (%)
People in Group quarters - Other workers' dormitories (%)
People in Group quarters - Crews of maritime vessels (%)
People in Group quarters - Other nonhousehold living situations (%)
People in Group quarters - Other noninstitutional group quarters (%)
Residents speaking English at home (%)
Residents speaking English at home - Born in the United States (%)
Residents speaking English at home - Native, born elsewhere (%)
Residents speaking English at home - Foreign born (%)
Residents speaking Spanish at home (%)
Residents speaking Spanish at home - Born in the United States (%)
Residents speaking Spanish at home - Native, born elsewhere (%)
Residents speaking Spanish at home - Foreign born (%)
Residents speaking other language at home (%)
Residents speaking other language at home - Born in the United States (%)
Residents speaking other language at home - Native, born elsewhere (%)
Residents speaking other language at home - Foreign born (%)
Class of Workers - Employee of private company (%)
Class of Workers - Self-employed in own incorporated business (%)
Class of Workers - Private not-for-profit wage and salary workers (%)
Class of Workers - Local government workers (%)
Class of Workers - State government workers (%)
Class of Workers - Federal government workers (%)
Class of Workers - Self-employed workers in own not incorporated business and Unpaid family workers (%)
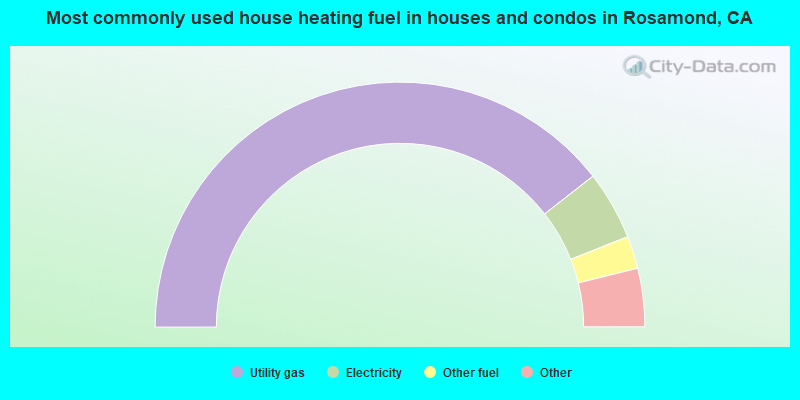
House heating fuel used in houses and condos - Utility gas (%)
House heating fuel used in houses and condos - Bottled, tank, or LP gas (%)
House heating fuel used in houses and condos - Electricity (%)
House heating fuel used in houses and condos - Fuel oil, kerosene, etc. (%)
House heating fuel used in houses and condos - Coal or coke (%)
House heating fuel used in houses and condos - Wood (%)
House heating fuel used in houses and condos - Solar energy (%)
House heating fuel used in houses and condos - Other fuel (%)
House heating fuel used in houses and condos - No fuel used (%)
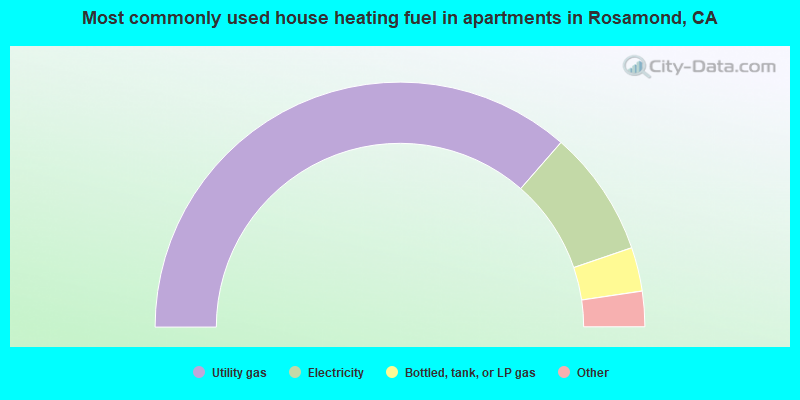
House heating fuel used in apartments - Utility gas (%)
House heating fuel used in apartments - Bottled, tank, or LP gas (%)
House heating fuel used in apartments - Electricity (%)
House heating fuel used in apartments - Fuel oil, kerosene, etc. (%)
House heating fuel used in apartments - Coal or coke (%)
House heating fuel used in apartments - Wood (%)
House heating fuel used in apartments - Solar energy (%)
House heating fuel used in apartments - Other fuel (%)
House heating fuel used in apartments - No fuel used (%)
Armed forces status - In Armed Forces (%)
Armed forces status - Civilian (%)
Armed forces status - Civilian - Veteran (%)
Armed forces status - Civilian - Nonveteran (%)
Fatal accidents locations in years 2005-2021
Fatal accidents locations in 2005
Fatal accidents locations in 2006
Fatal accidents locations in 2007
Fatal accidents locations in 2008
Fatal accidents locations in 2009
Fatal accidents locations in 2010
Fatal accidents locations in 2011
Fatal accidents locations in 2012
Fatal accidents locations in 2013
Fatal accidents locations in 2014
Fatal accidents locations in 2015
Fatal accidents locations in 2016
Fatal accidents locations in 2017
Fatal accidents locations in 2018
Fatal accidents locations in 2019
Fatal accidents locations in 2020
Fatal accidents locations in 2021
Alcohol use - People drinking some alcohol every month (%)
Alcohol use - People not drinking at all (%)
Alcohol use - Average days/month drinking alcohol
Alcohol use - Average drinks/week
Alcohol use - Average days/year people drink much
Audiometry - Average condition of hearing (%)
Audiometry - People that can hear a whisper from across a quiet room (%)
Audiometry - People that can hear normal voice from across a quiet room (%)
Audiometry - Ears ringing, roaring, buzzing (%)
Audiometry - Had a job exposure to loud noise (%)
Audiometry - Had off-work exposure to loud noise (%)
Blood Pressure & Cholesterol - Has high blood pressure (%)
Blood Pressure & Cholesterol - Checking blood pressure at home (%)
Blood Pressure & Cholesterol - Frequently checking blood cholesterol (%)
Blood Pressure & Cholesterol - Has high cholesterol level (%)
Consumer Behavior - Money monthly spent on food at supermarket/grocery store
Consumer Behavior - Money monthly spent on food at other stores
Consumer Behavior - Money monthly spent on eating out
Consumer Behavior - Money monthly spent on carryout/delivered foods
Consumer Behavior - Income spent on food at supermarket/grocery store (%)
Consumer Behavior - Income spent on food at other stores (%)
Consumer Behavior - Income spent on eating out (%)
Consumer Behavior - Income spent on carryout/delivered foods (%)
Current Health Status - General health condition (%)
Current Health Status - Blood donors (%)
Current Health Status - Has blood ever tested for HIV virus (%)
Current Health Status - Left-handed people (%)
Dermatology - People using sunscreen (%)
Diabetes - Diabetics (%)
Diabetes - Had a blood test for high blood sugar (%)
Diabetes - People taking insulin (%)
Diet Behavior & Nutrition - Diet health (%)
Diet Behavior & Nutrition - Milk product consumption (# of products/month)
Diet Behavior & Nutrition - Meals not home prepared (#/week)
Diet Behavior & Nutrition - Meals from fast food or pizza place (#/week)
Diet Behavior & Nutrition - Ready-to-eat foods (#/month)
Diet Behavior & Nutrition - Frozen meals/pizza (#/month)
Drug Use - People that ever used marijuana or hashish (%)
Drug Use - Ever used hard drugs (%)
Drug Use - Ever used any form of cocaine (%)
Drug Use - Ever used heroin (%)
Drug Use - Ever used methamphetamine (%)
Health Insurance - People covered by health insurance (%)
Kidney Conditions-Urology - Avg. # of times urinating at night
Medical Conditions - People with asthma (%)
Medical Conditions - People with anemia (%)
Medical Conditions - People with psoriasis (%)
Medical Conditions - People with overweight (%)
Medical Conditions - Elderly people having difficulties in thinking or remembering (%)
Medical Conditions - People who ever received blood transfusion (%)
Medical Conditions - People having trouble seeing even with glass/contacts (%)
Medical Conditions - People with arthritis (%)
Medical Conditions - People with gout (%)
Medical Conditions - People with congestive heart failure (%)
Medical Conditions - People with coronary heart disease (%)
Medical Conditions - People with angina pectoris (%)
Medical Conditions - People who ever had heart attack (%)
Medical Conditions - People who ever had stroke (%)
Medical Conditions - People with emphysema (%)
Medical Conditions - People with thyroid problem (%)
Medical Conditions - People with chronic bronchitis (%)
Medical Conditions - People with any liver condition (%)
Medical Conditions - People who ever had cancer or malignancy (%)
Mental Health - People who have little interest in doing things (%)
Mental Health - People feeling down, depressed, or hopeless (%)
Mental Health - People who have trouble sleeping or sleeping too much (%)
Mental Health - People feeling tired or having little energy (%)
Mental Health - People with poor appetite or overeating (%)
Mental Health - People feeling bad about themself (%)
Mental Health - People who have trouble concentrating on things (%)
Mental Health - People moving or speaking slowly or too fast (%)
Mental Health - People having thoughts they would be better off dead (%)
Oral Health - Average years since last visit a dentist
Oral Health - People embarrassed because of mouth (%)
Oral Health - People with gum disease (%)
Oral Health - General health of teeth and gums (%)
Oral Health - Average days a week using dental floss/device
Oral Health - Average days a week using mouthwash for dental problem
Oral Health - Average number of teeth
Pesticide Use - Households using pesticides to control insects (%)
Pesticide Use - Households using pesticides to kill weeds (%)
Physical Activity - People doing vigorous-intensity work activities (%)
Physical Activity - People doing moderate-intensity work activities (%)
Physical Activity - People walking or bicycling (%)
Physical Activity - People doing vigorous-intensity recreational activities (%)
Physical Activity - People doing moderate-intensity recreational activities (%)
Physical Activity - Average hours a day doing sedentary activities
Physical Activity - Average hours a day watching TV or videos
Physical Activity - Average hours a day using computer
Physical Functioning - People having limitations keeping them from working (%)
Physical Functioning - People limited in amount of work they can do (%)
Physical Functioning - People that need special equipment to walk (%)
Physical Functioning - People experiencing confusion/memory problems (%)
Physical Functioning - People requiring special healthcare equipment (%)
Prescription Medications - Average number of prescription medicines taking
Preventive Aspirin Use - Adults 40+ taking low-dose aspirin (%)
Reproductive Health - Vaginal deliveries (%)
Reproductive Health - Cesarean deliveries (%)
Reproductive Health - Deliveries resulted in a live birth (%)
Reproductive Health - Pregnancies resulted in a delivery (%)
Reproductive Health - Women breastfeeding newborns (%)
Reproductive Health - Women that had a hysterectomy (%)
Reproductive Health - Women that had both ovaries removed (%)
Reproductive Health - Women that have ever taken birth control pills (%)
Reproductive Health - Women taking birth control pills (%)
Reproductive Health - Women that have ever used Depo-Provera or injectables (%)
Reproductive Health - Women that have ever used female hormones (%)
Sexual Behavior - People 18+ that ever had sex (vaginal, anal, or oral) (%)
Sexual Behavior - Males 18+ that ever had vaginal sex with a woman (%)
Sexual Behavior - Males 18+ that ever performed oral sex on a woman (%)
Sexual Behavior - Males 18+ that ever had anal sex with a woman (%)
Sexual Behavior - Males 18+ that ever had any sex with a man (%)
Sexual Behavior - Females 18+ that ever had vaginal sex with a man (%)
Sexual Behavior - Females 18+ that ever performed oral sex on a man (%)
Sexual Behavior - Females 18+ that ever had anal sex with a man (%)
Sexual Behavior - Females 18+ that ever had any kind of sex with a woman (%)
Sexual Behavior - Average age people first had sex
Sexual Behavior - Average number of female sex partners in lifetime (males 18+)
Sexual Behavior - Average number of female vaginal sex partners in lifetime (males 18+)
Sexual Behavior - Average age people first performed oral sex on a woman (18+)
Sexual Behavior - Average number of woman performed oral sex on in lifetime (18+)
Sexual Behavior - Average number of male sex partners in lifetime (males 18+)
Sexual Behavior - Average number of male anal sex partners in lifetime (males 18+)
Sexual Behavior - Average age people first performed oral sex on a man (18+)
Sexual Behavior - Average number of male oral sex partners in lifetime (18+)
Sexual Behavior - People using protection when performing oral sex (%)
Sexual Behavior - Average number of times people have vaginal or anal sex a year
Sexual Behavior - People having sex without condom (%)
Sexual Behavior - Average number of male sex partners in lifetime (females 18+)
Sexual Behavior - Average number of male vaginal sex partners in lifetime (females 18+)
Sexual Behavior - Average number of female sex partners in lifetime (females 18+)
Sexual Behavior - Circumcised males 18+ (%)
Sleep Disorders - Average hours sleeping at night
Sleep Disorders - People that has trouble sleeping (%)
Smoking-Cigarette Use - People smoking cigarettes (%)
Taste & Smell - People 40+ having problems with smell (%)
Taste & Smell - People 40+ having problems with taste (%)
Taste & Smell - People 40+ that ever had wisdom teeth removed (%)
Taste & Smell - People 40+ that ever had tonsils teeth removed (%)
Taste & Smell - People 40+ that ever had a loss of consciousness because of a head injury (%)
Taste & Smell - People 40+ that ever had a broken nose or other serious injury to face or skull (%)
Taste & Smell - People 40+ that ever had two or more sinus infections (%)
Weight - Average height (inches)
Weight - Average weight (pounds)
Weight - Average BMI
Weight - People that are obese (%)
Weight - People that ever were obese (%)
Weight - People trying to lose weight (%)
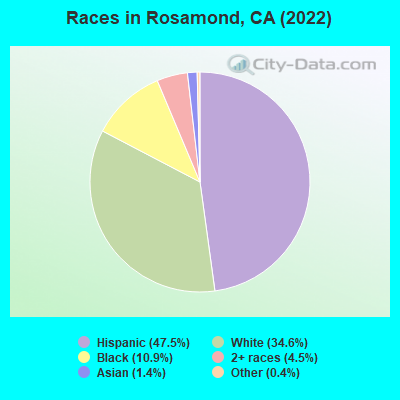
9,917 47.5% Hispanic 7,209 34.6% White alone 2,271 10.9% Black alone 931 4.5% Two or more races 288 1.4% Asian alone 77 0.4% Other race alone 7 0.03% Native Hawaiian and Other 4 0.02% American Indian alone
Latest news from Rosamond, CA collected exclusively by city-data.com from local newspapers, TV, and radio stations
Ancestries: German (4.0%), American (3.9%), English (3.6%), European (2.9%), Norwegian (1.8%), Irish (1.4%).
Current Local Time:
Land area: 52.2 square miles.
Population density: 347 people per square mile (very low).
2,124 residents are foreign born (8.0% Latin America ).
This place:
10.2%California:
26.5%
Median real estate property taxes paid for housing units with mortgages in 2022: $3,156 (0.8%)Median real estate property taxes paid for housing units with no mortgage in 2022: $1,113 (0.6%)
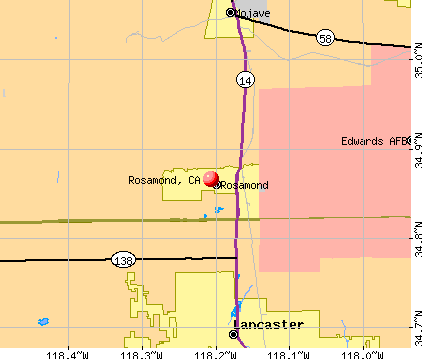
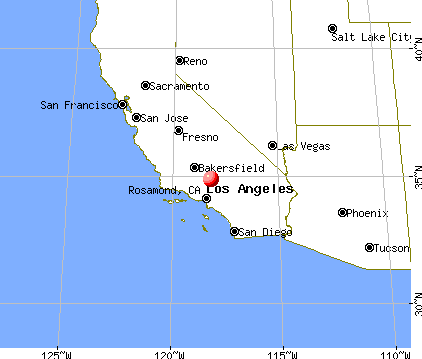
Nearest city with pop. 50,000+: North Antelope Valley, CA (11.2 miles
Nearest city with pop. 200,000+: Upper San Gabriel Valley, CA (53.4 miles
Nearest city with pop. 1,000,000+: Los Angeles, CA
Nearest cities:
Latitude: 34.87 N, Longitude: 118.21 W
Daytime population change due to commuting: -6,155 (-29.5%)Workers who live and work in this place: 1,549 (17.5%)
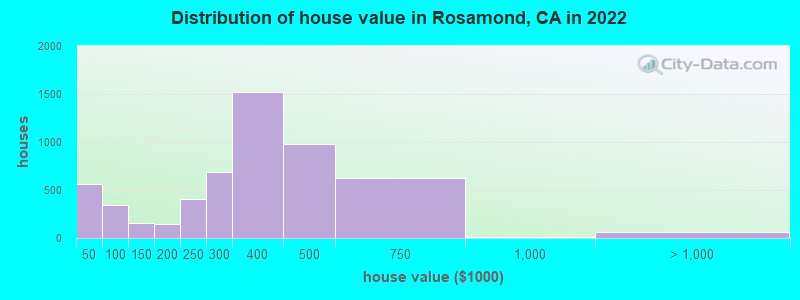
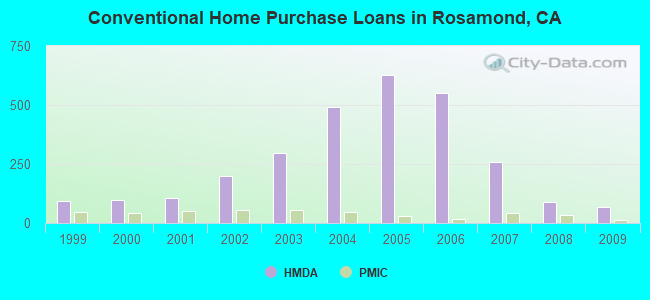
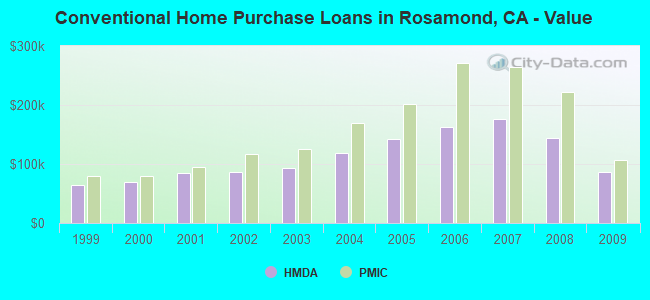
Property values in Rosamond, CA
Unemployment in December 2023:
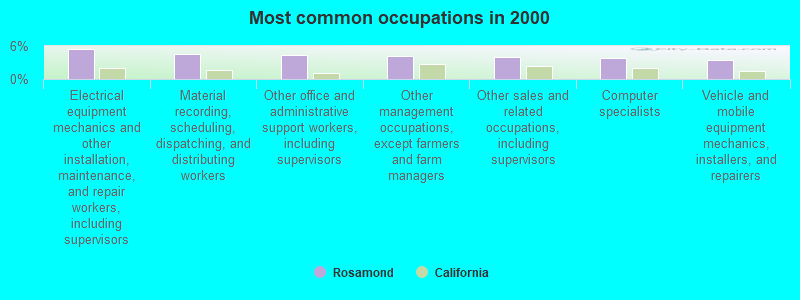
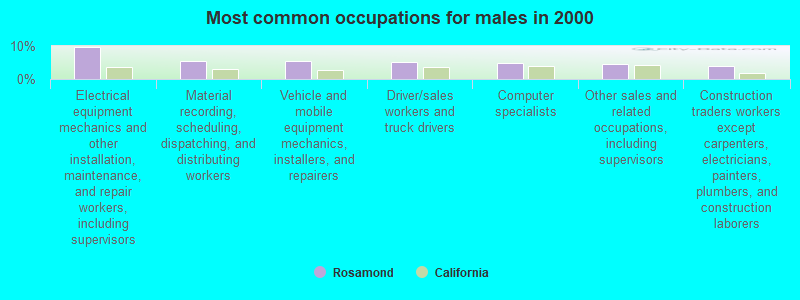
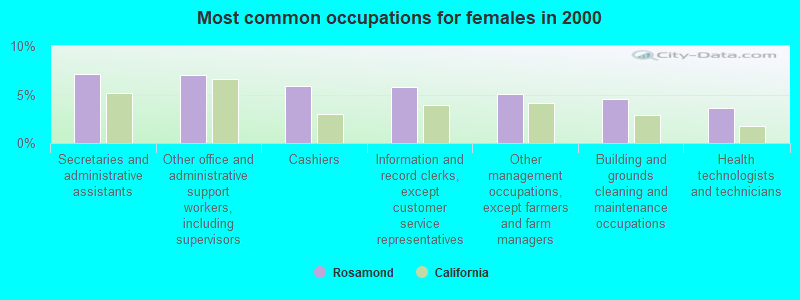
Most common occupations in Rosamond, CA (%)
Both Males Females
Electrical equipment mechanics and other installation, maintenance, and repair workers, including supervisors (5.4%)
Material recording, scheduling, dispatching, and distributing workers (4.6%)
Other office and administrative support workers, including supervisors (4.3%)
Other management occupations, except farmers and farm managers (4.1%)
Other sales and related occupations, including supervisors (4.0%)
Computer specialists (3.8%)
Vehicle and mobile equipment mechanics, installers, and repairers (3.5%)
Electrical equipment mechanics and other installation, maintenance, and repair workers, including supervisors (9.7%)
Material recording, scheduling, dispatching, and distributing workers (5.5%)
Vehicle and mobile equipment mechanics, installers, and repairers (5.3%)
Driver/sales workers and truck drivers (5.2%)
Computer specialists (4.7%)
Other sales and related occupations, including supervisors (4.4%)
Construction traders workers except carpenters, electricians, painters, plumbers, and construction laborers (4.0%)
Secretaries and administrative assistants (7.1%)
Other office and administrative support workers, including supervisors (7.1%)
Cashiers (5.8%)
Information and record clerks, except customer service representatives (5.8%)
Other management occupations, except farmers and farm managers (5.1%)
Building and grounds cleaning and maintenance occupations (4.5%)
Health technologists and technicians (3.6%)
Earthquake activity:
Rosamond-area historical earthquake activity is significantly above California state average. It is 7709% greater than the overall U.S. average. On 7/21/1952 at 11:52:14, a magnitude 7.7 (7.7 UK, Class: Major, Intensity: VIII - XII) earthquake occurred 45.9 miles away from the city center, causing $50,000,000 total damage On 6/28/1992 at 11:57:34, a magnitude 7.6 (6.2 MB, 7.6 MS, 7.3 MW, Depth: 0.7 mi) earthquake occurred 106.5 miles away from the city center, causing 3 deaths ( 1 shaking deaths, 2 other deaths) and 400 injuries, causing $100,000,000 total damage and $40,000,000 insured lossesOn 10/16/1999 at 09:46:44, a magnitude 7.4 (6.3 MB, 7.4 MS, 7.2 MW, 7.3 ML) earthquake occurred 103.6 miles away from Rosamond center On 11/4/1927 at 13:51:53, a magnitude 7.5 (7.5 UK) earthquake occurred 160.3 miles away from Rosamond center On 1/17/1994 at 12:30:55, a magnitude 6.8 (6.4 MB, 6.8 MS, 6.7 MW, Depth: 11.4 mi, Class: Strong, Intensity: VII - IX) earthquake occurred 53.4 miles away from the city center, causing 60 deaths ( 60 shaking deaths) and 7000 injuriesOn 6/28/1992 at 15:05:30, a magnitude 6.9 (6.3 MB, 6.7 MS, 6.5 MW, 6.9 ME, Depth: 3.1 mi) earthquake occurred 88.6 miles away from the city center Magnitude types: body-wave magnitude (MB), energy magnitude (ME), local magnitude (ML), surface-wave magnitude (MS), moment magnitude (MW) Natural disasters: The number of natural disasters in Kern County (29) is a lot greater than the US average (15).Major Disasters (Presidential) Declared: 14Emergencies Declared: 3Fires: 12, Floods: 12, Storms: 7, Winter Storms: 5, Mudslides: 4, Landslides: 3, Freezes: 2, Drought: 1, Heavy Rain: 1, Hurricane: 1, Snow: 1, Tornado: 1, Wind: 1, Other: 1 (Note: some incidents may be assigned to more than one category). Hospitals and medical centers near Rosamond: LAC/HIGH DESERT HOSPITAL (Hospital, about 12 miles away; LANCASTER, CA)
FMC-ANTELOPE VALLEY (Dialysis Facility, about 12 miles away; LANCASTER, CA)
ST JUDE HOME HEALTH CARE (Home Health Center, about 13 miles away; LANCASTER, CA)
ANTELOPE VALLEY CARE CENTER (Nursing Home, about 13 miles away; LANCASTER, CA)
DAVITA-ANTELOPE VALLEY DIALYSIS (Dialysis Facility, about 13 miles away; LANCASTER, CA)
REGIONAL VALLEY SURGERY CENTER (Hospital, about 13 miles away; LANCASTER, CA)
LANCASTER HEALTH CARE CENTER (Nursing Home, about 13 miles away; LANCASTER, CA)
Amtrak station: ROSAMOND (2515 CENTER ST.) - Bus Station
.
Services: fully wheelchair accessible, public payphones, snack bar, free short-term parking.
Colleges/universities with over 2000 students nearest to Rosamond:
Antelope Valley College (about 14 miles; Lancaster, CA ; Full-time enrollment: 9,206)
College of the Canyons (about 39 miles; Santa Clarita, CA ; FT enrollment: 11,307)
Los Angeles Mission College (about 40 miles; Sylmar, CA ; FT enrollment: 4,825)
California State University-Northridge (about 48 miles; Northridge, CA ; FT enrollment: 28,060)
Art Center College of Design (about 49 miles; Pasadena, CA ; FT enrollment: 2,346)
Glendale Community College (about 49 miles; Glendale, CA ; FT enrollment: 11,348)
Los Angeles Valley College (about 50 miles; Valley Glen, CA ; FT enrollment: 9,459)
Public high schools in Rosamond:
Public elementary/middle schools in Rosamond: TROPICO MIDDLE Students: 751, Location: 3180 MOJAVE-TROPICO RD., Grades: 6-8)ROSAMOND ELEMENTARY Students: 438, Location: 1981 ROSAMOND BLVD., Grades: KG-5)WESTPARK ELEMENTARY Location: 3600 IMPERIAL AVE., Grades: KG-5)
See full list of schools located in Rosamond
Notable locations in Rosamond: (A) , John Hartman Garage Area (B) , Willow Springs Raceway (C) , Gaskill Ranch (D) , Kern County Fire Department Station 15 Rosamond (E) , Rosamond Chamber of Commerce (F) , Rosamond Branch Kern County Library (G) , Hummel Hall (H) . Display/hide their locations on the map
Churches in Rosamond include: (A) , First Southern Baptist Church (B) , New Life Church of God in Christ (C) , Saint Mary of the Desert Church (D) , Wayside Chapel Community Church (E) , Willow Springs Church (F) . Display/hide their locations on the map
Parks in Rosamond include: (1) , Willow Springs Stadium (2) . Display/hide their locations on the map
Tourist attraction: (1) . Display/hide its approximate location on the map
Kern County has a predicted average indoor radon screening level between 2 and 4 pCi/L (pico curies per liter) - Moderate Potential Drinking water stations with addresses in Rosamond and their reported violations in the past:
WILLOW SPRINGS RACEWAY (Population served: 5,000, Groundwater):
Past health violations:
MCL, Monthly (TCR) - In MAR-2006, Contaminant: Coliform. Follow-up actions: St AO (w/o penalty) issued (JUL-16-2006)
Past monitoring violations:
2 minor monitoring violations
Population served: 49, Groundwater):
Past health violations:
MCL, Average - Between JAN-2013 and MAR-2013, Contaminant: Arsenic. Follow-up actions: St AO (w/o penalty) issued (JAN-23-2009)
MCL, Average - Between OCT-2008 and DEC-2008, Contaminant: Arsenic. Follow-up actions: St AO (w/o penalty) issued (JAN-23-2009)
Past monitoring violations:
2 regular monitoring violations
Population served: 44, Groundwater):
Past health violations:
MCL, Average - Between APR-2011 and JUN-2011, Contaminant: Arsenic. Follow-up actions: St AO (w/o penalty) issued (JUL-19-2011)
Past monitoring violations:
2 regular monitoring violations
Average household size: This place:
2.9 peopleCalifornia:
2.9 people
Percentage of family households: This place:
72.4%Whole state:
68.7%
Percentage of households with unmarried partners: This place:
7.6%Whole state:
7.2%
Likely homosexual households (counted as self-reported same-sex unmarried-partner households)
Lesbian couples: 0.3% of all households Gay men: 0.3% of all households
5 people in group homes intended for adults in 2010
Banks with branches in Rosamond (2011 data):
California Bank & Trust: Rosamond Branch at 2535 Rosamond Boulevard, branch established on 1984/11/05. Info updated 2009/07/20: Bank assets: $10,894.1 mil, Deposits: $9,193.9 mil, headquarters in San Diego, CA, positive income , Commercial Lending Specialization, 109 total offices , Holding Company: Zions Bancorporation
For population 15 years and over in Rosamond:
Never married: 39.9%Now married: 47.9%Separated: 1.2%Widowed: 3.9%Divorced: 7.0% For population 25 years and over in Rosamond:
High school or higher: 82.9%Bachelor's degree or higher: 18.8%Graduate or professional degree: 7.3%Unemployed: 9.7%Mean travel time to work (commute): 28.5 minutes
Education Gini index (Inequality in education) Here:
13.9California average:
15.5
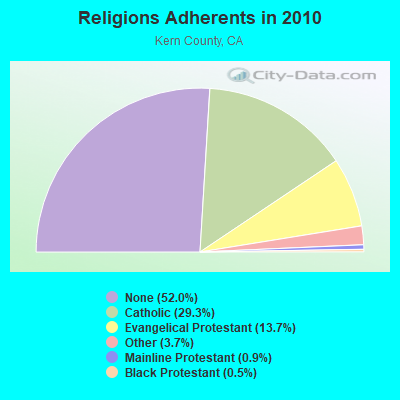
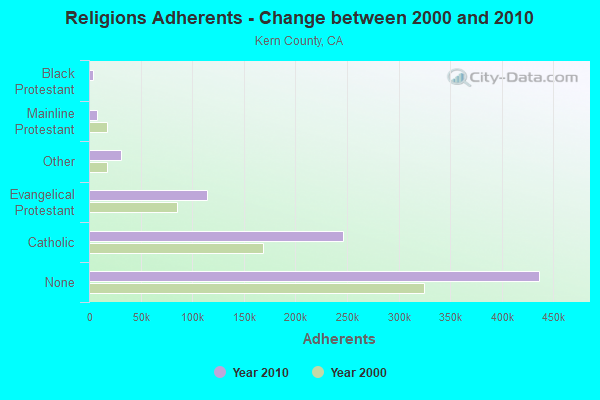
Religion statistics for Rosamond, CA (based on Kern County data)
Religion Adherents Congregations Catholic 245,836 30 Evangelical Protestant 114,724 436 Other 30,687 83 Mainline Protestant 7,459 38 Black Protestant 4,026 25 Orthodox 450 3 None 436,449 -
Source: Clifford Grammich, Kirk Hadaway, Richard Houseal, Dale E.Jones, Alexei Krindatch, Richie Stanley and Richard H.Taylor. 2012. 2010 U.S.Religion Census: Religious Congregations & Membership Study. Association of Statisticians of American Religious Bodies. Jones, Dale E., et al. 2002. Congregations and Membership in the United States 2000. Nashville, TN: Glenmary Research Center. Graphs represent county-level data
Food Environment Statistics: Number of grocery stores : 190This county :
2.41 / 10,000 pop.California :
2.14 / 10,000 pop.
Number of supercenters and club stores : 3Kern County :
0.04 / 10,000 pop.California :
0.04 / 10,000 pop.
Number of convenience stores (no gas) : 63This county :
0.80 / 10,000 pop.State :
0.62 / 10,000 pop.
Number of convenience stores (with gas) : 165Kern County :
2.10 / 10,000 pop.State :
1.49 / 10,000 pop.
Number of full-service restaurants : 362Here :
4.60 / 10,000 pop.California :
7.42 / 10,000 pop.
Adult diabetes rate : This county :
8.0%California :
7.3%
Adult obesity rate : This county :
29.4%California :
21.3%
Low-income preschool obesity rate : Here :
15.9%California :
17.9%
Health and Nutrition: Healthy diet rate : Rosamond:
47.1%California:
49.4%
Average overall health of teeth and gums : Rosamond:
44.8%California:
48.0%
People feeling badly about themselves : Rosamond:
22.6%California:
20.2%
People not drinking alcohol at all : This city:
10.7%California:
11.2%
Average hours sleeping at night : Overweight people : This city:
33.7%California:
31.5%
General health condition : Average condition of hearing : This city:
79.9%California:
80.9%
More about Health and Nutrition of Rosamond, CA Residents
4.83% of this county's 2021 resident taxpayers lived in other counties in 2020 ($47,246 average adjusted gross income )
Here:
4.83%California average:
5.19%
0.03% of residents moved from foreign countries ($334 average AGI )Kern County:
0.03%California average:
0.03%
Top counties from which taxpayers relocated into this county between 2020 and 2021:
4.56% of this county's 2020 resident taxpayers moved to other counties in 2021 ($61,654 average adjusted gross income )
Here:
4.56%California average:
6.14%
0.03% of residents moved to foreign countries ($342 average AGI )Kern County:
0.03%California average:
0.02%
Top counties to which taxpayers relocated from this county between 2020 and 2021:
Businesses in Rosamond, CA
Name Count Name Count
Albertsons 1 McDonald's 1 AutoZone 1 Penske 1 Curves 1 Rite Aid 1 Domino's Pizza 1 Subway 1 FedEx 1 Taco Bell 1 H&R Block 1 U-Haul 1 Jack In The Box 1 UPS 1 MasterBrand Cabinets 1
Strongest AM radio stations in Rosamond:
KIRN (670 AM; 35 kW; SIMI VALLEY, CA; Owner: LOTUS OXNARD CORP.)
KAVL (610 AM; 5 kW; LANCASTER, CA; Owner: CITICASTERS LICENSES, L.P.)
KLAC (570 AM; 50 kW; LOS ANGELES, CA; Owner: AMFM RADIO LICENSES, L.L.C.)
KSPN (710 AM; 50 kW; LOS ANGELES, CA; Owner: KABC-AM RADIO, INC.)
KFWB (980 AM; 50 kW; LOS ANGELES, CA; Owner: INFINITY BROADCASTING OPERATIONS, INC.)
KDIS (1110 AM; 50 kW; PASADENA, CA; Owner: ABC,INC.)
KFI (640 AM; 50 kW; LOS ANGELES, CA; Owner: CAPSTAR TX LIMITED PARTNERSHIP)
KTNQ (1020 AM; 50 kW; LOS ANGELES, CA; Owner: KTNQ-AM LICENSE CORP.)
KXTA (1150 AM; 50 kW; LOS ANGELES, CA; Owner: CITICASTERS LICENSES, L.P.)
KMPC (1540 AM; 50 kW; LOS ANGELES, CA; Owner: ROSE CITY RADIO CORPORATION)
KBLA (1580 AM; 50 kW; SANTA MONICA, CA)
KUTY (1470 AM; 5 kW; PALMDALE, CA; Owner: HIGH DESERT BROADCASTING LLC)
KPLS (830 AM; 50 kW; ORANGE, CA; Owner: CRN LICENSES, LLC)
Strongest FM radio stations in Rosamond:
KOSS (105.5 FM; ROSAMOND, CA; Owner: CONCORD MEDIA GROUP OF CALIFORNIA, INC.)
KLKX (93.5 FM; ROSAMOND, CA; Owner: HIGH DESERT BROADCASTING LLC)
KKZQ (100.1 FM; TEHACHAPI, CA; Owner: HIGH DESERT BROADCASTING LLC)
K202DJ (88.3 FM; PALMDALE, CA; Owner: SANTA MONICA COMMUNITY COLLEGE DIST.)
K266AH (101.1 FM; BENA, CA; Owner: CALVARY CHAPEL OF TWIN FALLS, INC.)
KCBS-FM (93.1 FM; LOS ANGELES, CA; Owner: INFINITY BROADCASTING OPERATIONS, INC.)
KMYX-FM (92.5 FM; ARVIN, CA; Owner: FARMWORKER EDUC. RADIO NETWORK, INC.)
KTQX (90.1 FM; BAKERSFIELD, CA; Owner: RADIO BILINGUE, INC.)
KSCA (101.9 FM; GLENDALE, CA; Owner: HBC LICENSE CORPORATION)
K212FA (90.3 FM; TEMPLE CITY, CA; Owner: EDUCATIONAL MEDIA FOUNDATION)
KLOS (95.5 FM; LOS ANGELES, CA; Owner: KLOS-FM RADIO, INC.)
KOST (103.5 FM; LOS ANGELES, CA; Owner: CAPSTAR TX LIMITED PARTNERSHIP)
KLVE (107.5 FM; LOS ANGELES, CA; Owner: KLVE-FM LICENSE CORP.)
KRTH-FM (101.1 FM; LOS ANGELES, CA; Owner: INFINITY BROADCASTING OPERATIONS, INC.)
KIIS-FM (102.7 FM; LOS ANGELES, CA; Owner: CITICASTERS LICENSES, L.P.)
KPCC (89.3 FM; PASADENA, CA; Owner: PASADENA AREA COMMUNITY COLLEGE DISTRICT)
KHHT (92.3 FM; LOS ANGELES, CA; Owner: AMFM RADIO LICENSES, L.L.C.)
KBIG-FM (104.3 FM; LOS ANGELES, CA; Owner: AMFM RADIO LICENSES, L.L.C.)
KMZT-FM (105.1 FM; LOS ANGELES, CA; Owner: MOUNT WILSON FM BROADCASTERS, INC.)
KPFK (90.7 FM; LOS ANGELES, CA; Owner: PACIFICA FOUNDATION, INC)
TV broadcast stations around Rosamond:
KTRO-LP (Channel 50; LANCASTER, CA; Owner: ROBERT D. ADELMAN)
KHIZ (Channel 64; BARSTOW, CA; Owner: SUNBELT TELEVISION, INC.)
FCC Registered Cell Phone Towers: 2 (
See the full list of FCC Registered Cell Phone Towers in Rosamond )
FCC Registered Antenna Towers: 69 (
See the full list of FCC Registered Antenna Towers )
FCC Registered Broadcast Land Mobile Towers: 7
2980 Desert St (Lat: 35.291083 Lon: -119.763194), Structure height: 8 m, Call Sign: WNXI317, Licensee ID: L00010141, Assigned Frequencies: 453.375 MHz, Grant Date: 06/29/2001, Expiration Date: 09/16/2011, Cancellation Date: 11/03/2003, Registrant: County Of Kern, 2601 Panorama Dr, Bakersfield, CA 93306, Phone: (805) 861-2500 7000 230th St W Tejon Ranch (Lat: 34.923583 Lon: -118.530917), Structure height: 9 m, Call Sign: WPCV262, Licensee ID: L00268433, Assigned Frequencies: 462.350 MHz, 467.350 MHz, Grant Date: 06/10/2003, Expiration Date: 07/29/2013, Cancellation Date: 11/07/2003, Registrant: Northrop Grumman Systems Corporation, 1299 Pennsylvania Avenue, N.W., 10th Floor, Washington, DC 20004, Phone: (202) 508-9519, Fax: (202) 508-9700, Email:
Lat: 34.862472 Lon: -118.255083, Call Sign: WQAP212, Licensee ID: L00085062, Assigned Frequencies: 461.362 MHz, 461.612 MHz, 461.737 MHz, 461.962 MHz, 461.987 MHz, 463.312 MHz, 463.687 MHz, 464.212 MHz, 464.712 MHz, 466.287 MHz... (+9 more), Grant Date: 07/13/2004, Expiration Date: 01/09/2005, Cancellation Date: 03/12/2005, Certifier: Frank D Garcia Jr, Registrant: Frank D Garcia Jr, 41758 12th St W Ste. A, Palmdale, CA 93551, Phone: (661) 940-3302, Fax: (661) 940-3922, Email:
Lat: 34.859444 Lon: -118.163611, Call Sign: WQLX316, Assigned Frequencies: 467.237 MHz, Grant Date: 05/18/2010, Expiration Date: 05/18/2020, Cancellation Date: 07/18/2020, Certifier: Richard Riccardi, Registrant: Fletcher, Heald & Hildreth, P.L.C., 1300 N. Seventeenth Street, 11th Floor, Arlington, VA 22209, Phone: (202) 828-5700, Fax: (703) 812-0468, Email:
Lat: 34.976167 Lon: -118.484250, Call Sign: WQPL842, Assigned Frequencies: 452.512 MHz, 456.487 MHz, 457.112 MHz, 462.487 MHz, 467.487 MHz, Grant Date: 04/07/2022, Expiration Date: 06/23/2032, Certifier: Ryan Leonard, Registrant: Radio Licensing Services, Milwaukie, OR 97269, Phone: (503) 794-3787, Fax: (503) 794-3759, Email:
Lat: 34.822250 Lon: -118.166500, Call Sign: WQYY992, Assigned Frequencies: 452.512 MHz, 457.287 MHz, 457.412 MHz, 462.487 MHz, 467.462 MHz, Grant Date: 03/08/2017, Expiration Date: 03/08/2027, Certifier: George Hardie Jr, Registrant: Mcintosh Communications, Inc., 4640 Arville, Ste. E, Las Vegas, NV 89103, Phone: (702) 253-5390, Fax: (702) 253-9140, Email:
Lat: 34.850250 Lon: -118.194861, Call Sign: WRMA587, Assigned Frequencies: 456.187 MHz, 451.437 MHz, 456.437 MHz, 451.537 MHz, 456.537 MHz, 464.012 MHz, Grant Date: 03/13/2021, Expiration Date: 03/13/2031, Certifier: Robert Irving, Registrant: Washington Radio Reports, Gettysburg, PA 17325, Phone: (717) 334-0668, Fax: (717) 334-6440, Email:
FCC Registered Microwave Towers: 364 (
See the full list of FCC Registered Microwave Towers in this town )
FCC Registered Maritime Coast & Aviation Ground Towers: 2 (
See the full list of FCC Registered Maritime Coast & Aviation Ground Towers )
FCC Registered Amateur Radio Licenses: 185 (
See the full list of FCC Registered Amateur Radio Licenses in Rosamond )
FAA Registered Aircraft Manufacturers and Dealers: 2 (
See the full list of FAA Registered Manufacturers and Dealers in Rosamond )
FAA Registered Aircraft: 102 (
See the full list of FAA Registered Aircraft )
Home Mortgage Disclosure Act Aggregated Statistics For Year 2009(Based on 1 full and 1 partial tracts) A) FHA, FSA/RHS & VA B) Conventional C) Refinancings D) Home Improvement Loans F) Non-occupant Loans on G) Loans On Manufactured Number Average Value Number Average Value Number Average Value Number Average Value Number Average Value Number Average Value
LOANS ORIGINATED 212 $159,701 68 $87,161 106 $182,799 2 $21,980 32 $71,871 9 $148,293 APPLICATIONS APPROVED, NOT ACCEPTED 7 $138,046 5 $83,878 15 $201,112 2 $18,060 1 $227,980 3 $116,970 APPLICATIONS DENIED 31 $140,367 18 $75,379 90 $164,948 6 $40,053 16 $107,482 19 $74,317 APPLICATIONS WITHDRAWN 28 $171,540 19 $99,742 41 $165,328 1 $69,260 12 $82,432 1 $169,480 FILES CLOSED FOR INCOMPLETENESS 2 $93,515 3 $115,167 4 $184,742 0 $0 2 $96,990 2 $49,495
Aggregated Statistics For Year 2008(Based on 1 full and 1 partial tracts) A) FHA, FSA/RHS & VA B) Conventional C) Refinancings D) Home Improvement Loans E) Loans on Dwellings For 5+ Families F) Non-occupant Loans on G) Loans On Manufactured Number Average Value Number Average Value Number Average Value Number Average Value Number Average Value Number Average Value Number Average Value
LOANS ORIGINATED 190 $209,245 90 $143,861 101 $164,902 20 $42,287 1 $599,940 34 $112,528 15 $133,311 APPLICATIONS APPROVED, NOT ACCEPTED 13 $202,532 16 $129,647 32 $174,818 7 $94,094 0 $0 6 $120,975 13 $82,762 APPLICATIONS DENIED 21 $214,771 60 $153,115 175 $204,312 43 $54,046 1 $149,980 28 $162,604 35 $82,959 APPLICATIONS WITHDRAWN 30 $216,760 30 $162,422 59 $199,920 2 $94,385 0 $0 6 $119,343 4 $121,788 FILES CLOSED FOR INCOMPLETENESS 3 $182,187 5 $118,908 14 $168,299 3 $41,217 0 $0 5 $127,466 2 $65,125
Aggregated Statistics For Year 2007(Based on 1 full and 1 partial tracts) A) FHA, FSA/RHS & VA B) Conventional C) Refinancings D) Home Improvement Loans E) Loans on Dwellings For 5+ Families F) Non-occupant Loans on G) Loans On Manufactured Number Average Value Number Average Value Number Average Value Number Average Value Number Average Value Number Average Value Number Average Value
LOANS ORIGINATED 33 $273,458 260 $175,856 360 $187,691 52 $128,769 3 $3,238,677 40 $193,499 50 $129,584 APPLICATIONS APPROVED, NOT ACCEPTED 2 $283,470 108 $146,703 89 $196,867 14 $82,659 0 $0 12 $169,261 32 $87,222 APPLICATIONS DENIED 2 $267,410 157 $188,316 325 $206,197 45 $105,676 0 $0 22 $207,119 33 $106,263 APPLICATIONS WITHDRAWN 5 $270,010 55 $188,405 139 $200,009 15 $141,158 0 $0 10 $187,810 11 $123,440 FILES CLOSED FOR INCOMPLETENESS 0 $0 12 $212,031 49 $235,650 4 $140,428 0 $0 4 $206,028 2 $168,975
Aggregated Statistics For Year 2006(Based on 1 full and 1 partial tracts) A) FHA, FSA/RHS & VA B) Conventional C) Refinancings D) Home Improvement Loans F) Non-occupant Loans on G) Loans On Manufactured Number Average Value Number Average Value Number Average Value Number Average Value Number Average Value Number Average Value
LOANS ORIGINATED 21 $232,165 550 $162,915 626 $182,299 93 $108,864 84 $169,904 54 $134,780 APPLICATIONS APPROVED, NOT ACCEPTED 4 $226,125 119 $145,812 127 $182,327 16 $105,699 26 $157,786 31 $99,451 APPLICATIONS DENIED 1 $400,330 229 $148,819 353 $192,731 76 $105,683 50 $151,010 56 $108,280 APPLICATIONS WITHDRAWN 2 $252,265 107 $173,292 309 $207,943 33 $160,218 25 $209,734 11 $145,189 FILES CLOSED FOR INCOMPLETENESS 1 $239,620 22 $167,537 59 $188,091 4 $203,125 4 $154,682 3 $201,550
Aggregated Statistics For Year 2005(Based on 1 full and 1 partial tracts) A) FHA, FSA/RHS & VA B) Conventional C) Refinancings D) Home Improvement Loans E) Loans on Dwellings For 5+ Families F) Non-occupant Loans on G) Loans On Manufactured Number Average Value Number Average Value Number Average Value Number Average Value Number Average Value Number Average Value Number Average Value
LOANS ORIGINATED 23 $196,732 627 $142,486 726 $163,944 121 $107,398 3 $684,930 131 $142,782 38 $101,373 APPLICATIONS APPROVED, NOT ACCEPTED 5 $200,176 131 $127,345 131 $164,436 20 $112,701 0 $0 24 $169,117 42 $82,066 APPLICATIONS DENIED 1 $209,910 155 $141,597 302 $167,601 75 $89,924 1 $3,599,640 32 $127,172 25 $104,963 APPLICATIONS WITHDRAWN 1 $201,260 149 $152,111 326 $159,988 49 $124,512 0 $0 47 $160,571 18 $115,585 FILES CLOSED FOR INCOMPLETENESS 0 $0 22 $147,006 56 $167,800 6 $35,280 0 $0 3 $124,873 2 $131,190
Aggregated Statistics For Year 2004(Based on 1 full and 1 partial tracts) A) FHA, FSA/RHS & VA B) Conventional C) Refinancings D) Home Improvement Loans E) Loans on Dwellings For 5+ Families F) Non-occupant Loans on G) Loans On Manufactured Number Average Value Number Average Value Number Average Value Number Average Value Number Average Value Number Average Value Number Average Value
LOANS ORIGINATED 34 $148,487 493 $118,914 820 $129,770 130 $70,719 3 $603,273 84 $130,115 18 $97,215 APPLICATIONS APPROVED, NOT ACCEPTED 2 $155,110 60 $114,054 153 $124,464 10 $53,209 0 $0 14 $121,123 13 $91,649 APPLICATIONS DENIED 5 $139,990 99 $110,032 362 $126,706 77 $69,904 4 $880,162 32 $100,135 25 $94,069 APPLICATIONS WITHDRAWN 9 $145,514 63 $128,348 319 $133,535 34 $74,758 1 $2,999,700 15 $118,929 13 $102,634 FILES CLOSED FOR INCOMPLETENESS 0 $0 16 $136,872 69 $123,251 5 $33,192 0 $0 0 $0 2 $106,460
Aggregated Statistics For Year 2003(Based on 1 full and 1 partial tracts) A) FHA, FSA/RHS & VA B) Conventional C) Refinancings D) Home Improvement Loans E) Loans on Dwellings For 5+ Families F) Non-occupant Loans on Number Average Value Number Average Value Number Average Value Number Average Value Number Average Value Number Average Value
LOANS ORIGINATED 139 $137,791 295 $93,863 953 $102,549 33 $46,878 3 $1,134,553 118 $91,970 APPLICATIONS APPROVED, NOT ACCEPTED 9 $126,981 35 $101,302 161 $104,375 12 $26,748 0 $0 29 $80,785 APPLICATIONS DENIED 12 $133,352 61 $88,960 369 $103,875 47 $33,500 3 $1,068,227 22 $82,541 APPLICATIONS WITHDRAWN 18 $115,584 55 $86,542 327 $111,265 9 $42,061 0 $0 12 $116,670 FILES CLOSED FOR INCOMPLETENESS 0 $0 7 $101,356 65 $100,168 3 $56,660 0 $0 7 $79,647
Aggregated Statistics For Year 2002(Based on 1 full and 1 partial tracts) A) FHA, FSA/RHS & VA B) Conventional C) Refinancings D) Home Improvement Loans E) Loans on Dwellings For 5+ Families F) Non-occupant Loans on Number Average Value Number Average Value Number Average Value Number Average Value Number Average Value Number Average Value
LOANS ORIGINATED 171 $116,202 199 $87,235 414 $91,743 19 $38,062 2 $168,985 48 $76,585 APPLICATIONS APPROVED, NOT ACCEPTED 12 $120,897 18 $78,482 83 $104,341 9 $22,578 0 $0 7 $72,683 APPLICATIONS DENIED 8 $103,221 37 $75,215 241 $90,327 30 $18,832 1 $339,970 13 $82,170 APPLICATIONS WITHDRAWN 15 $116,452 25 $73,406 191 $99,850 10 $21,946 0 $0 7 $73,020 FILES CLOSED FOR INCOMPLETENESS 0 $0 5 $72,738 32 $101,981 0 $0 0 $0 3 $74,150
Aggregated Statistics For Year 2001(Based on 1 full and 1 partial tracts) A) FHA, FSA/RHS & VA B) Conventional C) Refinancings D) Home Improvement Loans E) Loans on Dwellings For 5+ Families F) Non-occupant Loans on Number Average Value Number Average Value Number Average Value Number Average Value Number Average Value Number Average Value
LOANS ORIGINATED 181 $106,759 106 $84,507 277 $87,220 16 $22,216 0 $0 44 $81,850 APPLICATIONS APPROVED, NOT ACCEPTED 9 $101,167 20 $75,634 45 $81,151 6 $27,330 3 $145,987 5 $70,186 APPLICATIONS DENIED 6 $88,833 36 $65,026 180 $70,140 28 $24,396 2 $164,485 10 $60,882 APPLICATIONS WITHDRAWN 17 $104,685 23 $80,554 133 $87,294 10 $27,878 0 $0 8 $98,584 FILES CLOSED FOR INCOMPLETENESS 0 $0 1 $117,990 28 $85,846 0 $0 2 $198,255 3 $83,210
Aggregated Statistics For Year 2000(Based on 1 full and 1 partial tracts) A) FHA, FSA/RHS & VA B) Conventional C) Refinancings D) Home Improvement Loans F) Non-occupant Loans on Number Average Value Number Average Value Number Average Value Number Average Value Number Average Value
LOANS ORIGINATED 130 $91,333 98 $69,684 61 $62,605 22 $22,968 16 $62,194 APPLICATIONS APPROVED, NOT ACCEPTED 8 $102,240 9 $85,253 21 $64,904 19 $25,899 1 $75,990 APPLICATIONS DENIED 9 $90,583 41 $58,409 133 $60,304 32 $24,166 9 $68,966 APPLICATIONS WITHDRAWN 16 $101,209 20 $67,922 64 $64,808 6 $26,330 2 $72,495 FILES CLOSED FOR INCOMPLETENESS 3 $89,390 3 $76,783 13 $71,128 1 $43,000 1 $43,000
Aggregated Statistics For Year 1999(Based on 1 full and 1 partial tracts) A) FHA, FSA/RHS & VA B) Conventional C) Refinancings D) Home Improvement Loans E) Loans on Dwellings For 5+ Families F) Non-occupant Loans on Number Average Value Number Average Value Number Average Value Number Average Value Number Average Value Number Average Value
LOANS ORIGINATED 122 $73,550 94 $64,397 125 $77,393 40 $26,412 4 $102,122 25 $71,060 APPLICATIONS APPROVED, NOT ACCEPTED 3 $78,217 7 $67,949 37 $68,036 18 $25,642 3 $69,430 2 $67,305 APPLICATIONS DENIED 6 $65,878 38 $56,665 122 $63,153 46 $17,746 0 $0 8 $50,888 APPLICATIONS WITHDRAWN 7 $72,029 12 $57,955 89 $73,912 5 $32,048 1 $84,290 2 $96,865 FILES CLOSED FOR INCOMPLETENESS 0 $0 4 $51,568 23 $76,733 1 $28,100 0 $0 1 $28,100
Detailed HMDA statistics for the following Tracts:
0055.06
, 0058.00
Private Mortgage Insurance Companies Aggregated Statistics For Year 2009(Based on 1 full and 1 partial tracts) A) Conventional B) Refinancings Number Average Value Number Average Value
LOANS ORIGINATED 11 $107,593 1 $156,980 APPLICATIONS APPROVED, NOT ACCEPTED 3 $159,983 0 $0 APPLICATIONS DENIED 2 $79,340 0 $0 APPLICATIONS WITHDRAWN 1 $48,000 0 $0 FILES CLOSED FOR INCOMPLETENESS 1 $121,990 0 $0
Aggregated Statistics For Year 2008(Based on 1 full and 1 partial tracts) A) Conventional B) Refinancings C) Non-occupant Loans on D) Loans On Manufactured Number Average Value Number Average Value Number Average Value Number Average Value
LOANS ORIGINATED 34 $221,419 10 $202,499 3 $192,463 1 $129,010 APPLICATIONS APPROVED, NOT ACCEPTED 34 $276,833 19 $245,662 0 $0 1 $178,440 APPLICATIONS DENIED 5 $160,514 1 $172,980 1 $160,830 0 $0 APPLICATIONS WITHDRAWN 1 $121,990 1 $356,630 0 $0 0 $0 FILES CLOSED FOR INCOMPLETENESS 0 $0 2 $196,980 0 $0 0 $0
Aggregated Statistics For Year 2007(Based on 1 full and 1 partial tracts) A) Conventional B) Refinancings C) Non-occupant Loans on D) Loans On Manufactured Number Average Value Number Average Value Number Average Value Number Average Value
LOANS ORIGINATED 41 $264,661 40 $263,526 3 $215,163 1 $246,880 APPLICATIONS APPROVED, NOT ACCEPTED 5 $255,814 11 $275,791 2 $370,965 1 $101,580 APPLICATIONS DENIED 1 $416,870 1 $239,980 0 $0 0 $0 APPLICATIONS WITHDRAWN 3 $323,103 1 $311,940 0 $0 0 $0 FILES CLOSED FOR INCOMPLETENESS 0 $0 0 $0 0 $0 0 $0
Aggregated Statistics For Year 2006(Based on 1 full and 1 partial tracts) A) Conventional B) Refinancings C) Non-occupant Loans on D) Loans On Manufactured Number Average Value Number Average Value Number Average Value Number Average Value
LOANS ORIGINATED 15 $270,353 20 $248,699 3 $162,983 2 $228,685 APPLICATIONS APPROVED, NOT ACCEPTED 8 $290,634 5 $255,696 0 $0 2 $176,415 APPLICATIONS DENIED 0 $0 0 $0 0 $0 0 $0 APPLICATIONS WITHDRAWN 1 $204,240 1 $290,940 0 $0 0 $0 FILES CLOSED FOR INCOMPLETENESS 0 $0 0 $0 0 $0 0 $0
Aggregated Statistics For Year 2005(Based on 1 full and 1 partial tracts) A) Conventional B) Refinancings C) Non-occupant Loans on D) Loans On Manufactured Number Average Value Number Average Value Number Average Value Number Average Value
LOANS ORIGINATED 28 $202,267 26 $199,355 5 $191,076 2 $152,775 APPLICATIONS APPROVED, NOT ACCEPTED 5 $183,746 7 $204,143 2 $171,985 1 $156,980 APPLICATIONS DENIED 1 $209,950 0 $0 0 $0 0 $0 APPLICATIONS WITHDRAWN 1 $355,190 3 $201,980 0 $0 0 $0 FILES CLOSED FOR INCOMPLETENESS 0 $0 0 $0 0 $0 0 $0
Aggregated Statistics For Year 2004(Based on 1 full and 1 partial tracts) A) Conventional B) Refinancings C) Non-occupant Loans on D) Loans On Manufactured Number Average Value Number Average Value Number Average Value Number Average Value
LOANS ORIGINATED 47 $169,833 36 $147,171 6 $142,923 0 $0 APPLICATIONS APPROVED, NOT ACCEPTED 7 $128,434 8 $139,765 4 $112,488 1 $54,860 APPLICATIONS DENIED 2 $318,575 0 $0 0 $0 0 $0 APPLICATIONS WITHDRAWN 3 $179,560 3 $139,140 0 $0 0 $0 FILES CLOSED FOR INCOMPLETENESS 0 $0 0 $0 0 $0 0 $0
Aggregated Statistics For Year 2003(Based on 1 full and 1 partial tracts) A) Conventional B) Refinancings C) Non-occupant Loans on Number Average Value Number Average Value Number Average Value
LOANS ORIGINATED 53 $124,708 73 $121,908 11 $104,100 APPLICATIONS APPROVED, NOT ACCEPTED 4 $134,070 16 $113,819 1 $133,380 APPLICATIONS DENIED 1 $145,070 0 $0 1 $121,990 APPLICATIONS WITHDRAWN 2 $100,105 2 $117,990 0 $0 FILES CLOSED FOR INCOMPLETENESS 0 $0 0 $0 0 $0
Aggregated Statistics For Year 2002(Based on 1 full and 1 partial tracts) A) Conventional B) Refinancings C) Non-occupant Loans on Number Average Value Number Average Value Number Average Value
LOANS ORIGINATED 57 $116,535 49 $115,404 5 $71,754 APPLICATIONS APPROVED, NOT ACCEPTED 5 $70,490 11 $101,756 2 $94,905 APPLICATIONS DENIED 0 $0 0 $0 0 $0 APPLICATIONS WITHDRAWN 2 $181,485 3 $116,947 0 $0 FILES CLOSED FOR INCOMPLETENESS 0 $0 1 $84,740 0 $0
Aggregated Statistics For Year 2001(Based on 1 full and 1 partial tracts) A) Conventional B) Refinancings C) Non-occupant Loans on Number Average Value Number Average Value Number Average Value
LOANS ORIGINATED 50 $95,280 20 $108,924 9 $69,309 APPLICATIONS APPROVED, NOT ACCEPTED 2 $171,085 7 $113,826 0 $0 APPLICATIONS DENIED 2 $111,490 1 $86,990 1 $121,990 APPLICATIONS WITHDRAWN 0 $0 2 $101,990 0 $0 FILES CLOSED FOR INCOMPLETENESS 1 $125,980 0 $0 0 $0
Aggregated Statistics For Year 2000(Based on 1 full and 1 partial tracts) A) Conventional B) Refinancings C) Non-occupant Loans on Number Average Value Number Average Value Number Average Value
LOANS ORIGINATED 44 $79,238 4 $91,360 5 $59,382 APPLICATIONS APPROVED, NOT ACCEPTED 1 $75,990 1 $89,630 1 $75,990 APPLICATIONS DENIED 3 $59,617 0 $0 0 $0 APPLICATIONS WITHDRAWN 0 $0 0 $0 0 $0 FILES CLOSED FOR INCOMPLETENESS 0 $0 0 $0 0 $0
Aggregated Statistics For Year 1999(Based on 1 full and 1 partial tracts) A) Conventional B) Refinancings C) Non-occupant Loans on Number Average Value Number Average Value Number Average Value
LOANS ORIGINATED 45 $80,059 11 $86,064 6 $58,612 APPLICATIONS APPROVED, NOT ACCEPTED 5 $92,424 2 $79,385 0 $0 APPLICATIONS DENIED 3 $41,980 0 $0 2 $39,235 APPLICATIONS WITHDRAWN 4 $71,208 0 $0 0 $0 FILES CLOSED FOR INCOMPLETENESS 0 $0 0 $0 0 $0
Detailed PMIC statistics for the following Tracts:
0055.06
, 0058.00
Most common first names in Rosamond, CA among deceased individuals Name Count Lived (average)
William 56 72.5 years John 49 72.3 years Robert 43 67.6 years James 37 69.5 years Mary 29 74.6 years George 25 70.6 years Ruth 21 78.6 years Donald 19 67.7 years Dorothy 19 73.3 years Charles 19 70.1 years
Most common last names in Rosamond, CA among deceased individuals Last name Count Lived (average)
Smith 17 68.4 years Johnson 16 71.8 years Davis 13 74.6 years Williams 13 69.7 years Anderson 10 70.5 years Young 10 81.6 years Brown 9 74.1 years King 9 73.2 years Murphy 8 70.1 years Jones 8 68.4 years
Rosamond compared to California state average:
Median house value below state average. Black race population percentage significantly above state average. Hispanic race population percentage above state average. Foreign-born population percentage below state average. House age below state average.
#43 on the list of "Top 101 cities with largest percentage of males in occupations: installation, maintenance, and repair occupations (population 5,000+)"
#91 on the list of "Top 100 low-educated but high-earning cities (pop. 5,000+)"
#6 on the list of "Top 101 counties with the highest Particulate Matter (PM10 ) Annual air pollution readings in 2012 (µg/m3 )"
#13 on the list of "Top 101 counties with the highest carbon monoxide air pollution readings in 2012 (ppm)"
#13 on the list of "Top 101 counties with the highest lead air pollution readings in 2012 (µg/m3 )"
#13 on the list of "Top 101 counties with the lowest lead air pollution readings in 2012 (µg/m3 )"
#17 on the list of "Top 101 counties with the highest ground withdrawal of fresh water for public supply"
Top Patent Applicants
Scott Loftin (7)
Steven Fisher (4)
Scott M. Loftin (3)
Heinz Richard Miltner (2)
Julie Lynn Adams (2)
Vickie Real (2)
Vince Real (2)
George Ismael (1)
Steve Fisher (1)
Zachary Blackwell (1)
Total of 31 patent applications in 2008-2024.


 Recent articles from our blog. Our writers, many of them Ph.D. graduates or candidates, create easy-to-read articles on a wide variety of topics.

 , pop. 150,931).


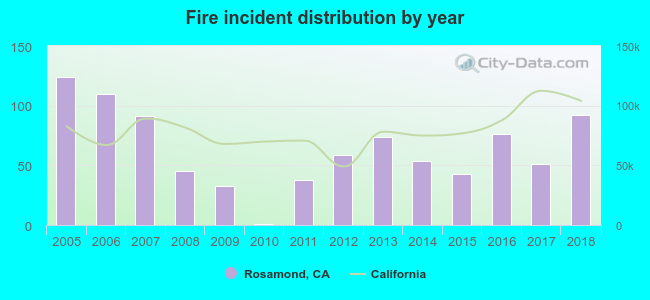 Based on the data from the years 2005 - 2018 the average number of fires per year is 64. The highest number of reported fires - 124 took place in 2005, and the least - 1 in 2010. The data has a dropping trend.
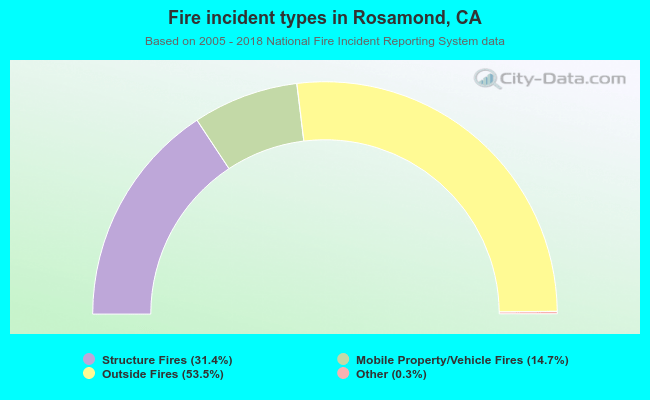 When looking into fire subcategories, the most reports belonged to: Outside Fires (53.5%), and Structure Fires (31.4%).