Estimated zip code population in 2022: 42,162 Zip code population in 2010: 39,341 Zip code population in 2000: 35,104
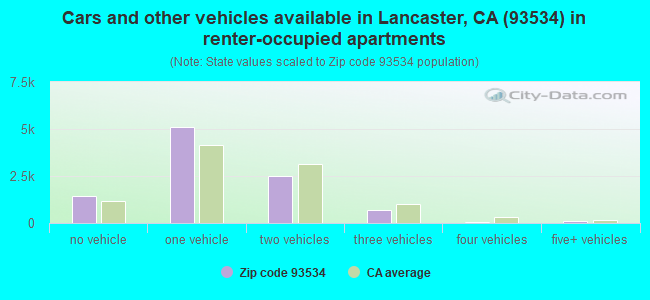
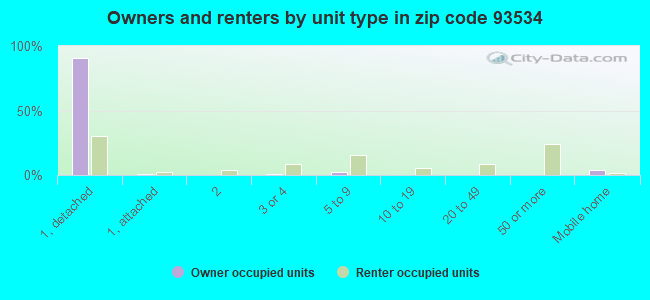
Houses and condos: 16,665 Renter-occupied apartments: 9,901
% of renters here:
65%
State:
44%
March 2022 cost of living index in zip code 93534: 129.0 (high, U.S. average is 100)
Land area: 17.8 sq. mi. Water area: 0.4 sq. mi.
Population density: 2,373 people per square mile
(low).
OSM Map
General Map
Google Map
MSN Map
OSM Map
General Map
Google Map
MSN Map
OSM Map
General Map
Google Map
MSN Map
OSM Map
General Map
Google Map
MSN Map
Please wait while loading the map...
Real estate property taxes paid for housing units in 2022:
This zip code:
0.9% ($2,775)
California:
0.7% ($4,831)
Median real estate property taxes paid for housing units with mortgages in 2022: $2,833 (0.9%) Median real estate property taxes paid for housing units with no mortgage in 2022: $2,654 (0.9%)
Averages for the 2020 tax year for zip code 93534, filed in 2021:
Average Adjusted Gross Income (AGI) in 2020: $44,644 (Individual Income Tax Returns)
Here:
$44,644
State:
$95,910
Salary/wage: $42,016 (reported on 80.8% of returns)
Here:
$42,016
State:
$77,331
(% of AGI for various income ranges: 1058.8% for AGIs below $25k, 3626.7% for AGIs $25k-50k, 7070.4% for AGIs $50k-75k, 10142.8% for AGIs $75k-100k, 17904.2% for AGIs $100k-200k, 72547.5% for AGIs over 200k)
Taxable interest for individuals: $473 (reported on 22.4% of returns)
This zip code:
$473
California:
$2,294
(% of AGI for various income ranges: 4.9% for AGIs below $25k, 5.1% for AGIs $25k-50k, 20.4% for AGIs $50k-75k, 33.3% for AGIs $75k-100k, 64.2% for AGIs $100k-200k, 527.5% for AGIs over 200k)
Ordinary dividends: $2,456 (reported on 5.7% of returns)
Here:
$2,456
State:
$10,949
(% of AGI for various income ranges: 4.8% for AGIs below $25k, 7.1% for AGIs $25k-50k, 13.5% for AGIs $50k-75k, 35.1% for AGIs $75k-100k, 82.7% for AGIs $100k-200k, 1835.0% for AGIs over 200k)
Net capital gain/loss in AGI: +$6,923 (reported on 6.7% of returns)
Here:
+$6,923
State:
+$49,306
(% of AGI for various income ranges: 0.6% for AGIs below $25k, 0.9% for AGIs $25k-50k, 21.2% for AGIs $50k-75k, 40.4% for AGIs $75k-100k, 291.6% for AGIs $100k-200k, 12970.0% for AGIs over 200k)
Profit/loss from business: +$7,193 (reported on 18.4% of returns)
Here:
+$7,193
State:
+$15,671
(% of AGI for various income ranges: 170.1% for AGIs below $25k, 124.5% for AGIs $25k-50k, 132.6% for AGIs $50k-75k, 194.4% for AGIs $75k-100k, 260.7% for AGIs $100k-200k, 6340.0% for AGIs over 200k)
Taxable individual retirement arrangement distribution: $13,300 (reported on 3.0% of returns)
93534:
$13,300
California:
$23,505
(% of AGI for various income ranges: 11.3% for AGIs below $25k, 23.7% for AGIs $25k-50k, 55.5% for AGIs $50k-75k, 125.3% for AGIs $75k-100k, 439.6% for AGIs $100k-200k)
Total itemized deductions: $25,690 (reported on 7.7% of returns)
Here:
$25,690
State:
$39,517
(% of AGI for various income ranges: 34.1% for AGIs below $25k, 136.4% for AGIs $25k-50k, 416.5% for AGIs $50k-75k, 775.4% for AGIs $75k-100k, 1250.7% for AGIs $100k-200k, 7747.5% for AGIs over 200k)
Charity contributions: $6,192 (reported on 6.0% of returns)
Here:
$6,192
State:
$12,598
(% of AGI for various income ranges: 2.3% for AGIs below $25k, 17.1% for AGIs $25k-50k, 64.2% for AGIs $50k-75k, 149.8% for AGIs $75k-100k, 274.9% for AGIs $100k-200k, 2725.0% for AGIs over 200k)
Taxes paid: $7,320 (reported on 7.7% of returns)
93534:
$7,320
State:
$8,807
(% of AGI for various income ranges: 6.5% for AGIs below $25k, 32.8% for AGIs $25k-50k, 121.1% for AGIs $50k-75k, 237.6% for AGIs $75k-100k, 404.0% for AGIs $100k-200k, 1705.0% for AGIs over 200k)
Earned income credit: $2,573 (reported on 28.4% of returns)
Here:
$2,573
State:
$2,074
(% of AGI for various income ranges: 156.3% for AGIs below $25k, 102.7% for AGIs $25k-50k, 1.5% for AGIs $50k-75k)
Percentage of individuals using paid preparers for their 2020 taxes: 93.7%
Here:
94%
State:
92%
(% for various income ranges: 92.4% for AGIs below $25k, 94.3% for AGIs $25k-50k, 94.8% for AGIs $50k-75k, 95.6% for AGIs $75k-100k, 94.4% for AGIs $100k-200k, 92.9% for AGIs over 200k)
Averages for the 2012 tax year for zip code 93534, filed in 2013:
Average Adjusted Gross Income (AGI) in 2012: $36,664 (Individual Income Tax Returns)
Here:
$36,664
State:
$72,726
Salary/wage: $35,064 (reported on 81.1% of returns)
Here:
$35,064
State:
$59,079
(% of AGI for various income ranges: 69.6% for AGIs below $25k, 84.2% for AGIs $25k-50k, 82.2% for AGIs $50k-75k, 80.0% for AGIs $75k-100k, 79.4% for AGIs $100k-200k, 49.8% for AGIs over 200k)
Taxable interest for individuals: $735 (reported on 22.8% of returns)
This zip code:
$735
California:
$2,146
(% of AGI for various income ranges: 0.4% for AGIs below $25k, 0.3% for AGIs $25k-50k, 0.3% for AGIs $50k-75k, 0.4% for AGIs $75k-100k, 0.6% for AGIs $100k-200k, 1.6% for AGIs over 200k)
Ordinary dividends: $3,277 (reported on 7.1% of returns)
Here:
$3,277
State:
$9,308
(% of AGI for various income ranges: 0.4% for AGIs below $25k, 0.4% for AGIs $25k-50k, 0.4% for AGIs $50k-75k, 0.4% for AGIs $75k-100k, 0.8% for AGIs $100k-200k, 3.1% for AGIs over 200k)
Net capital gain/loss in AGI: +$3,077 (reported on 5.4% of returns)
Here:
+$3,077
State:
+$30,460
(% of AGI for various income ranges: 0.2% for AGIs $50k-75k, 0.1% for AGIs $75k-100k, 0.2% for AGIs $100k-200k, 6.0% for AGIs over 200k)
Profit/loss from business: +$8,603 (reported on 19.8% of returns)
Here:
+$8,603
State:
+$17,064
(% of AGI for various income ranges: 18.3% for AGIs below $25k, 1.5% for AGIs $25k-50k, 1.4% for AGIs $50k-75k, 1.0% for AGIs $75k-100k, 2.3% for AGIs $100k-200k, 1.5% for AGIs over 200k)
Taxable individual retirement arrangement distribution: $11,894 (reported on 4.8% of returns)
93534:
$11,894
California:
$19,557
(% of AGI for various income ranges: 1.0% for AGIs below $25k, 1.0% for AGIs $25k-50k, 1.5% for AGIs $50k-75k, 1.6% for AGIs $75k-100k, 2.3% for AGIs $100k-200k, 3.4% for AGIs over 200k)
Total itemized deductions: $20,500 (28% of AGI, reported on 24.7% of returns)
Here:
$20,500
State:
$34,004
Here:
28.1% of AGI
State:
22.7% of AGI
(% of AGI for various income ranges: 5.9% for AGIs below $25k, 11.6% for AGIs $25k-50k, 16.0% for AGIs $50k-75k, 16.8% for AGIs $75k-100k, 19.3% for AGIs $100k-200k, 17.0% for AGIs over 200k)
Charity contributions: $3,313 (reported on 20.2% of returns)
Here:
$3,313
State:
$4,659
(% of AGI for various income ranges: 0.5% for AGIs below $25k, 1.4% for AGIs $25k-50k, 2.0% for AGIs $50k-75k, 2.3% for AGIs $75k-100k, 2.8% for AGIs $100k-200k, 2.7% for AGIs over 200k)
Taxes paid: $5,931 (reported on 24.6% of returns)
93534:
$5,931
State:
$14,448
(% of AGI for various income ranges: 1.0% for AGIs below $25k, 2.5% for AGIs $25k-50k, 3.9% for AGIs $50k-75k, 5.2% for AGIs $75k-100k, 6.9% for AGIs $100k-200k, 8.1% for AGIs over 200k)
Earned income credit: $2,805 (reported on 36.4% of returns)
Here:
$2,805
State:
$2,286
(% of AGI for various income ranges: 12.9% for AGIs below $25k, 1.7% for AGIs $25k-50k)
Percentage of individuals using paid preparers for their 2012 taxes: 66.0%
Here:
66%
State:
64%
(% for various income ranges: 65.3% for AGIs below $25k, 65.6% for AGIs $25k-50k, 65.9% for AGIs $50k-75k, 67.5% for AGIs $75k-100k, 70.4% for AGIs $100k-200k, 88.9% for AGIs over 200k)
Averages for the 2004 tax year for zip code 93534, filed in 2005:
Average Adjusted Gross Income (AGI) in 2004: $36,172 (Individual Income Tax Returns)
Here:
$36,172
State:
$58,600
Salary/wage: $33,658 (reported on 84.9% of returns)
Here:
$33,658
State:
$49,455
(% of AGI for various income ranges: 98.8% for AGIs below $10k, 78.1% for AGIs $10k-25k, 85.0% for AGIs $25k-50k, 84.7% for AGIs $50k-75k, 83.2% for AGIs $75k-100k, 61.5% for AGIs over 100k)
Taxable interest for individuals: $1,210 (reported on 33.6% of returns)
This zip code:
$1,210
California:
$2,365
(% of AGI for various income ranges: 3.8% for AGIs below $10k, 1.1% for AGIs $10k-25k, 0.8% for AGIs $25k-50k, 1.0% for AGIs $50k-75k, 0.9% for AGIs $75k-100k, 1.6% for AGIs over 100k)
Taxable dividends: $1,770 (reported on 11.5% of returns)
Here:
$1,770
State:
$4,746
(% of AGI for various income ranges: 1.5% for AGIs below $10k, 0.5% for AGIs $10k-25k, 0.4% for AGIs $25k-50k, 0.4% for AGIs $50k-75k, 0.6% for AGIs $75k-100k, 0.8% for AGIs over 100k)
Net capital gain/loss: +$9,619 (reported on 9.9% of returns)
Here:
+$9,619
State:
+$23,418
(% of AGI for various income ranges: -0.9% for AGIs below $10k, 0.0% for AGIs $10k-25k, 0.3% for AGIs $25k-50k, 0.8% for AGIs $50k-75k, 1.6% for AGIs $75k-100k, 10.0% for AGIs over 100k)
Profit/loss from business: +$8,031 (reported on 13.8% of returns)
Here:
+$8,031
State:
+$16,826
(% of AGI for various income ranges: 7.9% for AGIs below $10k, 7.1% for AGIs $10k-25k, 1.9% for AGIs $25k-50k, 1.2% for AGIs $50k-75k, 2.2% for AGIs $75k-100k, 3.7% for AGIs over 100k)
IRA payment deduction: $2,703 (reported on 1.6% of returns)
93534:
$2,703
California:
$3,192
(% of AGI for various income ranges: 0.1% for AGIs $10k-25k, 0.1% for AGIs $25k-50k, 0.1% for AGIs $50k-75k, 0.1% for AGIs $75k-100k, 0.2% for AGIs over 100k)
Self-employed pension: $11,094 (reported on 0.2% of returns)
Here:
$11,094
California:
$17,688
Total itemized deductions: $19,366 (30% of AGI, reported on 33.5% of returns)
Here:
$19,366
State:
$28,113
Here:
29.5% of AGI
State:
25.3% of AGI
(% of AGI for various income ranges: 12.4% for AGIs below $10k, 10.1% for AGIs $10k-25k, 17.8% for AGIs $25k-50k, 21.3% for AGIs $50k-75k, 21.3% for AGIs $75k-100k, 18.3% for AGIs over 100k)
Charity contributions deductions: $3,033 (4% of AGI, reported on 29.4% of returns)
Here:
$3,033
State:
$3,923
Here:
4.4% of AGI
State:
3.3% of AGI
(% of AGI for various income ranges: 0.6% for AGIs below $10k, 1.0% for AGIs $10k-25k, 2.0% for AGIs $25k-50k, 3.0% for AGIs $50k-75k, 3.2% for AGIs $75k-100k, 3.2% for AGIs over 100k)
Total tax: $4,849 (reported on 66.1% of returns)
93534:
$4,849
State:
$10,761
(% of AGI for various income ranges: 3.2% for AGIs below $10k, 3.6% for AGIs $10k-25k, 5.4% for AGIs $25k-50k, 8.0% for AGIs $50k-75k, 9.9% for AGIs $75k-100k, 17.4% for AGIs over 100k)
Earned income credit: $1,951 (reported on 27.2% of returns)
Here:
$1,951
State:
$1,763
Percentage of individuals using paid preparers for their 2004 taxes: 70.6%
Here:
71%
State:
66%
(% for various income ranges: 64.8% for AGIs below $10k, 71.3% for AGIs $10k-25k, 72.4% for AGIs $25k-50k, 72.3% for AGIs $50k-75k, 70.3% for AGIs $75k-100k, 75.4% for AGIs over 100k)
Likely homosexual households (counted as self-reported same-sex unmarried-partner households)
Lesbian couples: 0.1% of all households
Gay men: 0.0% of all households
Household received Food Stamps/SNAP in the past 12 months: 4,043 Household did not receive Food Stamps/SNAP in the past 12 months: 11,674
Women who had a birth in the past 12 months: 601 (236 now married, 368 unmarried) Women who did not have a birth in the past 12 months: 9,190 (2,910 now married, 6,311 unmarried)
Housing units in zip code 93534 with a mortgage: 3,883 (111 second mortgage, 7 home equity loan, 99 both second mortgage and home equity loan) Median monthly owner costs for units with a mortgage: $1,692 Median monthly owner costs for units without a mortgage: $537
Residents with income below the poverty level in 2022:
This zip code:
22.1%
Whole state:
12.2%
Residents with income below 50% of the poverty level in 2022:
This zip code:
10.2%
Whole state:
6.2%
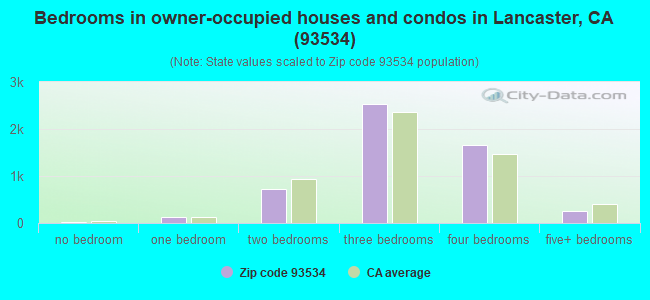
Median number of rooms in houses and condos:
Here:
6.2
State:
6.0
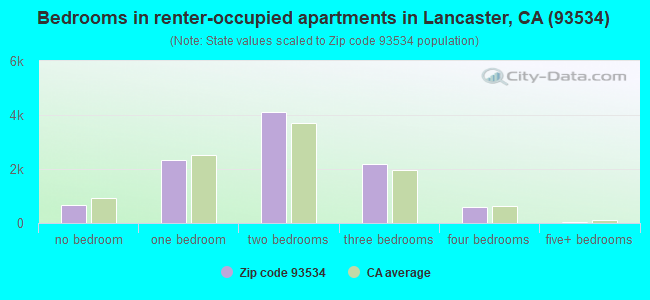
Median number of rooms in apartments:
Here:
4.0
State:
3.9
Notable locations in this zip code not listed on our city pages
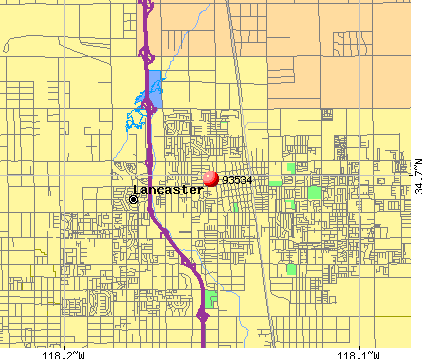
Notable locations in zip code 93534: Lancaster Water Reclamation Plant (A), Clarke Club (B), Hoffman Club (C), Lancaster Performing Arts Center (D), Lancaster Museum (E), Lancaster City Hall (F), Lancaster Branch County of Los Angeles Public Library (G), Antelope Valley County Administration Center (H), American Medical Response Antelope Valley (I), Antelope Ambulance Service (J), Rescue Services International (K), Los Angeles County Fire Department Station 129 (L), Los Angeles County Fire Department Station 33 (M). Display/hide their locations on the map
Churches in zip code 93534 include: Antelope Valley Christian Center (A), Living Word Fellowship Church (B), Grace Lutheran Church (C), Grace Chapel (D), Growing Valley Baptist Church (E), Our Savior's Lutheran Church (F), Church of Jesus Christ of Latter Day Saints (G), Lancaster Presbyterian Church (H), Sacred Heart Catholic Church (I). Display/hide their locations on the map
4,263 married couples with children.
5,144 single-parent households (634 men, 4,510 women).
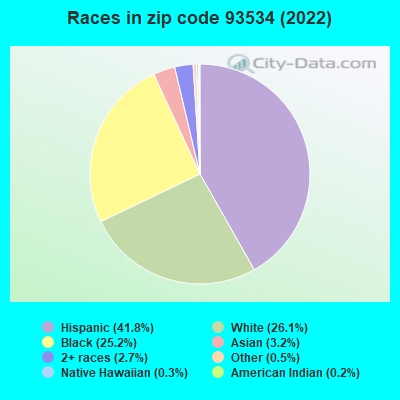
68.1% of residents of 93534 zip code speak English at home.
27.4% of residents speak Spanish at home (57% very well, 24% well, 11% not well, 8% not at all).
0.9% of residents speak other Indo-European language at home (64% very well, 30% well, 5% not well, 2% not at all).
2.3% of residents speak Asian or Pacific Island language at home (46% very well, 32% well, 19% not well, 3% not at all).
0.7% of residents speak other language at home (38% very well, 11% well, 20% not well, 31% not at all).
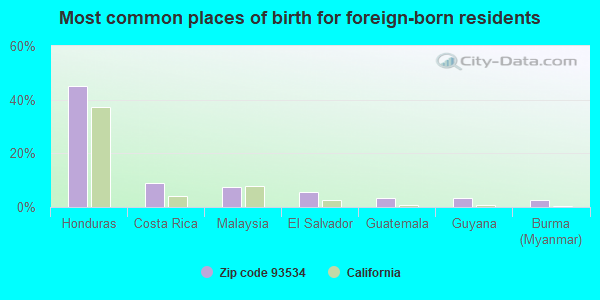
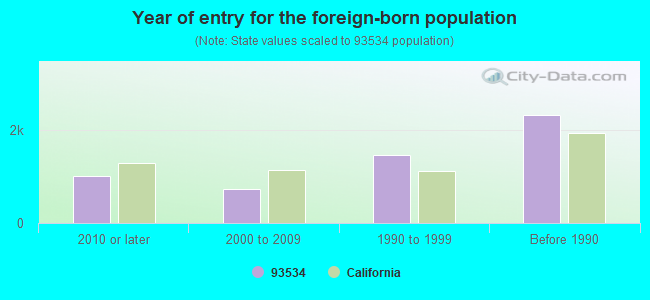
Foreign born population: 5,340 (12.7%) (51.4% of them are naturalized citizens)
Major facilities with environmental interests located in this zip code:
LANCASTER LANDFILL & RECYCLING CENTER (600 EAST AVENUE F in LANCASTER, CA)
STATE MASTER (California Solid Waste disposal sites tracking) - REFUSE DISPOSAL STATE MASTER (California - Hazardous Waste Tracking) - HAZARDOU WASTE PROGRAM CRITERIA AND HAZARDOUS AIR POLLUTANT INVENTORY (Inventory of air pollution sources) Large Quantity Generators, more that 1000 kg of hazardous waste/month (Resource Conservation and Recovery Act (tracking hazardous waste)) REFUSE DISPOSAL (Solid waste facilities tracking) Business SIC classification: REFUSE SYSTEMS Organizations: WASTE MANAGEMENT OF CALIFORNIA, INC. (CONTACT/OPERATOR)
Alternative names: WASTE MANAGEMENT OF LANCASTER
LANCASTER FIRESTONE (735 W AVE K in LANCASTER, CA)
STATE MASTER (California - Hazardous Waste Tracking) - HAZARDOU WASTE PROGRAM Small Quantity Generators, between 100 kg and 1000 kg of hazardous waste/month (Resource Conservation and Recovery Act (tracking hazardous waste)) - notification STATE MASTER (California - Used Oil Recycling System ) - USED OIL RECYCLING Organizations: FIRESTONE BRIDGESTONE (CONTACT/OWNER)
LANCASTER SHELL (866 WEST AVE I in LANCASTER, CA)
STATE MASTER (California - Hazardous Waste Tracking) - HAZARDOU WASTE PROGRAM Small Quantity Generators, between 100 kg and 1000 kg of hazardous waste/month (Resource Conservation and Recovery Act (tracking hazardous waste)) - notification Small Quantity Generators, between 100 kg and 1000 kg of hazardous waste/month (Resource Conservation and Recovery Act (tracking hazardous waste)) - notification Organizations: EQUILON ENTERPRISES L L C (CONTACT/OWNER)
, DICK TERLSION (CONTACT/OWNER)
Alternative names: SHELL SERVICE STATION
CENTURY 1 HR CLEANERS (551 W AVE J in LANCASTER, CA)
STATE MASTER (California - Hazardous Waste Tracking) - HAZARDOU WASTE PROGRAM (Resource Conservation and Recovery Act (tracking hazardous waste)) Organizations: JIN & YOUNG-SHIK HUR (CONTACT/OWNER)
EXODUS AIR SERVICE (4555 WEST AVE G in LANCASTER, CA)
STATE MASTER (California - Hazardous Waste Tracking) - HAZARDOU WASTE PROGRAM Small Quantity Generators, between 100 kg and 1000 kg of hazardous waste/month (Resource Conservation and Recovery Act (tracking hazardous waste)) - notification Small Quantity Generators, between 100 kg and 1000 kg of hazardous waste/month (Resource Conservation and Recovery Act (tracking hazardous waste)) - notification Organizations: MIKE HANEY (CONTACT/OWNER)
, LOS ANGELES (CONTACT/OWNER)
CHEVRON STATION 91274 (1860 WEST AVENUE I in LANCASTER, CA)
STATE MASTER (California - Hazardous Waste Tracking) - HAZARDOU WASTE PROGRAM Large Quantity Generators, more that 1000 kg of hazardous waste/month (Resource Conservation and Recovery Act (tracking hazardous waste)) Organizations: CHEVRON PRODUCTS CO. (CONTACT/OPERATOR)
LANCASTER AUTO GROUP (43244 DRIVERS WY in LANCASTER, CA)
STATE MASTER (California - Hazardous Waste Tracking) - HAZARDOU WASTE PROGRAM Small Quantity Generators, between 100 kg and 1000 kg of hazardous waste/month (Resource Conservation and Recovery Act (tracking hazardous waste)) - notification Organizations: MIKE TAHERIPOUR (CONTACT/OPERATOR)
, AMERICAN INTERNATIONAL BANK (CONTACT/OWNER)
Alternative names: LANCASTER JEEP EAGLE MAZDA
ANTELOPE VALLEY CARB (42239 SIERRA HWY in LANCASTER, CA)
STATE MASTER (California - Hazardous Waste Tracking) - HAZARDOU WASTE PROGRAM Small Quantity Generators, between 100 kg and 1000 kg of hazardous waste/month (Resource Conservation and Recovery Act (tracking hazardous waste)) - notification Business NAICS classification: OTHER AUTOMOTIVE MECHANICAL AND ELECTRICAL REPAIR AND MAINTENANCE. Organizations: LIZ LANG (CONTACT/OWNER)
, MARK J COTE AND CHERYL A COTE (CONTACT/OWNER)
LANCASTER CITY OF (665 W AVE H in LANCASTER, CA)
STATE MASTER (California - Hazardous Waste Tracking) - HAZARDOU WASTE PROGRAM Small Quantity Generators, between 100 kg and 1000 kg of hazardous waste/month (Resource Conservation and Recovery Act (tracking hazardous waste)) - notification Organizations: CITY OF LANCASTER (CONTACT/OWNER)
HIGH DESERT HEALTH SYSTEM (44900 N 60TH STREET WEST in LANCASTER, CA) . Federal Facility
STATE MASTER (California - Hazardous Waste Tracking) - HAZARDOU WASTE PROGRAM CRITERIA AND HAZARDOUS AIR POLLUTANT INVENTORY (Inventory of air pollution sources) Small Quantity Generators, between 100 kg and 1000 kg of hazardous waste/month (Resource Conservation and Recovery Act (tracking hazardous waste)) Business SIC classification: GENERAL MEDICAL AND SURGICAL HOSPITALS Alternative names: LA HEALTH SVC MIRA LOMA HOSPITAL
ADAMS METALLIZING (44632 TREVOR ST in LANCASTER, CA)
STATE MASTER (California - Hazardous Waste Tracking) - HAZARDOU WASTE PROGRAM Small Quantity Generators, between 100 kg and 1000 kg of hazardous waste/month (Resource Conservation and Recovery Act (tracking hazardous waste)) - notification Business NAICS classification: GENERAL AUTOMOTIVE REPAIR. Organizations: MATT ADAMS (CONTACT/OWNER)
HIROS TRANS (150 E AVE STE I in LANCASTER, CA)
STATE MASTER (California - Hazardous Waste Tracking) - HAZARDOU WASTE PROGRAM Small Quantity Generators, between 100 kg and 1000 kg of hazardous waste/month (Resource Conservation and Recovery Act (tracking hazardous waste)) - notification Business NAICS classification: GENERAL AUTOMOTIVE REPAIR. Organizations: JEFFEY MIYAHIRA (CONTACT/OWNER)
HIGH DESERT DAIRY (9753 AVE F8 E in LANCASTER, CA)
STATE MASTER (California - Hazardous Waste Tracking) - HAZARDOU WASTE PROGRAM Small Quantity Generators, between 100 kg and 1000 kg of hazardous waste/month (Resource Conservation and Recovery Act (tracking hazardous waste)) - notification Organizations: DELMAR VANDAM (CONTACT/OWNER)
Housing units lacking complete plumbing facilities: 1.8% Housing units lacking complete kitchen facilities: 3.7%
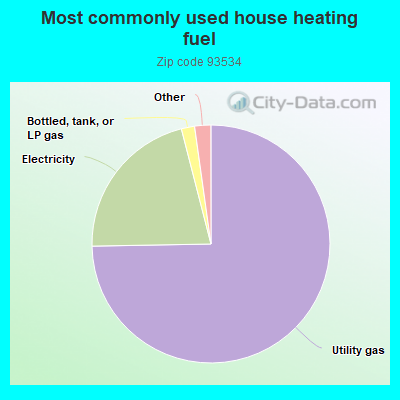
74.8%Utility gas
21.3%Electricity
1.8%Bottled, tank, or LP gas
0.9%No fuel used
0.7%Solar energy
0.5%Wood
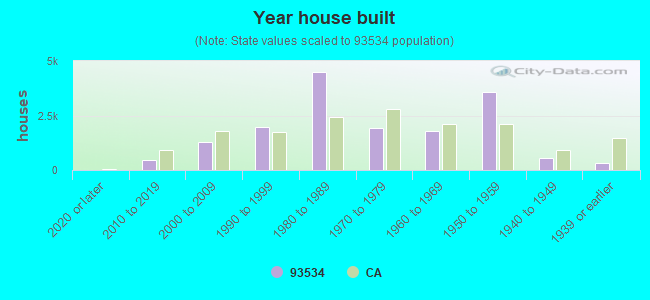
Population in 1990: 32,929. Population change in the 1990s: +2,175 (+6.6%).
Place of birth for U.S.-born residents:
This state: 31,082
Northeast: 918
Midwest: 1,528
South: 1,711
West: 1,322
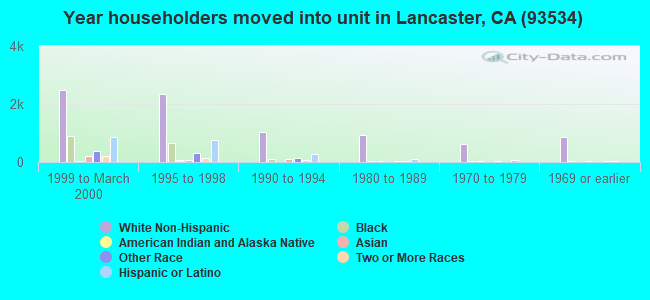
39% of the 93534 zip code residents lived in the same house 5 years ago. Out of people who lived in different houses, 74% lived in this county. Out of people who lived in different counties, 50% lived in California.
90% of the 93534 zip code residents lived in the same house 1 year ago. Out of people who lived in different houses, 68% moved from this county. Out of people who lived in different houses, 9% moved from different county within same state. Out of people who lived in different houses, 14% moved from different state. Out of people who lived in different houses, 8% moved from abroad.
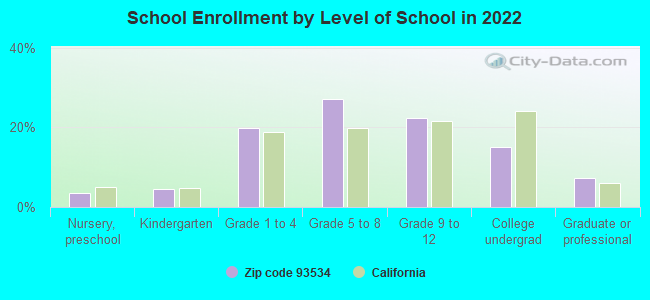
Private vs. public school enrollment:
Students in private schools in grades 1 to 8 (elementary and middle school): 184
Here:
3.4%
California:
10.5%
Students in private schools in grades 9 to 12 (high school): 76
Here:
2.9%
California:
8.5%
Students in private undergraduate colleges: 126
Here:
7.2%
California:
15.9%
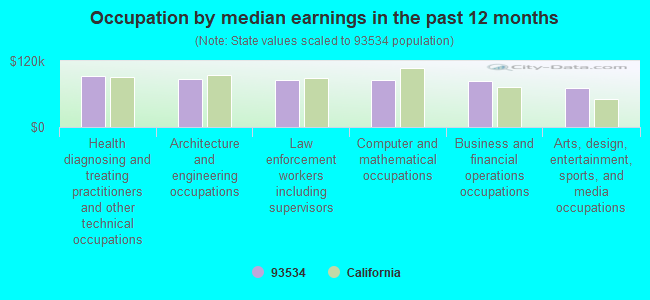
Occupation by median earnings in the past 12 months ($)
92,130Health diagnosing and treating practitioners and other technical occupations
87,696Architecture and engineering occupations
85,874Law enforcement workers including supervisors
85,110Computer and mathematical occupations
84,475Business and financial operations occupations
70,009Arts, design, entertainment, sports, and media occupations
Companies with biggest federal contracts located in this zip code (LANCASTER, CA):
DARRELL C REED ENTERPRISES, I (44666 YUCCA AVE; small business) : $186,739 in 3 contractsfrom 2002 to 2005
$96,600 with Navy for Training Aids. Signed on 2002-09-12. Completion date: 2002-10-12.
$89,520 with Navy for Operation Training Devices. Signed on 2004-08-23. Completion date: 2004-11-08.
$619, same as above.Signed on 2005-01-14. Completion date: 2005-01-21.
ANTELOPE VALLEY EQUIPMENT & TR (44532 TREVOR AVE; small business) 50 employees, $0 revenue. : $167,940 in 6 contractsfrom 2005 to 2006
Contracts for Bearings, Antifriction, Unmounted, Vehicular Furniture and Accessories by Air Force, Defense Logistics Agency Signed by year:2000: $0; 2001: $0; 2002: $0; 2003: $0; 2004: $0; 2005: $115,020; 2006: $52,920.
Biggest contracts:
$52,920 with Air Force for Bearings, Antifriction, Unmounted. Signed on 2006-01-05. Completion date: 2006-01-27.
$52,080, same as above.Signed on 2005-12-23. Completion date: 2006-01-20.
$41,940 with Defense Logistics Agency for Vehicular Furniture and Accessories. Signed on 2005-04-27. Completion date: 2005-06-16.
$24,360 with Air Force for Bearings, Antifriction, Unmounted. Signed on 2006-01-24. Completion date: 2006-02-10.
AIR PETRO CORPORATION (45315 NORTH TREVOR AVENUE; small business) : $144,073 in 10 contractsfrom 2004 to 2006
Contracts for Gasoline Reciprocating Engines, Except Aircraft; and Components, Liquid Propellants and Fuels, Petroleum Base, Gas Services, Fuel Oils, and moreby Air Force, Army Signed by year:2000: $0; 2001: $0; 2002: $0; 2003: $0; 2004: $37,025; 2005: $59,216; 2006: $47,832.
Biggest contracts:
$24,912 with Air Force for Gasoline Reciprocating Engines, Except Aircraft; and Components. Signed on 2005-10-28. Completion date: 2005-11-13.
$24,052 with Air Force for Liquid Propellants and Fuels, Petroleum Base. Signed on 2006-06-02. Completion date: 2006-06-09.
$23,780, same as above.Signed on 2006-02-08. Completion date: 2006-02-16.
$21,757 with Air Force for Gas Services. Signed on 2004-10-22. Completion date: 2004-10-31.
OFFICE INTERIORS PLUS (42156 10TH ST W STE F; small business) : $139,291 in 9 contractsfrom 1999 to 2005
Contracts for Office Furniture, Footwear, Men's, Books and Pamphlets, Other Professional Services, and moreby Navy, Air Force, Minerals Management Service Signed by year:2000: $0; 2001: $30,082; 2002: $0; 2003: $11,380; 2004: $0; 2005: $60,715; 2006: $0.
Biggest contracts:
$37,114 with Navy for Office Furniture. Signed on 1999-12-15. Completion date: 2000-03-15.
$30,082 with Air Force for Office Furniture. Signed on 2001-09-26. Completion date: 2001-09-20.
$19,979 with Air Force for Footwear, Men's. Signed on 2005-09-30. Completion date: 2005-11-18.
$17,162 with Air Force for Books and Pamphlets. Signed on 2005-09-16. Completion date: 2006-05-31.
PHILLIP LOPICCOLO DDS INC (1210 W AVENUE J STE 100; small business) : $135,881 in 7 contractsfrom 2000 to 2006
Contracts for Dentistry Services by Air Force, Navy Signed by year:2000: $39,849; 2001: $39,849; 2002: $0; 2003: $0; 2004: $0; 2005: $22,452; 2006: $33,731.
Biggest contracts:
$43,680 with Air Force for Dentistry Services. Signed on 2006-01-30. Completion date: 2008-01-31.
$39,849 with Navy for Dentistry Services. Signed on 2001-10-01. Completion date: 2001-09-30.
$39,849, same as above.Signed on 2000-10-01. Completion date: 2001-09-30.
$16,800 with Air Force for Dentistry Services. Signed on 2005-08-25. Completion date: 2005-12-31.
DR SHALINI SINGH (44444 16TH STREET WEST, SU; small business) : $118,003 in 4 contractsfrom 2000 to 2002
$39,720 with Navy for Dentistry Services. Signed on 2002-10-01. Completion date: 2003-09-30.
$39,720, same as above.Signed on 2001-10-01. Completion date: 2001-09-30.
$38,563, same as above.Signed on 2000-10-01. Completion date: 2001-09-30.
$0, same as above.Signed on 2000-10-01. Completion date: 2001-09-30.
JR INDUSTRIES (42231 6TH ST WEST; small business) : $114,248 in 7 contractsfrom 2000 to 2002
Contracts for Bearings, Plain, Unmounted, Guns, through 30 mm, Hose, Pipe, Tube, Lubrication, and Railing Fittings by Army, Defense Logistics Agency, Air Force Signed by year:2000: $113,673; 2001: $84,678; 2002: -$84,103; 2003: $0; 2004: $0; 2005: $0; 2006: $0.
Biggest contracts:
$52,383 with Army for Bearings, Plain, Unmounted. Signed on 2001-05-22. Completion date: 2001-11-30.
$48,568 with Defense Logistics Agency for Guns, through 30 mm. Signed on 2000-11-20. Completion date: 2001-07-18.
$33,022, same as above.Signed on 2000-11-29. Completion date: 2002-01-23.
$32,295 with Air Force for Hose, Pipe, Tube, Lubrication, and Railing Fittings. Signed on 2001-03-21. Completion date: 2001-12-31.
KINGSLEY GLASS COMPANY INC (832 W AVENUE I; small business) : $81,400 in 8 contractsfrom 2001 to 2005
Contracts for Other Housekeeping Services, Maintenance, Repair or Alteration of Real Property -- Miscellaneous Buildings, Maintenance, Repair or Alteration of Real Property -- Testing and Measurement Buildings by Air Force Signed by year:2000: $0; 2001: $8,692; 2002: $22,294; 2003: $0; 2004: $23,764; 2005: $26,650; 2006: $0.
Biggest contracts:
$24,525 with Air Force for Other Housekeeping Services. Signed on 2005-10-28. Completion date: 2006-09-30.
$23,764, same as above.Signed on 2004-10-13. Completion date: 2005-09-30.
$18,052 with Air Force for Maintenance, Repair or Alteration of Real Property -- Miscellaneous Buildings. Signed on 2002-09-28. Completion date: 2002-11-15.
$8,692 with Air Force for Maintenance, Repair or Alteration of Real Property -- Testing and Measurement Buildings. Signed on 2001-05-25. Completion date: 2001-06-25.
METRO FLOORS INC (44109 YUCCA AVE; small business) : $80,640 in 2 contractsfrom 2000 to 2006
$61,200 with Army for Maintenance, Repair and Rebuilding of Equipment -- Instruments and Laboratory Equipment. Taking place in NJ. Signed on 2000-07-07. Completion date: 2000-09-30.
$19,440 with Air Force for Maintenance, Repair or Alteration of Real Property -- Restoration of real property. Signed on 2006-04-03. Completion date: 2006-06-09.
SUMMIT SIGN SERVICE (1138 IVYTON ST; small business) : $72,000 in 5 contractsfrom 2001 to 2005
Contracts for Maintenance, Repair or Alteration of Real Property -- Other Non-Building Facilities, Maintenance, Repair and Rebuilding of Equipment -- Automatic Data Processing Equipment (Including Firmware), Software, Supplies and Support Equipment by Air Force Signed by year:2000: $0; 2001: $30,000; 2002: $30,000; 2003: $30,000; 2004: $30,000; 2005: -$48,000; 2006: $0.
Biggest contracts:
$30,000 with Air Force for Maintenance, Repair or Alteration of Real Property -- Other Non-Building Facilities. Signed on 2004-10-13. Completion date: 2005-09-30.
$30,000 with Air Force for Maintenance, Repair and Rebuilding of Equipment -- Automatic Data Processing Equipment (Including Firmware), Software, Supplies and Support Equipment. Signed on 2003-10-16. Completion date: 2006-09-30.
$30,000, same as above.Signed on 2002-10-01. Completion date: 2003-09-30.
$30,000 with Air Force for Maintenance, Repair or Alteration of Real Property -- Other Non-Building Facilities. Signed on 2001-09-30. Completion date: 2006-09-30.
Top industries in this zip code by the number of employees in 2005:
Health Care and Social Assistance: General Medical and Surgical Hospitals (over 1000 employees: 1 establishment, 500-999 employees: 1 establishment)
Health Care and Social Assistance: Offices of Physicians (except Mental Health Specialists) (250-499: 2, 50-99: 2, 20-49: 3, 10-19: 13, 5-9: 44, 1-4: 61)


 Nearest zip codes: 93551, 93552, 93536, 93560, 93510, 93535.