Long Beach and Lancaster are two vastly different cities in Southern California. Long Beach, a coastal city, is known for its maritime heritage, diverse culture, and bustling urban life. Lancaster, on the other hand, is situated in the high desert and is known for its relatively low cost of living and quiet, less populous environment. The choices between these two cities would hinge on one's lifestyle preference, employment situation, cost of living tolerance, and penchant for coastal or desert climate.
Distance between
Long Beach, CA and
Lancaster, CA : 61.0 miles
Long Beach's population is larger by 168%. Its population has decreased by 5,460 people (1.2%) since 2000. The population of Lancaster has grown by 51,432 people (43.3%) during that time.
Safety can be a significant deciding factor when considering relocation or a visit. According to Neighborhood Scout, Long Beach has a crime rate that is slightly higher than the national average. Lancaster’s crime rate is significantly higher than the national average, making Long Beach safer in comparison. Both cities have implemented crime prevention measures and community programs to improve safety for their residents.
City-data.com crime index counts serious crimes and violent crime more heavily. It adjusts for the number of visitors and daily workers commuting into cities. (higher means more crime, U.S. average = 301.1)
City-data.com crime index counts serious crimes and violent crime more heavily. It adjusts for the number of visitors and daily workers commuting into cities. (higher means more crime, U.S. average = 301.1)
Sex Offenders
According to our data, there are 807 registered sex offenders living in Long Beach and 454 registered sex offenders living in . The ratio of residents to sex offenders in Long Beach is 583 to 1; the ratio in Lancaster is 353 to 1. The number of registered sex offenders compared to the number of residents is a smaller in Long Beach than in Lancaster.
Cost of Living
Living in Long Beach is generally more expensive than in Lancaster. According to Bestplaces.net, the cost of living is significantly higher in Long Beach, especially regarding housing prices. Lancaster, being further away from the coast and major metro areas, offers a more affordable living.
Income Tax
Both cities follow the state of California's progressive income tax rate, which can be as high as 13.3% for the highest earners.
Property Tax
The average property tax rate in Long Beach is 0.793%, while in Lancaster it's 1.124%.
Sales Tax
The city sales tax rate in Long Beach is 10.25%. Lancaster has a lower sales tax rate at 7.25%.
Income
Type
Long Beach
Lancaster
Estimated median household income
$73,905
$64,242
Estimated per capita income
$37,217
$26,470
Cost of living index (U.S. average is 100)
142
129.8
If you make $50,000 in Lancaster, you will have to make $54,700 in Long Beach to maintain the same standard of living.
Geographical Conditions
Long Beach is a coastal city with beautiful sea views and beaches. Lancaster is located in the high desert, offering a completely different type of natural beauty.
In terms of education, both cities have access to several public, private schools, and universities. Long Beach is home to the California State University, Long Beach, and has several high-performing schools. Lancaster also offers solid education opportunities including the University of Antelope Valley.
The economy of Long Beach is diverse with industries like healthcare, education, and port-related activities playing significant roles. Lancaster's economy is smaller and less diverse, with most jobs in retail trade, healthcare, and social assistance.
Biggest Employers
The largest employers in Long Beach include the Long Beach Unified School District, the City of Long Beach, and Boeing. In Lancaster, the largest employers are Antelope Valley Hospital, Antelope Valley Union High School District, and Northrop Grumman.
There were 304 building permits issued in Long Beach in 2012 (238 more than in 2011) compared to 263 building permits issued in Lancaster in 2012 (88 more than in 2011).
Weather
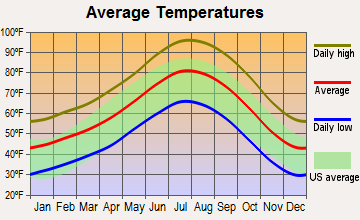
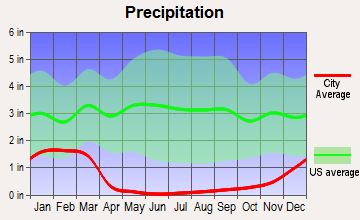
Weather-wise, Long Beach offers a typical Southern Californian climate with moderate temperatures, lots of sun, and seldom rainfall. On the other hand, Lancaster has a desert climate with hot summers, cold winters, and less rainfall. For those who appreciate a coastal climate, Long Beach would be more appealing, while those who prefer a desert climate might find Lancaster more suited to their liking.
Weather and climate
Type
Long Beach
Lancaster
Temperature - Average
65.3°F
61.3°F
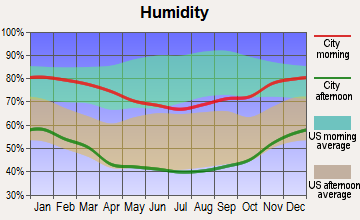
Humidity - Average morning or afternoon humidity
70.4%
61.2%
Humidity - Differences between morning and afternoon humidity
27%
17.6%
Humidity - Maximum monthly morning or afternoon humidity
79%
64.6%
Humidity - Minimum monthly morning or afternoon humidity
52%
47%
Precipitation - Yearly average
13.1 in
7.5 in
Snowfall - Yearly average
0 in
0 in
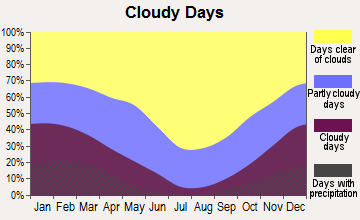
Clouds - Number of days clear of clouds
26.4%
28.8%
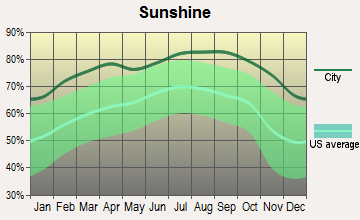
Sunshine amount - Average
78.4%
78.4%
Sunshine amount - Differences during a year
22%
21.4%
Sunshine amount - Maximum monthly
85%
84.8%
Sunshine amount - Minimum monthly
63%
63.4%
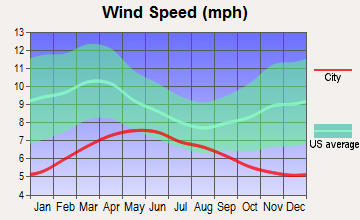
Wind speed - Average
6.1 mph
4.3 mph
Average climate in Long Beach, California
Average climate in Lancaster, California
Air pollution
Type
AQI
CO
NO2
OZONE
PB
PM10
PM25
SO2
Year
Long Beach
Lancaster
Long Beach
Lancaster
Long Beach
Lancaster
Long Beach
Lancaster
Long Beach
Long Beach
Lancaster
Long Beach
Lancaster
Long Beach
2018
124
95
0.37
0.21
17.2
8.7
22.1
39.8
0.008
N/A
27.5
25.4
13.5
7.3
0.7
N/A
2017
122
89
0.36
0.26
18.1
7.8
23.2
38.3
0.007
N/A
26.7
25.4
14.5
7.4
0.8
N/A
2016
115
91
0.36
0.25
18.5
8.1
21.9
40.2
0.007
N/A
24.1
25.0
11.6
7.7
0.9
N/A
2015
111
104
0.38
0.27
19.9
6.7
22.5
41.5
0.005
N/A
25.0
18.4
13.9
N/A
0.9
N/A
2014
127
90
0.50
0.16
20.3
8.2
22.0
38.7
0.007
N/A
26.7
22.7
14.3
N/A
1.3
N/A
2013
126
96
0.48
0.20
20.0
8.0
24.7
39.4
0.005
N/A
32.3
22.5
14.6
N/A
1.0
N/A
2012
132
89
0.48
0.28
19.3
8.9
24.4
40.5
0.004
N/A
30.8
29.5
14.1
N/A
0.6
N/A
2011
119
97
0.43
0.27
20.2
11.7
23.4
41.9
0.006
N/A
28.4
19.7
15.6
N/A
1.2
N/A
2010
115
93
0.38
0.16
20.8
11.7
22.7
41.8
0.011
N/A
24.1
19.0
11.9
N/A
0.7
N/A
2009
132
103
0.50
0.15
21.0
12.7
22.0
40.9
0.008
N/A
27.7
20.6
13.1
N/A
1.1
N/A
2008
124
98
0.53
0.17
20.8
13.2
23.2
37.7
0.008
N/A
27.2
26.5
21.6
N/A
1.0
N/A
2007
109
97
0.60
0.20
20.3
14.5
21.1
37.5
0.010
N/A
N/A
23.8
N/A
N/A
1.4
N/A
2006
119
95
0.76
0.24
21.4
14.9
19.9
35.6
0.005
N/A
N/A
23.6
N/A
N/A
1.7
N/A
2005
108
102
0.74
0.23
24.3
15.4
20.5
36.4
0.011
N/A
N/A
22.2
N/A
N/A
2.7
N/A
2004
125
109
0.56
0.25
28.0
14.5
22.9
39.1
0.012
N/A
N/A
24.8
N/A
N/A
2.0
N/A
2003
130
112
0.83
0.27
28.1
15.0
22.4
38.1
0.032
N/A
N/A
26.4
N/A
N/A
1.1
N/A
2002
120
113
0.90
0.30
29.6
15.7
22.2
38.5
0.011
N/A
N/A
28.8
N/A
N/A
2.8
N/A
2001
124
103
0.81
0.39
30.3
15.8
21.5
37.8
0.011
N/A
N/A
25.9
N/A
N/A
3.3
N/A
2000
142
109
0.71
0.52
31.5
15.6
19.6
37.2
0.018
N/A
N/A
26.6
N/A
N/A
2.0
N/A
Natural disasters
Type
Long Beach
Lancaster
Tornado activity compared to U.S. average
18.3%
11%
Earthquake activity compared to U.S. average
6,875.1%
7,695.2%
Natural disasters compared to U.S. average
57%
57%
Transportation
Long Beach offers ample public transportation options, including buses, light rail services, and bicycle-sharing programs. Lancaster’s public transport is more limited, but its Metrolink service gives easy access to larger metro areas.
Transport
Type
Long Beach
Lancaster
Amtrak stations
1
1
Amtrak stations nearby
3
3
FAA registered aircraft
312
159
FAA registered aircraft manufacturers and dealers
29
0
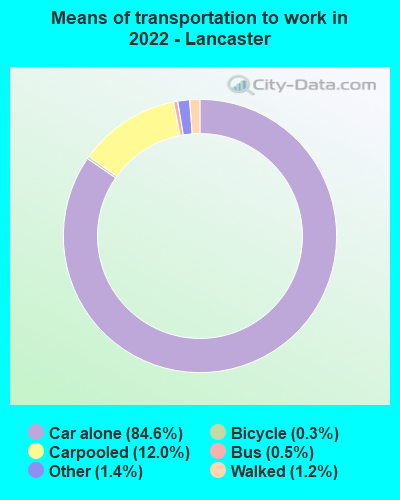
Means of transportation to work
Type
Long Beach
Lancaster
Bicycle
0.5%
0.3%
Bus
3.3%
0.7%
Carpooled
9.8%
11.6%
Car alone
81.8%
84.9%
Motorcycle
0.2%
0.4%
Railroad
0%
0.5%
Subway
0.5%
0.1%
Walked
2.8%
1.2%
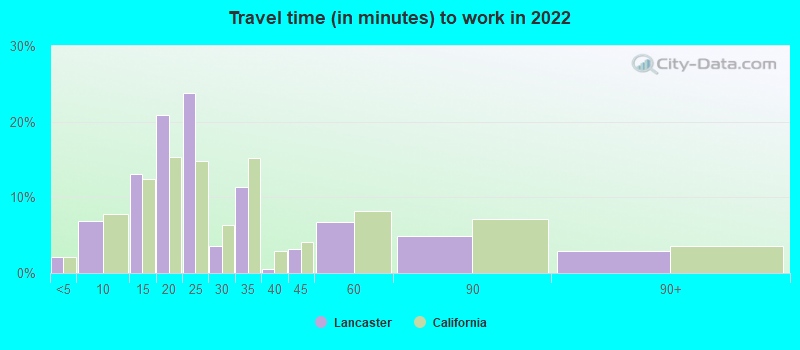
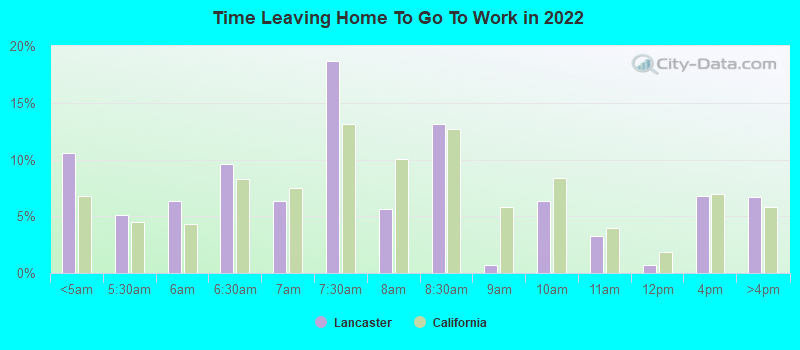
Average travel time to work
Type
Long Beach
Lancaster
Average
30.7 min
25.9 min
Other means
28.5 min
31.3 min
Public transportation
46.4 min
54.2 min
Private vehicle occupancy
Type
Long Beach
Lancaster
Average
1.1
1.2
Drove alone
89.7%
87.9%
In 2 person carpool
8.5%
8.8%
In 3 person carpool
1.4%
1.5%
In 4 person carpool
0.3%
1%
In 5-6 person carpool
0%
0.5%
In 7+ person carpool
0%
0.2%
How many people usually rode to work in the car, truck or van.
Real Estate
The real estate market in Long Beach is more expensive than Lancaster. The median home cost in Long Beach is $621,200, compared to Lancaster's $307,700.
Neighborhoods
Long Beach boasts diverse neighborhoods from the chic East Village to the trendy Belmont Shore. Lancaster, on the other hand, offers quieter, more conservative neighborhoods.
Houses and residents
Type
Long Beach
Lancaster
Houses
179,856
53,460
Average household size (people)
2.8
3.2
Median year apartment built
1964
1983
Median year house/condo built
1954
1988
Length of stay in the house since moving in
15.7 years
10.6 years
Houses occupied
172,599 (96%)
51,333 (96%)
Houses occupied by owners
69,470 (40.2%)
29,878 (58.2%)
Houses occupied by renters
103,129 (59.8%)
21,455 (41.8%)
Median rent asked for vacant for-rent units
$1,057
$1,086
Median monthly housing costs
$1,692
$1,531
Median price asked for vacant for-sale houses and condos
$520,992
$485,841
Estimated median house or condo value
$693,600
$377,200
Median numbers of rooms
4.2
5.9
Median number of rooms in apartments
3.6
4.5
Median number of rooms in houses and condos
5.5
6.6
Median house price - detached houses
$900,658
$352,592
Median house price - in 3-to-4-unit structures
$495,928
$739,769
Median house price - in 5 or more unit structures
$488,399
$208,950
Median house price - mobile homes
$333,777
$95,691
Median house price - Townhouses or other attached units
$634,684
$391,150
Median house price - All housing units
$805,766
$329,782
Median house age
62
36
Renting percentage
58.4%
39.6%
Housing density (houses/condos per square mile)
3,565.7
568.7
House value disparities
21.3%
28.2%
Household income disparities
44.7%
46.3%
Median household income for houses/condes with a mortgage
$116,421
$95,484
Median household income for apartments without a mortgage
$79,392
$59,553
Housing units without a mortgage
394 (0.8%)
0 (0%)
Housing units with both a second mortgage and home equity loan
3,069 (6.2%)
591 (2.8%)
Housing units with a mortgage
49,321 (99.2%)
21,098 (100%)
Housing units with a home equity loan
48 (0.1%)
0 (0%)
Housing units with a second mortgage
3,709 (7.5%)
678 (3.2%)
House/condo owner moved in on average (years ago)
15
9
House/condo renter moved in on average (years ago)
3
4
Housing units lacking complete kitchen facilities
2.6%
1.2%
Housing units lacking complete plumbing facilities
0.4%
0.1%
Housing units in structures
Housing units in structures
Long Beach
Lancaster
One, detached
40.2%
70.2%
One, attached
4.9%
1.9%
Two
5.3%
1.3%
3 or 4
8.8%
3.5%
5 to 9
10.4%
7.4%
10 to 19
10.8%
1.5%
20 to 49
8.0%
2.3%
50 or more
10.6%
5.3%
Mobile homes
0.8%
6.5%
Boats, RVs, vans, etc.
0.2%
0.1%
Median real estate property taxes paid for housing units
Self-employed workers in own not incorporated business
18,532
2,428
State government workers
6,550
3,166
Unpaid family workers
178
241
Industries and Occupations
The leading industries in Long Beach are healthcare, transportation, and education. In Lancaster, the primary industries are retail trade, healthcare, and manufacturing.
Health diagnosing and treating practitioners and other technical occupations
4.9%
6.3%
Community and social service occupations
4.4%
3.3%
Personal care and service occupations
3.6%
2.9%
Arts, design, entertainment, sports, and media occupations
3.0%
0.4%
Building and grounds cleaning and maintenance occupations
2.9%
4.3%
Health technologists and technicians
2.8%
3.4%
Material moving occupations
2.8%
2.6%
Production occupations
2.7%
2.5%
Computer and mathematical occupations
1.9%
3.0%
Transportation occupations
1.4%
2.2%
Life, physical, and social science occupations
1.3%
1.0%
Legal occupations
1.3%
3.2%
Law enforcement workers including supervisors
0.2%
1.3%
Health Care
Long Beach has more robust healthcare facilities with several large hospitals and healthcare systems. Lancaster's healthcare system is smaller, yet still comprehensive with the Antelope Valley Hospital serving as the main provider.
In terms of infrastructure, Long Beach, with its port, has more developed commercial and residential infrastructure. Lancaster, while growing, still remains less developed as compared to Long Beach.
Infrastructure
Type
Long Beach
Lancaster
Hospitals
17
5
TV stations
5
3
Bank branches located here
67
20
Bank institutions located here
18
9
Main business address for public companies
11
1
Drinking water stations with no reported violations in the past
2
7
Drinking water stations with reported violations in the past
HMDA - Conventional home purchase loans - Applications denied
Year
Long Beach
Lancaster
1999
1,159
440
2000
710
46
2001
677
42
2002
708
53
2003
1,861
844
2004
2,162
1,465
2005
3,065
2,410
2006
3,591
2,897
2007
2,287
1,582
2008
887
544
2009
475
239
Culture and Food
Long Beach offers a vibrant urban culture with various food, arts, and music festivals. Lancaster has a more relaxed culture and is known for its poppy festival and street fairs.
Sports Teams
Long Beach does not have any major professional sports teams but offers various water sports due to its coastal location. Lancaster has a minor league baseball team, the Lancaster JetHawks.


 Long Beach, CA
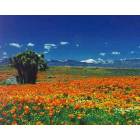
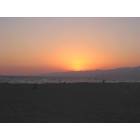
 Lancaster, CA