Long Beach and the Central Coast of California, while located within the same state, provide two distinct living experiences. This comparison focuses on distinctive aspects such as crime and safety, weather patterns, cost of living, education systems, the economy, infrastructure, industries, employment, real estate, neighborhoods, transportation, tax rates, culture and food, sports, geographical conditions, and healthcare. Both destinations offer unique advantages whether you are considering for relocation or a vacation.
In both Long Beach and Central Coast, there's a commitment to ensure safety for both residents and tourists. Unfortunately, Long Beach has slightly higher crime rates compared to the average US crime rate, but authorities are continuously working on efforts to curb this. The Central Coast, considered safer, is comprised of multiple small towns each with its own level of safety. Generally, crime rates tend to be lower in these smaller coastal communities.
Cost of Living
Long Beach, being a large metropolitan area, has a higher cost of living compared to the national average, with housing being the biggest factor. The Central Coast is also known for its higher cost of living, particularly in areas like San Luis Obispo and Santa Barbara, where housing cost is also a prime driver.
Income Tax
California has one of the highest state income taxes in the nation, affecting both Long Beach and Central Coast residents. However, no additional city income taxes are imposed in either location.
Property Tax
Both locations are subject to California's property tax, which is relatively lower than in many other states. Rates may vary slightly depending on the city and county.
Sales Tax
Both Long Beach and the Central Coast have higher-than-average sales taxes due to California's high state sales tax. However, Long Beach's city sales tax is slightly higher than the average sales tax in Central Coast towns.
Income
Type
Long Beach
Central Coast
Estimated median household income
$73,905
$106,582
Estimated per capita income
$37,217
$70,103
Cost of living index (U.S. average is 100)
142
101.8
If you make $50,000 in Central Coast, you will have to make $69,745 in Long Beach to maintain the same standard of living.
Geographical Conditions
Long Beach is characterized by its beautiful beaches and bustling port, while the Central Coast is known for its scenic beauty, vineyards, and open spaces, making it perfect for various outdoor activities.
Geographical information
Type
Long Beach
Central Coast
Land area
50.4 sq. miles
50.4 sq. miles
Population density
9,041.5 people per sq. mile
4,732.1 people per sq. mile
Relative area comparison
Long Beach, CA Central Coast, CA
Education
Both areas offer a range of educational opportunities. Long Beach is home to the well-respected California State University, Long Beach (CSULB), and other excellent schools. The Central Coast boasts renowned institutions like the University of California, Santa Barbara (UCSB) and California Polytechnic State University (Cal Poly).
Long Beach's economy is diverse, with employment opportunities in healthcare, education, and the port of Long Beach. Central Coast possesses a robust economy, anchored by agriculture, tourism, education, and tech startup sectors.
Biggest Employers
The biggest employers in Long Beach comprise primarily of healthcare facilities and educational institutions, alongside the City of Long Beach. In the Central Coast, large employers include agricultural enterprises, education providers, and tech companies, underpinned by a healthy number of government jobs.
In Long Beach (Los Angeles County), 69.7% voted for Democrats and 27.8% for Republicans in 2012 Presidential Election. In Central Coast (Orange County), 45.8% voted for Democrats and 52.0% for Republicans.
Elections
Type
Democrats
Republicans
Other
Year
Long Beach
Central Coast
Long Beach
Central Coast
Long Beach
Central Coast
2020
71.0%
53.6%
26.9%
44.6%
2.1%
1.8%
2016
72.0%
50.9%
22.5%
42.4%
5.5%
6.7%
2012
69.7%
45.8%
27.8%
52.0%
2.4%
2.3%
2008
69.2%
47.8%
28.8%
50.3%
1.9%
1.9%
2004
63.3%
39.3%
35.7%
60.2%
1.0%
0.5%
2000
63.6%
40.4%
32.4%
55.9%
4.0%
3.7%
1996
59.3%
37.9%
31.0%
51.7%
9.7%
10.5%
Breakdown of population affiliated with a religious congregation
Type
Adherents
Congregations
Religion
Long Beach
Central Coast
Long Beach
Central Coast
CATHOLIC CHURCH
36.1%
26.5%
4.7%
4.4%
SOUTHERN BAPTIST CONVENTION
1.0%
2.3%
9.0%
8.8%
MUSLIM ESTIMATE
0.7%
0.8%
1.0%
1.3%
AMERICAN BAPTIST CHURCHES IN THE USA
0.5%
0.2%
3.1%
1.7%
SEVENTH DAY ADVENTIST CHURCH
0.5%
0.4%
2.4%
1.3%
EPISCOPAL CHURCH
0.4%
0.4%
1.4%
1.4%
EVANGELICAL LUTHERAN CHURCH IN AMERICA
0.2%
0.4%
1.9%
2.3%
LUTHERAN CHURCH
0.2%
0.6%
1.6%
2.0%
REFORMED CHURCH IN AMERICA
0.1%
0.3%
0.2%
0.2%
Weather
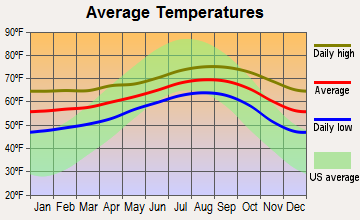
Long Beach enjoys a Mediterranean climate with warm, dry summers and mild, wet winters. The Central Coast has a more varied climate, ranging from Mediterranean in the south to a maritime influence in the north. Generally, both areas are known for their sunshine and beautiful weather, enhancing outdoor activities for residents and tourists alike.
Weather and climate
Type
Long Beach
Central Coast
Temperature - Average
65.3°F
62.4°F
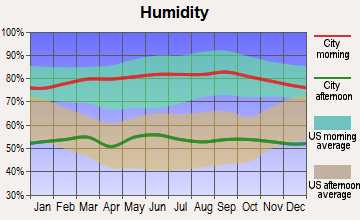
Humidity - Average morning or afternoon humidity
70.4%
69.7%
Humidity - Differences between morning and afternoon humidity
27%
26%
Humidity - Maximum monthly morning or afternoon humidity
79%
78.1%
Humidity - Minimum monthly morning or afternoon humidity
52%
52%
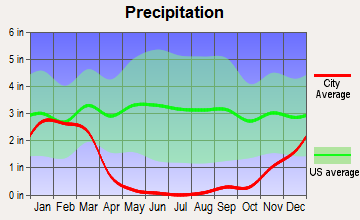
Precipitation - Yearly average
13.1 in
12.1 in
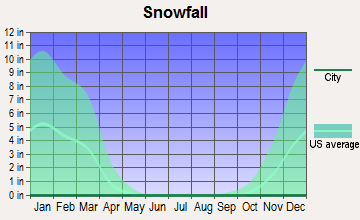
Snowfall - Yearly average
0 in
0 in
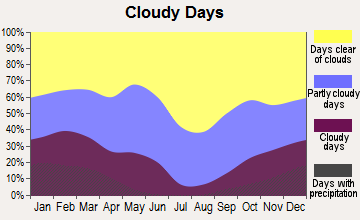
Clouds - Number of days clear of clouds
26.4%
26.6%
Sunshine amount - Average
78.4%
78.3%
Sunshine amount - Differences during a year
22%
21.7%
Sunshine amount - Maximum monthly
85%
84.4%
Sunshine amount - Minimum monthly
63%
62.7%
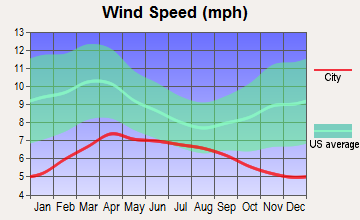
Wind speed - Average
6.1 mph
5.8 mph
Average climate in Long Beach, California
Average climate in Central Coast, California
Air pollution
Type
AQI
CO
NO2
OZONE
PB
PM10
PM25
SO2
Year
Long Beach
Central Coast
Long Beach
Central Coast
Long Beach
Central Coast
Long Beach
Central Coast
Long Beach
Central Coast
Long Beach
Central Coast
Long Beach
Central Coast
Long Beach
Central Coast
2018
124
119
0.37
0.29
17.2
14.2
22.1
28.9
0.008
N/A
27.5
27.5
13.5
12.6
0.7
0.7
2017
122
116
0.36
0.27
18.1
12.9
23.2
31.6
0.007
N/A
26.7
26.7
14.5
13.8
0.8
0.5
2016
115
102
0.36
0.26
18.5
10.6
21.9
31.2
0.007
N/A
24.1
24.1
11.6
12.5
0.9
0.1
2015
111
106
0.38
0.26
19.9
11.8
22.5
31.8
0.005
N/A
25.0
25.0
13.9
14.5
0.9
0.1
2014
127
109
0.50
0.23
20.3
11.3
22.0
30.2
0.007
N/A
26.7
26.7
14.3
15.6
1.3
0.3
2013
126
107
0.48
0.27
20.0
12.3
24.7
29.3
0.005
0.003
32.3
29.4
14.6
14.1
1.0
0.2
2012
132
103
0.48
0.21
19.3
10.6
24.4
28.0
0.004
0.004
30.8
28.1
14.1
14.4
0.6
0.1
2011
119
109
0.43
0.25
20.2
12.7
23.4
28.2
0.006
0.006
28.4
27.7
15.6
15.9
1.2
0.6
2010
115
102
0.38
0.26
20.8
12.0
22.7
27.6
0.011
0.011
24.1
23.6
11.9
14.1
0.7
0.6
2009
132
118
0.50
0.29
21.0
13.6
22.0
29.2
0.008
0.009
27.7
24.3
13.1
14.5
1.1
1.1
2008
124
124
0.53
0.35
20.8
14.0
23.2
30.1
0.008
0.008
27.2
29.5
21.6
21.6
1.0
1.1
2007
109
100
0.60
0.32
20.3
14.0
21.1
28.5
0.010
0.010
N/A
N/A
N/A
N/A
1.4
0.8
2006
119
109
0.76
0.35
21.4
15.1
19.9
27.2
0.005
0.005
N/A
N/A
N/A
N/A
1.7
1.3
2005
108
91
0.74
0.32
24.3
14.6
20.5
29.4
0.011
0.011
N/A
N/A
N/A
N/A
2.7
1.3
2004
125
118
0.56
0.46
28.0
16.3
22.9
31.5
0.012
0.012
N/A
N/A
N/A
N/A
2.0
1.6
2003
130
116
0.83
0.59
28.1
19.1
22.4
32.5
0.032
0.046
N/A
N/A
N/A
N/A
1.1
1.1
2002
120
103
0.90
0.58
29.6
18.8
22.2
28.2
0.011
0.010
N/A
N/A
N/A
N/A
2.8
1.6
2001
124
109
0.81
0.67
30.3
18.2
21.5
27.8
0.011
0.011
N/A
N/A
N/A
N/A
3.3
1.5
2000
142
116
0.71
0.79
31.5
20.6
19.6
26.0
0.018
0.016
N/A
N/A
N/A
N/A
2.0
1.9
Natural disasters
Type
Long Beach
Central Coast
Tornado activity compared to U.S. average
18.3%
18.4%
Earthquake activity compared to U.S. average
6,875.1%
6,801.5%
Natural disasters compared to U.S. average
57%
32%
Transportation
Long Beach boasts a sophisticated public transportation system, with busses, bikes and a light rail. The Central Coast's smaller population means less comprehensive public transport, but plentiful parking and less traffic.
Transport
Type
Long Beach
Central Coast
Amtrak stations
1
0
Amtrak stations nearby
3
3
FAA registered aircraft
312
0
FAA registered aircraft manufacturers and dealers
29
0
Means of transportation to work
Type
Long Beach
Central Coast
Bicycle
0.5%
1.8%
Bus
3.3%
2.4%
Carpooled
9.8%
9%
Car alone
81.8%
75.9%
Motorcycle
0.2%
0.2%
Railroad
0%
0.1%
Subway
0.5%
0.1%
Walked
2.8%
4.4%
Average travel time to work
Type
Long Beach
Central Coast
Average
30.7 min
23.2 min
Real Estate
Long Beach's real estate market is diverse, featuring everything from beachfront condos to family homes. In contrast, the Central Coast, with its rural charm has more detached homes with larger lot sizes. Real estate prices reflect these differences; it's generally more expensive in Long Beach.
Neighborhoods
Long Beach is home to multiple vibrant neighborhoods, each with its own unique character. The Central Coast encompasses several quaint seaside towns and rural communities, each with its welcoming atmosphere.
Houses and residents
Type
Long Beach
Central Coast
Houses
179,856
96,674
Average household size (people)
2.8
2.4
Houses occupied
172,599 (96%)
90,435 (93.5%)
Houses occupied by owners
69,470 (40.2%)
43,559 (48.2%)
Houses occupied by renters
103,129 (59.8%)
46,876 (51.8%)
Median rent asked for vacant for-rent units
$1,057
$2,849
Median price asked for vacant for-sale houses and condos
$520,992
$1,099,558
Estimated median house or condo value
$693,600
Over $1,000,000
Median number of rooms in apartments
3.6
3.9
Median number of rooms in houses and condos
5.5
6.1
Renting percentage
58.4%
53.9%
Housing density (houses/condos per square mile)
3,565.7
1,918.7
Household income disparities
44.7%
38.4%
Housing units without a mortgage
394 (0.8%)
8,041 (21.3%)
Housing units with both a second mortgage and home equity loan
3,069 (6.2%)
100 (0.3%)
Housing units with a mortgage
49,321 (99.2%)
29,764 (78.7%)
Housing units with a home equity loan
48 (0.1%)
3,303 (8.7%)
Housing units with a second mortgage
3,709 (7.5%)
3,451 (9.1%)
Housing units lacking complete kitchen facilities
2.6%
0.7%
Housing units lacking complete plumbing facilities
Self-employed workers in own not incorporated business
18,532
13,281
State government workers
6,550
6,404
Unpaid family workers
178
456
Industries and Occupations
In Long Beach, industries like trade, transportation and utilities, education, and healthcare dominate. Central Coast employs a diverse workforce across sectors including agriculture, hospitality, education, and increasingly, technology startups.
Both Long Beach and the Central Coast offer excellent healthcare facilities. Long Beach has several renowned hospitals within its city limits, while the Central Coast, though less urbanized, also provides high-quality healthcare, especially in larger towns.
Health (county statistics)
Type
Long Beach
Central Coast
General health status score of residents in this county from 1 (poor) to 5 (excellent)
Long Beach, being the larger city, has more extensive infrastructure. Central Coast, with its smaller communities, may not have the same scale of facilities but prides itself on its strong infrastructure to support tourism and agriculture.
Infrastructure
Type
Long Beach
Central Coast
TV stations
5
2
Culture and Food
Long Beach is known for its diverse culture and cuisine, hosting various cultural events throughout the year. The Central Coast, while less diverse, offers a rich food scene, particularly in locally sourced seafood and wine, with numerous wineries and farmers markets.
Sports Teams
Long Beach residents have close proximity to Los Angeles sports teams. In contrast, the Central Coast does not host large professional teams but offers a range of sporting activities and events, often based outdoors.
 Long Beach, CA
 Central Coast, CA