Long Beach and Inglewood, both located in Southern California, offer unique living experiences, distinctive landscapes, and distinct neighborhoods. Long Beach, known for its oceanfront vistas, vibrant downtown, and cultural diversity, contrasts with Inglewood's urban environment, which is undergoing significant transformation. This comparison delves into various aspects of each city, including crime and safety, weather, cost of living, education, economy, infrastructure, and more to guide those considering relocation or tourism opportunities.
Distance between
Long Beach, CA and
Inglewood, CA : 15.1 miles
Long Beach's population is larger by 334%. Its population has decreased by 5,460 people (1.2%) since 2000. The population of Inglewood has decreased by 7,399 people (6.6%) during that time.
When it comes to crime and safety, both Long Beach and Inglewood deal with challenges. Although crime rates are above the national average in both cities, Long Beach has seen a steady decline in overall crime over the years. Inglewood, while still facing issues, has recently been ranked among the top 5% safest cities in California due to initiatives to improve neighborhood safety. Public awareness programs and strong community policing are common in both cities, seeking to further enhance safety levels.
City-data.com crime index counts serious crimes and violent crime more heavily. It adjusts for the number of visitors and daily workers commuting into cities. (higher means more crime, U.S. average = 301.1)
City-data.com crime index counts serious crimes and violent crime more heavily. It adjusts for the number of visitors and daily workers commuting into cities. (higher means more crime, U.S. average = 301.1)
Sex Offenders
According to our data, there are 807 registered sex offenders living in Long Beach and 232 registered sex offenders living in . The ratio of residents to sex offenders in Long Beach is 583 to 1; the ratio in Inglewood is 477 to 1. The number of registered sex offenders compared to the number of residents in Long Beach is near to than in Inglewood.
Cost of Living
When comparing the cost of living, Long Beach is generally more expensive than Inglewood. Housing is the biggest driver of cost differences, with median home prices in Long Beach noticeably higher than those in Inglewood. However, Inglewood, due to its ongoing development, is experiencing an increase in housing costs. Other everyday expenses, including groceries, healthcare, and transportation, are typically more expensive in Long Beach.
Income Tax
For income tax, both cities adhere to California's state income tax bracket, which ranges from 1% to 13.3% based on income.
Property Tax
The average effective property tax rate in Los Angeles County is 0.72%, affecting both Long Beach and Inglewood.
Sales Tax
The sales tax in Long Beach is currently 10.25%, while Inglewood has a slightly higher rate at 10.50%. Both rates are inclusive of the California state sales tax.
Income
Type
Long Beach
Inglewood
Estimated median household income
$73,905
$68,135
Estimated per capita income
$37,217
$30,559
Cost of living index (U.S. average is 100)
142
142.3
If you make $50,000 in Long Beach, you will have to make $50,106 in Inglewood to maintain the same standard of living.
Geographical Conditions
Long Beach, as the name suggests, is a coastal city with a beach-front, boasting oceanside views and a busy port. Inglewood lies further inland, characterized by urban development and residential neighborhoods, with the addition of the Forum and SoFi Stadium, marking iconic spots in the city.
Both cities have a range of schooling opportunities and public libraries. The Long Beach Unified School District is known for its award-winning schools and diverse student body. Inglewood's schools have shown educational progress recently, with more funding aimed at enhancing student achievement. Both cities host various community colleges, while Long Beach is also home to California State University, Long Beach.
Work and economic conditions somewhat differ between the two cities. Long Beach's economy is diverse, featuring trade, education, healthcare, and arts sectors. The Port of Long Beach significantly contributes to the city's economy. On the other hand, Inglewood has a growing business sector, with businesses ranging from retail trade to healthcare. The recent development of SoFi Stadium has also brought additional jobs to the area.
Biggest Employers
In Long Beach, some of the biggest employers include Long Beach Unified School District, Long Beach Memorial Medical Center, and Boeing. For Inglewood, major employers include Inglewood Unified School District, Kroger Company, and Los Angeles County's Department of Social Services.
There were 304 building permits issued in Long Beach in 2012 (238 more than in 2011) compared to 153 building permits issued in Inglewood in 2012 (149 more than in 2011).
Weather
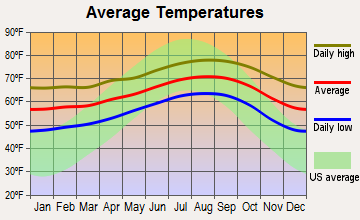
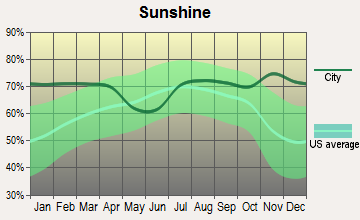
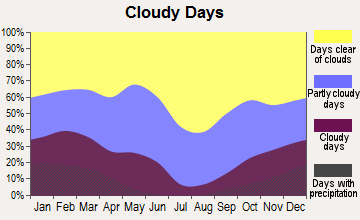
In terms of weather, both cities enjoy a typical Southern California climate; mild, wet winters and dry, warm summers. Long Beach, being a coastal city, features a cool ocean breeze that moderates temperatures, making it slightly cooler than Inglewood especially during summer months. Both cities benefit from plenty of sunshine throughout the year, making them appealing for outdoor activities.
Weather and climate
Type
Long Beach
Inglewood
Temperature - Average
65.3°F
63.5°F
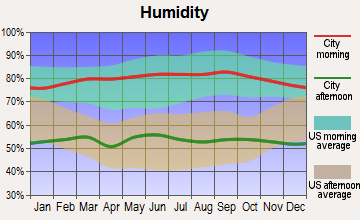
Humidity - Average morning or afternoon humidity
70.4%
61.1%
Humidity - Differences between morning and afternoon humidity
27%
16.2%
Humidity - Maximum monthly morning or afternoon humidity
79%
65.4%
Humidity - Minimum monthly morning or afternoon humidity
52%
49.1%
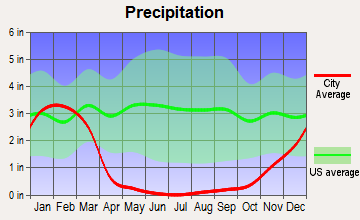
Precipitation - Yearly average
13.1 in
13.6 in
Snowfall - Yearly average
0 in
0 in
Clouds - Number of days clear of clouds
26.4%
27.5%
Sunshine amount - Average
78.4%
78.4%
Sunshine amount - Differences during a year
22%
22%
Sunshine amount - Maximum monthly
85%
85%
Sunshine amount - Minimum monthly
63%
63%
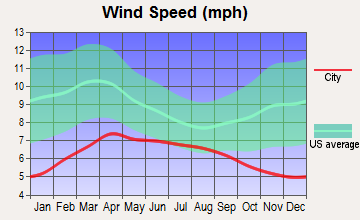
Wind speed - Average
6.1 mph
2.1 mph
Average climate in Long Beach, California
Average climate in Inglewood, California
Air pollution
Type
AQI
CO
NO2
OZONE
PB
PM10
PM25
SO2
Year
Long Beach
Inglewood
Long Beach
Inglewood
Long Beach
Inglewood
Long Beach
Inglewood
Long Beach
Inglewood
Long Beach
Inglewood
Long Beach
Inglewood
Long Beach
Inglewood
2018
124
134
0.37
0.35
17.2
11.9
22.1
27.9
0.008
0.008
27.5
27.5
13.5
15.0
0.7
0.5
2017
122
132
0.36
0.37
18.1
12.9
23.2
28.0
0.007
0.007
26.7
26.7
14.5
15.6
0.8
0.6
2016
115
118
0.36
0.36
18.5
12.2
21.9
28.4
0.007
0.007
24.1
24.1
11.6
14.5
0.9
0.5
2015
111
120
0.38
0.35
19.9
13.0
22.5
28.7
0.005
0.005
25.0
25.0
13.9
16.3
0.9
0.4
2014
127
129
0.50
0.45
20.3
13.6
22.0
28.1
0.007
0.007
26.7
26.4
14.3
17.9
1.3
0.4
2013
126
131
0.48
0.45
20.0
14.4
24.7
27.7
0.005
0.006
32.3
28.5
14.6
16.1
1.0
0.3
2012
132
137
0.48
0.45
19.3
14.6
24.4
27.1
0.004
0.007
30.8
27.9
14.1
16.6
0.6
0.4
2011
119
135
0.43
0.35
20.2
16.0
23.4
25.6
0.006
0.008
28.4
29.1
15.6
17.4
1.2
0.3
2010
115
125
0.38
0.44
20.8
15.6
22.7
24.3
0.011
0.018
24.1
28.0
11.9
15.5
0.7
0.6
2009
132
140
0.50
0.48
21.0
18.2
22.0
25.3
0.008
0.007
27.7
39.0
13.1
17.1
1.1
1.4
2008
124
134
0.53
0.43
20.8
19.4
23.2
24.9
0.008
0.008
27.2
36.7
21.6
21.3
1.0
1.2
2007
109
119
0.60
0.41
20.3
19.5
21.1
25.2
0.010
0.010
N/A
N/A
N/A
N/A
1.4
2.3
2006
119
122
0.76
0.39
21.4
20.0
19.9
25.2
0.005
0.005
N/A
N/A
N/A
N/A
1.7
1.9
2005
108
126
0.74
0.40
24.3
19.2
20.5
25.4
0.011
0.010
N/A
N/A
N/A
N/A
2.7
4.7
2004
125
135
0.56
0.57
28.0
22.6
22.9
27.7
0.012
0.011
N/A
N/A
N/A
N/A
2.0
2.5
2003
130
141
0.83
0.77
28.1
24.9
22.4
22.1
0.032
0.023
N/A
N/A
N/A
N/A
1.1
0.7
2002
120
142
0.90
0.84
29.6
25.7
22.2
24.1
0.011
0.015
N/A
N/A
N/A
N/A
2.8
1.4
2001
124
127
0.81
0.87
30.3
27.2
21.5
23.5
0.011
0.028
N/A
N/A
N/A
N/A
3.3
3.7
2000
142
140
0.71
0.90
31.5
28.8
19.6
21.4
0.018
0.031
N/A
N/A
N/A
N/A
2.0
2.4
Natural disasters
Type
Long Beach
Inglewood
Tornado activity compared to U.S. average
18.3%
17%
Earthquake activity compared to U.S. average
6,875.1%
6,956.7%
Natural disasters compared to U.S. average
57%
57%
Transportation
Both cities have good transportation networks and public transit systems. Both cities connect easily to other parts of Los Angeles County via freeways and public transit. Long Beach's transportation system includes buses, light rail, and bike sharing, whereas Inglewood is served by buses and the soon-to-open Metro Crenshaw/LAX Line.
Transport
Type
Long Beach
Inglewood
Amtrak stations
1
0
Amtrak stations nearby
3
3
FAA registered aircraft
312
25
FAA registered aircraft manufacturers and dealers
29
4
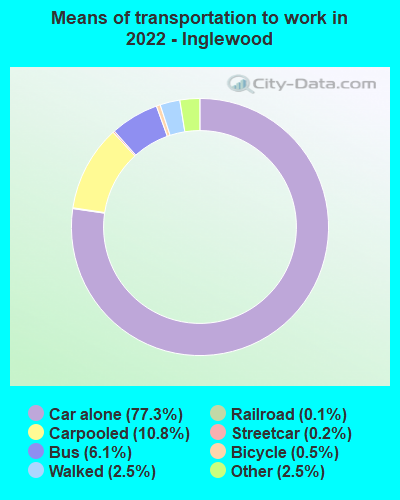
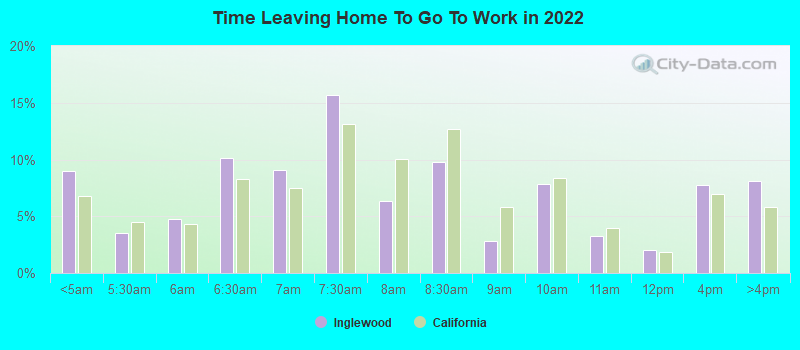
Means of transportation to work
Type
Long Beach
Inglewood
Bicycle
0.5%
0.5%
Bus
3.3%
4.6%
Carpooled
9.8%
11.1%
Car alone
81.8%
77.8%
Motorcycle
0.2%
0%
Railroad
0%
0.1%
Streetcar
0.1%
0.2%
Subway
0.5%
0.1%
Taxicab
0%
0.1%
Walked
2.8%
2.8%
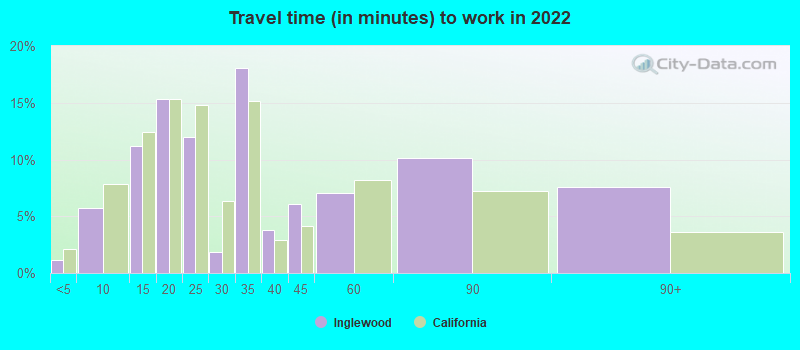
Average travel time to work
Type
Long Beach
Inglewood
Average
30.7 min
32.9 min
Other means
28.5 min
28.3 min
Public transportation
46.4 min
53.6 min
Private vehicle occupancy
Type
Long Beach
Inglewood
Average
1.1
1.2
Drove alone
89.7%
85.6%
In 2 person carpool
8.5%
9.5%
In 3 person carpool
1.4%
3.3%
In 4 person carpool
0.3%
1%
In 5-6 person carpool
0%
0.6%
How many people usually rode to work in the car, truck or van.
Real Estate
Long Beach real estate is higher concerning both selling prices and rents compared to Inglewood. This is largely due to Long Beach's location along the coast and the breadth of housing options available, from contemporary condos to historic craftsman homes. Inglewood, currently undergoing a real estate boom, offers more reasonable pricing, although prices have been climbing due to the influx of development.
Neighborhoods
Both cities offer varied neighborhoods. In Long Beach, there are plenty of beachfront neighborhoods like Belmont Shores, alongside urban areas like Downtown Long Beach. In Inglewood, communities range from the established, like Morningside Park, to the rapidly developing areas around SoFi Stadium.
Houses and residents
Type
Long Beach
Inglewood
Houses
179,856
40,083
Average household size (people)
2.8
3
Median year apartment built
1964
1962
Median year house/condo built
1954
1950
Length of stay in the house since moving in
15.7 years
18.2 years
Houses occupied
172,599 (96%)
37,972 (94.7%)
Houses occupied by owners
69,470 (40.2%)
14,241 (37.5%)
Houses occupied by renters
103,129 (59.8%)
23,731 (62.5%)
Median rent asked for vacant for-rent units
$1,057
$1,746
Median monthly housing costs
$1,692
$1,573
Median price asked for vacant for-sale houses and condos
$520,992
$524,210
Estimated median house or condo value
$693,600
$684,500
Median numbers of rooms
4.2
4.4
Median number of rooms in apartments
3.6
3.9
Median number of rooms in houses and condos
5.5
5.7
Median house price - detached houses
$900,658
$573,791
Median house price - in 2-unit structures
$823,515
$555,229
Median house price - in 3-to-4-unit structures
$495,928
$721,342
Median house price - in 5 or more unit structures
$488,399
$356,222
Median house price - Townhouses or other attached units
$634,684
$419,545
Median house price - All housing units
$805,766
$547,480
Median house age
62
62
Renting percentage
58.4%
63%
Housing density (houses/condos per square mile)
3,565.7
4,387.7
House value disparities
21.3%
17.8%
Household income disparities
44.7%
43.5%
Median household income for houses/condes with a mortgage
$116,421
$104,675
Median household income for apartments without a mortgage
$79,392
$69,359
Housing units without a mortgage
394 (0.8%)
217 (2.1%)
Housing units with both a second mortgage and home equity loan
3,069 (6.2%)
961 (9.3%)
Housing units with a mortgage
49,321 (99.2%)
10,120 (97.9%)
Housing units with a home equity loan
48 (0.1%)
196 (1.9%)
Housing units with a second mortgage
3,709 (7.5%)
1,492 (14.4%)
House/condo owner moved in on average (years ago)
15
18
House/condo renter moved in on average (years ago)
3
6
Housing units lacking complete kitchen facilities
2.6%
5.3%
Housing units lacking complete plumbing facilities
0.4%
1.2%
Housing units in structures
Housing units in structures
Long Beach
Inglewood
One, detached
40.2%
36.0%
One, attached
4.9%
5.8%
Two
5.3%
5.5%
3 or 4
8.8%
10.2%
5 to 9
10.4%
13.9%
10 to 19
10.8%
12.4%
20 to 49
8.0%
9.8%
50 or more
10.6%
6.2%
Mobile homes
0.8%
0.2%
Boats, RVs, vans, etc.
0.2%
0.1%
Median real estate property taxes paid for housing units
Self-employed workers in own not incorporated business
18,532
3,766
State government workers
6,550
1,834
Unpaid family workers
178
301
Industries and Occupations
Long Beach's proximity to the port makes the logistics industry prominent. Other main industries include healthcare, education, and public administration. Conversely, Inglewood's primary industries are healthcare, retail trade, manufacturing, and educational services. Artistically inclined occupations are also not uncommon in Inglewood, partly due to its rich cultural history.
Health diagnosing and treating practitioners and other technical occupations
4.9%
3.5%
Community and social service occupations
4.4%
3.1%
Personal care and service occupations
3.6%
1.8%
Arts, design, entertainment, sports, and media occupations
3.0%
3.4%
Building and grounds cleaning and maintenance occupations
2.9%
5.2%
Health technologists and technicians
2.8%
1.3%
Material moving occupations
2.8%
3.0%
Production occupations
2.7%
2.4%
Computer and mathematical occupations
1.9%
0.5%
Transportation occupations
1.4%
1.5%
Life, physical, and social science occupations
1.3%
1.8%
Legal occupations
1.3%
0.4%
Installation, maintenance, and repair occupations
0.3%
1.5%
Health Care
When it comes to health care, both cities offer numerous medical facilities. Long Beach is home to several large hospitals, including Long Beach Memorial Medical Center, one of the biggest employers in the city. Inglewood has a number of community health clinics and is in close proximity to several major hospitals in Los Angeles.
Long Beach boasts a range of infrastructures, from modern amenities to historic sites. The city is well maintained and continually improved, benefiting from investment in its buildings, roads, and parks. Inglewood is undergoing significant infrastructure development, particularly around the SoFi Stadium, with new housing, retail, and commercial spaces being built.
HMDA - Conventional home purchase loans - Applications denied
Year
Long Beach
Inglewood
1999
1,159
304
2000
710
315
2001
677
292
2002
708
304
2003
1,861
450
2004
2,162
541
2005
3,065
755
2006
3,591
942
2007
2,287
534
2008
887
160
2009
475
78
Culture and Food
Both cities are culturally diverse, with rich food scenes to match. Long Beach is known for its multicultural dining options, from Latin American cuisine to seafood and vegan eateries. Inglewood is especially noted for soul food, Jamaican cuisine, and authentic Mexican restaurants. Both cities also host annual cultural festivals and events.
Sports Teams
Both cities offer sports activities, but Inglewood stands out as the home of the SoFi Stadium, which hosts both the Los Angeles Rams and the Los Angeles Chargers NFL teams. Long Beach, however, hosts various athletic events, including the Long Beach Grand Prix, and has numerous recreational sports leagues.


 Long Beach, CA
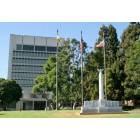
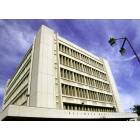
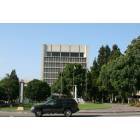
 Inglewood, CA