Comparison between Long Beach, a bustling Californian city with a lively urban vibe, and South Antelope Valley, a smaller community with rural charm, encompasses various factors. From crime rates and cost of living to healthcare and sporting opportunities, these two locations contrast and complement in unique dimensions. This detailed comparison considers each aspect as per the purview of residents looking to relocate and tourists seeking a memorable stay.
Long Beach has a higher crime rate than the national average, which could be attributed to its urban nature and dense population. However, it has a robust police department and several community initiatives focused on reducing crime. South Antelope Valley, though not completely devoid of crime, generally experiences lower crime rates due to its smaller population and rural setting.
Cost of Living
Long Beach's cost of living is significantly higher than the national average and South Antelope Valley, reflecting its urban setting and proximity to Los Angeles. South Antelope Valley offers a more affordable lifestyle, attracting those who prefer a quieter, more economical living.
Income Tax
The income tax is the same in both cities, guided by California's progressive income tax system, which is also among the highest in the nation.
Property Tax
Long Beach has higher property taxes due to its expensive real estate. South Antelope Valley has lower property tax rates due to the more affordable housing market.
Sales Tax
Both Long Beach and South Antelope Valley fall under California's sales tax umbrella, which is higher than the national average.
Income
Type
Long Beach
South Antelope Valley
Estimated median household income
$73,905
$93,491
Estimated per capita income
$37,217
$35,012
Cost of living index (U.S. average is 100)
142
139.6
If you make $50,000 in South Antelope Valley, you will have to make $50,860 in Long Beach to maintain the same standard of living.
Geographical Conditions
Long Beach is characterized by its scenic beaches, while South Antelope Valley is known for its desert landscapes and open spaces.
Geographical information
Type
Long Beach
South Antelope Valley
Land area
50.4 sq. miles
1,187.8 sq. miles
Population density
9,041.5 people per sq. mile
144.4 people per sq. mile
Relative area comparison
Long Beach, CA South Antelope Valley, CA
Education
Long Beach hosts several renowned schools and universities with a strong emphasis on education. Similarly, South Antelope Valley, though having fewer institutions, provides quality education through its public and private schools.
Long Beach, being a larger city, offers a more diverse economy with opportunities in various sectors, including shipping, healthcare, and education. South Antelope Valley's economy remains smaller and more focused on sectors like agriculture and local businesses.
Biggest Employers
In Long Beach, some of the biggest employers include Long Beach Memorial Medical Center, Long Beach Unified School District, and California State University Long Beach. South Antelope Valley, as a smaller community, has fewer major employers, primarily concentrated in education and local services.
Weather
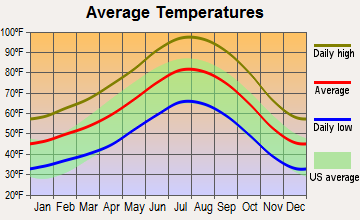
Both areas typically enjoy Southern California's pleasant climate. Long Beach, located on the Pacific coast, experiences mild, warm weather year-round with cooler evenings. South Antelope Valley endures hotter summers and colder winters due to its high desert location.
Weather and climate
Type
Long Beach
South Antelope Valley
Temperature - Average
65.3°F
62.8°F
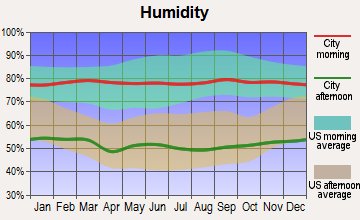
Humidity - Average morning or afternoon humidity
70.4%
62.6%
Humidity - Differences between morning and afternoon humidity
27%
17%
Humidity - Maximum monthly morning or afternoon humidity
79%
67.4%
Humidity - Minimum monthly morning or afternoon humidity
52%
50.4%
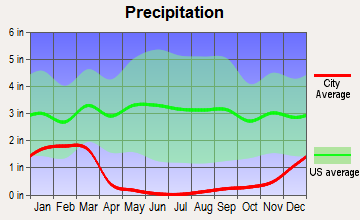
Precipitation - Yearly average
13.1 in
8.3 in
Snowfall - Yearly average
0 in
0 in
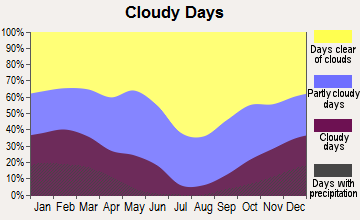
Clouds - Number of days clear of clouds
26.4%
28.4%
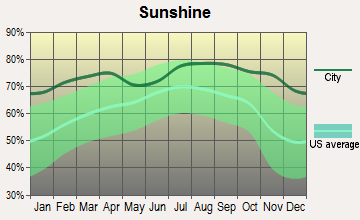
Sunshine amount - Average
78.4%
78.4%
Sunshine amount - Differences during a year
22%
21.9%
Sunshine amount - Maximum monthly
85%
84.9%
Sunshine amount - Minimum monthly
63%
63%
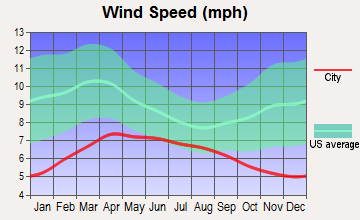
Wind speed - Average
6.1 mph
3 mph
Average climate in Long Beach, California
Average climate in South Antelope Valley, California
Air pollution
Type
AQI
CO
NO2
OZONE
PB
PM10
PM25
SO2
Year
Long Beach
South Antelope Valley
Long Beach
South Antelope Valley
Long Beach
South Antelope Valley
Long Beach
South Antelope Valley
Long Beach
Long Beach
South Antelope Valley
Long Beach
South Antelope Valley
Long Beach
2018
124
95
0.37
0.21
17.2
8.7
22.1
39.8
0.008
N/A
27.5
25.4
13.5
7.3
0.7
N/A
2017
122
89
0.36
0.26
18.1
7.8
23.2
38.3
0.007
N/A
26.7
25.4
14.5
7.4
0.8
N/A
2016
115
91
0.36
0.25
18.5
8.1
21.9
40.2
0.007
N/A
24.1
25.0
11.6
7.7
0.9
N/A
2015
111
104
0.38
0.27
19.9
6.7
22.5
41.5
0.005
N/A
25.0
18.4
13.9
N/A
0.9
N/A
2014
127
90
0.50
0.16
20.3
8.2
22.0
38.7
0.007
N/A
26.7
22.7
14.3
N/A
1.3
N/A
2013
126
96
0.48
0.20
20.0
8.0
24.7
39.4
0.005
N/A
32.3
22.5
14.6
N/A
1.0
N/A
2012
132
89
0.48
0.28
19.3
8.9
24.4
40.5
0.004
N/A
30.8
29.5
14.1
N/A
0.6
N/A
2011
119
97
0.43
0.27
20.2
11.7
23.4
41.9
0.006
N/A
28.4
19.7
15.6
N/A
1.2
N/A
2010
115
93
0.38
0.16
20.8
11.7
22.7
41.8
0.011
N/A
24.1
19.0
11.9
N/A
0.7
N/A
2009
132
103
0.50
0.15
21.0
12.7
22.0
40.9
0.008
N/A
27.7
20.6
13.1
N/A
1.1
N/A
2008
124
98
0.53
0.17
20.8
13.2
23.2
37.7
0.008
N/A
27.2
26.5
21.6
N/A
1.0
N/A
2007
109
97
0.60
0.20
20.3
14.5
21.1
37.5
0.010
N/A
N/A
23.8
N/A
N/A
1.4
N/A
2006
119
95
0.76
0.24
21.4
14.9
19.9
35.6
0.005
N/A
N/A
23.6
N/A
N/A
1.7
N/A
2005
108
102
0.74
0.23
24.3
15.4
20.5
36.4
0.011
N/A
N/A
22.2
N/A
N/A
2.7
N/A
2004
125
109
0.56
0.25
28.0
14.5
22.9
39.1
0.012
N/A
N/A
24.8
N/A
N/A
2.0
N/A
2003
130
112
0.83
0.27
28.1
15.0
22.4
38.1
0.032
N/A
N/A
26.4
N/A
N/A
1.1
N/A
2002
120
113
0.90
0.30
29.6
15.7
22.2
38.5
0.011
N/A
N/A
28.8
N/A
N/A
2.8
N/A
2001
124
103
0.81
0.39
30.3
15.8
21.5
37.8
0.011
N/A
N/A
25.9
N/A
N/A
3.3
N/A
2000
142
109
0.71
0.52
31.5
15.6
19.6
37.2
0.018
N/A
N/A
26.6
N/A
N/A
2.0
N/A
Natural disasters
Type
Long Beach
South Antelope Valley
Tornado activity compared to U.S. average
18.3%
13.5%
Earthquake activity compared to U.S. average
6,875.1%
7,590.6%
Natural disasters compared to U.S. average
57%
57%
Transportation
Long Beach provides extensive public transportation including buses, light rail, and ferries. Inter-city commuting is fairly easy, thanks to the well-maintained road networks. South Antelope Valley, on the other hand, relies more on private vehicles, with limited public transit options.
Transport
Type
Long Beach
South Antelope Valley
Amtrak stations
1
0
Amtrak stations nearby
3
2
FAA registered aircraft
312
0
FAA registered aircraft manufacturers and dealers
29
0
Means of transportation to work
Type
Long Beach
South Antelope Valley
Bicycle
0.5%
0.2%
Bus
3.3%
1.5%
Carpooled
9.8%
20.6%
Car alone
81.8%
71.7%
Motorcycle
0.2%
0.3%
Railroad
0%
0.7%
Subway
0.5%
0.1%
Walked
2.8%
0.8%
Average travel time to work
Type
Long Beach
South Antelope Valley
Average
30.7 min
42.6 min
Real Estate
Long Beach's real estate is notably more expensive, with a wide range of options from beachfront properties to urban condos. In contrast, South Antelope Valley offers more affordable, rural-style housing options.
Neighborhoods
Long Beach is known for its diverse neighborhoods, each with a distinct character. South Antelope Valley has fewer, more homogenous neighborhoods, offering a quieter, rural atmosphere.
Houses and residents
Type
Long Beach
South Antelope Valley
Houses
179,856
55,065
Average household size (people)
2.8
3.4
Houses occupied
172,599 (96%)
50,690 (92.1%)
Houses occupied by owners
69,470 (40.2%)
37,922 (74.8%)
Houses occupied by renters
103,129 (59.8%)
12,768 (25.2%)
Median rent asked for vacant for-rent units
$1,057
$1,240
Median price asked for vacant for-sale houses and condos
$520,992
$1,138,428
Estimated median house or condo value
$693,600
$457,787
Median number of rooms in apartments
3.6
4.9
Median number of rooms in houses and condos
5.5
7.1
Renting percentage
58.4%
28.4%
Housing density (houses/condos per square mile)
3,565.7
46.4
Household income disparities
44.7%
40.2%
Housing units without a mortgage
394 (0.8%)
3,586 (10.7%)
Housing units with both a second mortgage and home equity loan
3,069 (6.2%)
80 (0.2%)
Housing units with a mortgage
49,321 (99.2%)
30,054 (89.3%)
Housing units with a home equity loan
48 (0.1%)
1,716 (5.1%)
Housing units with a second mortgage
3,709 (7.5%)
5,170 (15.4%)
Housing units lacking complete kitchen facilities
2.6%
1.7%
Housing units lacking complete plumbing facilities
Self-employed workers in own not incorporated business
18,532
5,299
State government workers
6,550
1,939
Unpaid family workers
178
282
Industries and Occupations
Long Beach hosts diverse industries, while South Antelope Valley primarily revolves around farming and local businesses. In Long Beach, shipping and healthcare are among the top employment sectors; in South Antelope Valley, agriculture and related industries dominate.
Health Care
Long Beach has numerous hospitals and healthcare centers, providing high-quality healthcare. South Antelope Valley, despite having fewer facilities, still maintains standard levels of healthcare service.
Infrastructure
As a larger city, Long Beach has developed infrastructure, including modern buildings, robust public transport, and plenty of amenities. South Antelope Valley, however, retains a more rural charm with its infrastructure.
Infrastructure
Type
Long Beach
South Antelope Valley
TV stations
5
20
Culture and Food
Long Beach boasts a vibrant culture with a renowned arts scene, diverse cuisines, and music festivals. South Antelope Valley has a more local culture, with homegrown food and community events.
Sports Teams
Long Beach doesn't host any major league sports teams but has an active sports culture, with several minor league teams and the Grand Prix. South Antelope Valley, being smaller, doesn't have any notable sports team presence.
 Long Beach, CA
 South Antelope Valley, CA