California presents variety in its many cities, including Long Beach and the South Bay Cities. From crime rate variations to distinct cultural experiences, differences abound in these diverse environments. We'll delve into various socio-economic aspects and lifestyle elements to provide a comprehensive picture and comparison.
Comparatively, Long Beach has a moderately higher crime rate than many South Bay Cities. While the rates have been gradually decreasing over the years, it's still recommended for residents to take safety precautions. On the other hand, South Bay Cities, including Torrance, Rancho Palos Verdes, and Hermosa Beach, boast of lower crime rates, making them relatively safer.
Cost of Living
Cost of living varies across cities, with more expensive cost of living in South Bay Cities, particularly in real estate. It's worth noting that healthcare, food, and transportation costs are also above the national average in both regions.
Income Tax
Income tax in California ranges from 1.0% to 13.3%, depending on income levels, and applies uniformly across all cities, including Long Beach and South Bay Cities.
Property Tax
The average property tax rate for both Long Beach and South Bay Cities is around 0.72% of the home's market value, slightly below the national average.
Sales Tax
Both Long Beach and South Bay Cities have a combined city and state sales tax rate of 9.50%, as of 2022.
Income
Type
Long Beach
South Bay Cities
Estimated median household income
$73,905
$138,860
Estimated per capita income
$37,217
$85,219
Cost of living index (U.S. average is 100)
142
175.3
If you make $50,000 in Long Beach, you will have to make $61,725 in South Bay Cities to maintain the same standard of living.
Geographical Conditions
Long Beach is marked by its urban waterfront setting, while South Bay Cities are known for their scenic coastal beauty, hillside views, and sandy beaches.
Geographical information
Type
Long Beach
South Bay Cities
Land area
50.4 sq. miles
17.2 sq. miles
Population density
9,041.5 people per sq. mile
7,818.1 people per sq. mile
Relative area comparison
Long Beach, CA South Bay Cities, CA
Education
School districts like Long Beach Unified School District offer good education, but South Bay districts — for example, Torrance and Manhattan Beach — often outshine with their high-ranking public schools.
Long Beach, being a larger city, has a diverse economy powered mainly by healthcare, education, technology, and trade sectors. South Bay Cities' economy is strongly influenced by aerospace, petroleum, healthcare, and manufacturing industries.
Biggest Employers
Long Beach’s largest employers include Long Beach Memorial Medical Center and Long Beach Unified School District. In South Bay Cities, top employers are aerospace companies like Boeing, Northrop Grumman, and larger regional employers like UCLA Health.
Weather
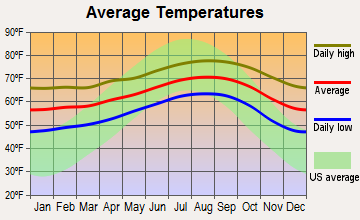
As Pacific coastal cities, both Long Beach and South Bay Cities enjoy a Mediterranean climate. Mild winters and warm, dry summers are common in both regions. Yet, the South Bay region is a tad cooler due to the oceanic influence.
Weather and climate
Type
Long Beach
South Bay Cities
Temperature - Average
65.3°F
63.3°F
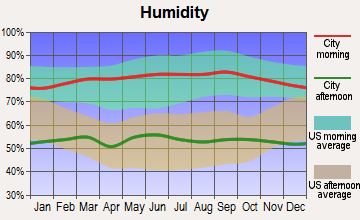
Humidity - Average morning or afternoon humidity
70.4%
64.6%
Humidity - Differences between morning and afternoon humidity
27%
19.6%
Humidity - Maximum monthly morning or afternoon humidity
79%
70.5%
Humidity - Minimum monthly morning or afternoon humidity
52%
51%
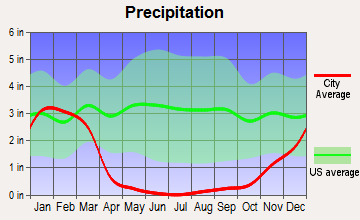
Precipitation - Yearly average
13.1 in
13.5 in
Snowfall - Yearly average
0 in
0 in
Clouds - Number of days clear of clouds
26.4%
24.7%
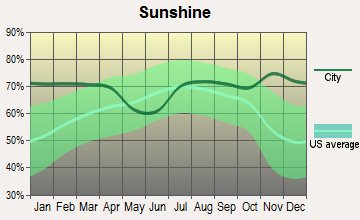
Sunshine amount - Average
78.4%
78.4%
Sunshine amount - Differences during a year
22%
22%
Sunshine amount - Maximum monthly
85%
85%
Sunshine amount - Minimum monthly
63%
63%
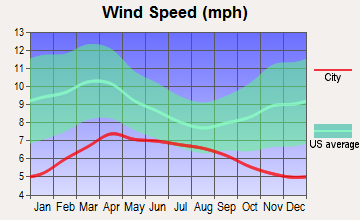
Wind speed - Average
6.1 mph
3.6 mph
Average climate in Long Beach, California
Average climate in South Bay Cities, California
Air pollution
Type
AQI
CO
NO2
OZONE
PB
PM10
PM25
SO2
Year
Long Beach
South Bay Cities
Long Beach
South Bay Cities
Long Beach
South Bay Cities
Long Beach
South Bay Cities
Long Beach
South Bay Cities
Long Beach
South Bay Cities
Long Beach
South Bay Cities
Long Beach
South Bay Cities
2018
124
134
0.37
0.34
17.2
12.2
22.1
27.9
0.008
0.008
27.5
N/A
13.5
14.8
0.7
0.6
2017
122
132
0.36
0.35
18.1
13.1
23.2
28.0
0.007
0.007
26.7
N/A
14.5
15.5
0.8
0.7
2016
115
117
0.36
0.35
18.5
12.5
21.9
28.4
0.007
0.007
24.1
N/A
11.6
13.9
0.9
0.6
2015
111
120
0.38
0.34
19.9
13.3
22.5
28.7
0.005
0.005
25.0
N/A
13.9
15.7
0.9
0.5
2014
127
127
0.50
0.46
20.3
13.9
22.0
28.2
0.007
0.007
26.7
N/A
14.3
16.8
1.3
0.4
2013
126
128
0.48
0.45
20.0
14.7
24.7
27.9
0.005
0.006
32.3
29.2
14.6
15.3
1.0
0.4
2012
132
136
0.48
0.45
19.3
14.8
24.4
27.4
0.004
0.006
30.8
29.1
14.1
15.6
0.6
0.4
2011
119
135
0.43
0.34
20.2
16.2
23.4
25.8
0.006
0.007
28.4
28.8
15.6
17.0
1.2
0.4
2010
115
123
0.38
0.43
20.8
15.8
22.7
24.4
0.011
0.016
24.1
26.7
11.9
14.5
0.7
0.6
2009
132
140
0.50
0.47
21.0
18.0
22.0
25.5
0.008
0.007
27.7
38.9
13.1
16.0
1.1
1.5
2008
124
130
0.53
0.43
20.8
18.7
23.2
25.5
0.008
0.007
27.2
33.4
21.6
21.2
1.0
1.3
2007
109
118
0.60
0.40
20.3
18.7
21.1
25.8
0.010
0.009
N/A
N/A
N/A
N/A
1.4
2.5
2006
119
121
0.76
0.37
21.4
19.3
19.9
25.4
0.005
0.004
N/A
N/A
N/A
N/A
1.7
1.9
2005
108
126
0.74
0.38
24.3
18.4
20.5
26.0
0.011
0.009
N/A
N/A
N/A
N/A
2.7
5.0
2004
125
135
0.56
0.55
28.0
22.2
22.9
28.2
0.012
0.010
N/A
N/A
N/A
N/A
2.0
2.5
2003
130
141
0.83
0.77
28.1
24.8
22.4
22.2
0.032
0.023
N/A
N/A
N/A
N/A
1.1
0.7
2002
120
142
0.90
0.84
29.6
25.4
22.2
24.3
0.011
0.014
N/A
N/A
N/A
N/A
2.8
1.4
2001
124
127
0.81
0.86
30.3
26.8
21.5
23.9
0.011
0.027
N/A
N/A
N/A
N/A
3.3
3.8
2000
142
140
0.71
0.89
31.5
28.7
19.6
21.7
0.018
0.031
N/A
N/A
N/A
N/A
2.0
2.4
Natural disasters
Type
Long Beach
South Bay Cities
Tornado activity compared to U.S. average
18.3%
16.5%
Earthquake activity compared to U.S. average
6,875.1%
6,838.1%
Natural disasters compared to U.S. average
57%
57%
Transportation
Long Beach has an efficient public transportation system, including buses and the Metro Rail. Traffic is a usual concern for South Bay Cities residents, but the area also offers well-connected public transit systems.
Transport
Type
Long Beach
South Bay Cities
Amtrak stations
1
0
Amtrak stations nearby
3
3
FAA registered aircraft
312
0
FAA registered aircraft manufacturers and dealers
29
0
Means of transportation to work
Type
Long Beach
South Bay Cities
Bicycle
0.5%
0.6%
Bus
3.3%
0.8%
Carpooled
9.8%
7%
Car alone
81.8%
83.7%
Motorcycle
0.2%
0.4%
Subway
0.5%
0%
Taxicab
0%
0.1%
Walked
2.8%
1.7%
Average travel time to work
Type
Long Beach
South Bay Cities
Average
30.7 min
28.7 min
Real Estate
Real estate in Long Beach is comparatively more affordable than in many South Bay Cities. It's also characterized by a diverse range of architectural styles. South Bay Cities, particularly Manhattan Beach and Hermosa Beach, are known for their luxury properties and higher prices.
Neighborhoods
Long Beach features a diverse array of neighborhoods, each with its unique culture and feel. South Bay Cities host luxurious residential areas, stunning beach communities, and tightly-knit suburban neighborhoods.
Houses and residents
Type
Long Beach
South Bay Cities
Houses
179,856
61,678
Average household size (people)
2.8
2.3
Houses occupied
172,599 (96%)
59,576 (96.6%)
Houses occupied by owners
69,470 (40.2%)
30,565 (51.3%)
Houses occupied by renters
103,129 (59.8%)
29,011 (48.7%)
Median rent asked for vacant for-rent units
$1,057
$2,992
Median price asked for vacant for-sale houses and condos
$520,992
$1,138,428
Estimated median house or condo value
$693,600
Over $1,000,000
Median number of rooms in apartments
3.6
3.7
Median number of rooms in houses and condos
5.5
5.9
Renting percentage
58.4%
47%
Housing density (houses/condos per square mile)
3,565.7
3,588.8
Household income disparities
44.7%
34.3%
Housing units without a mortgage
394 (0.8%)
4,909 (19.1%)
Housing units with both a second mortgage and home equity loan
3,069 (6.2%)
35 (0.1%)
Housing units with a mortgage
49,321 (99.2%)
20,832 (80.9%)
Housing units with a home equity loan
48 (0.1%)
2,171 (8.4%)
Housing units with a second mortgage
3,709 (7.5%)
2,736 (10.6%)
Housing units lacking complete kitchen facilities
2.6%
0.6%
Housing units lacking complete plumbing facilities
Self-employed workers in own not incorporated business
18,532
7,749
State government workers
6,550
1,733
Unpaid family workers
178
116
Industries and Occupations
In Long Beach, the leading industries are healthcare, educational services, and retail trade. Conversely, the South Bay Cities have a high reliance on industries such as aerospace and petroleum.
Health Care
Long Beach hosts renowned health institutions like the Long Beach Memorial Medical Center. South Bay Cities benefit from reputable health centers as well, such as Torrance Memorial Medical Center and Providence Little Company of Mary.
Infrastructure
Long Beach boasts of more established infrastructures, like the Port of Long Beach, the second busiest container port in the U.S. In contrast, South Bay Cities’ infrastructures are more residentially centered, improving local living conditions.
Infrastructure
Type
Long Beach
South Bay Cities
TV stations
5
3
Culture and Food
Long Beach flaunts a more vibrant, urban culture with numerous festivals and a diverse culinary scene. South Bay Cities showcase a relaxed, beach town vibe with upscale dining options and boutique shopping.
Sports Teams
Long Beach doesn't host any major professional sports teams but it has a rich sports culture through its local college teams. The South Bay region, too, doesn't have major sports teams but proximity to Los Angeles allows access to major sports events.
 Long Beach, CA
 South Bay Cities, CA