Los Angeles, California, and Houston, Texas, are two of the biggest cities in the United States, attracting many residents and tourists. Both cities have unique characteristics that make them stand out, from their economic opportunities and lifestyle to their cultural scenes and geographical features. However, they significantly differ in many aspects, such as crime rates, weather, education, economy, infrastructure, taxation, and healthcare. This detailed comparison will serve as a guide for either relocation or tourism purposes.
Distance between
Los Angeles, CA and
Houston, TX : 1,377.8 miles
Los Angeles's population is larger by 68%. Its population has grown by 154,477 people (4.2%) since 2000. The population of Houston has grown by 334,619 people (17.1%) during that time.
Both Los Angeles and Houston have their crime challenges. According to the FBI's Uniform Crime Reporting Program, Los Angeles has higher crime rates, especially regarding violent crimes. However, the rejuvenation of downtown LA and increased police presence improved the safety in some neighborhoods. On the other hand, Houston's crime rates are lower but have increased in recent years. Traveling in groups at night and understanding the safest routes is a precaution advised in both cities.
City-data.com crime index counts serious crimes and violent crime more heavily. It adjusts for the number of visitors and daily workers commuting into cities. (higher means more crime, U.S. average = 301.1)
City-data.com crime index counts serious crimes and violent crime more heavily. It adjusts for the number of visitors and daily workers commuting into cities. (higher means more crime, U.S. average = 301.1)
Sex Offenders
According to our data, there are 4,425 registered sex offenders living in Los Angeles and 7,864 registered sex offenders living in . The ratio of residents to sex offenders in Los Angeles is 899 to 1; the ratio in Houston is 293 to 1. The number of registered sex offenders compared to the number of residents is a lot smaller in Los Angeles than in Houston.
Cost of Living
Los Angeles is recognized as one of the most expensive cities in the U.S. The high cost of living is mostly driven by high housing prices. Houston, comparatively, offers a lower cost of living. Cheaper housing and generally lower prices for goods and services make Houston an attractive destination for those seeking urban living on a budget.
Income Tax
California has some of the highest state income taxes in the U.S., reaching up to 13.3% for top earners. This tax doesn't exist in Texas, as it's one of the seven states that doesn't collect state income tax, which can lead to significant savings for residents.
Property Tax
Los Angeles has a lower property tax rate, generally about 0.76%, although high property values can result in significant tax bills. Houston’s property tax rate is higher, generally about 2.1%, although lower property values can offset this somewhat.
Sales Tax
California has a high sales tax rate at 7.25%, and Los Angeles County adds a 2.25% additional rate. Texas's state-wide sales tax rate is 6.25%, and Houston adds an additional 2% to that rate.
Income
Type
Los Angeles
Houston
Estimated median household income
$70,372
$55,499
Estimated per capita income
$39,509
$36,265
Cost of living index (U.S. average is 100)
145.1
97.2
If you make $50,000 in Houston, you will have to make $74,640 in Los Angeles to maintain the same standard of living.
Geographical Conditions
Los Angeles has a diverse geography, from the sandy beaches along the Pacific Ocean to the San Gabriel Mountains. Houston, by contrast, is located on the Gulf Coastal Plain, with bayous running through the city and the Gulf of Mexico nearby.
Both LA and Houston have a multitude of educational opportunities. Los Angeles, home to renowned universities like the University of Southern California and the University of California, Los Angeles, has a higher percentage of residents with a bachelor's degree or higher. Houston, however, is catching up with institutions such as Rice University and the University of Houston. Both cities have numerous public and private schools for K-12 education.
Los Angeles has a larger and more diversified economy, encompassing entertainment, technology, fashion, and tourism sectors. Houston’s economy, though sizable, is primarily based on the energy – particularly oil and gas, biomedical research, and aeronautics. Both cities have strong job markets, but work availability can depend significantly on your industry of interest.
Biggest Employers
In Los Angeles, some of the biggest employers are the county of Los Angeles, the Los Angeles Unified School District, and the University of Southern California. In Houston, some of the largest employers include Texas Medical Center, Houston Independent School District, and ExxonMobil.
There were 2,475 building permits issued in Los Angeles in 2012 (1950 more than in 2011) compared to 7,146 building permits issued in Houston in 2012 (4571 more than in 2011).
In Los Angeles (Los Angeles County), 69.7% voted for Democrats and 27.8% for Republicans in 2012 Presidential Election. In Houston (Harris County), 49.4% voted for Democrats and 49.3% for Republicans.
Elections
Type
Democrats
Republicans
Other
Year
Los Angeles
Houston
Los Angeles
Houston
Los Angeles
Houston
2020
71.0%
56.0%
26.9%
42.7%
2.1%
1.3%
2016
72.0%
54.0%
22.5%
41.6%
5.5%
4.4%
2012
69.7%
49.4%
27.8%
49.3%
2.4%
1.3%
2008
69.2%
50.5%
28.8%
48.9%
1.9%
0.6%
2004
63.3%
44.6%
35.7%
54.9%
1.0%
0.5%
2000
63.6%
43.0%
32.4%
54.4%
4.0%
2.6%
1996
59.3%
45.2%
31.0%
49.2%
9.7%
5.6%
Breakdown of population affiliated with a religious congregation
Type
Adherents
Congregations
Religion
Los Angeles
Houston
Los Angeles
Houston
CATHOLIC CHURCH
36.1%
18.1%
4.7%
3.6%
SOUTHERN BAPTIST CONVENTION
1.0%
14.2%
9.0%
26.8%
MUSLIM ESTIMATE
0.7%
2.9%
1.0%
1.6%
AMERICAN BAPTIST CHURCHES IN THE USA
0.5%
0.0%
3.1%
0.1%
SEVENTH DAY ADVENTIST CHURCH
0.5%
0.3%
2.4%
1.7%
EPISCOPAL CHURCH
0.4%
1.0%
1.4%
1.4%
LUTHERAN CHURCH
0.2%
0.7%
1.6%
1.5%
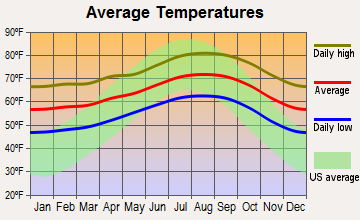
Weather
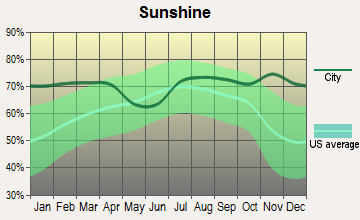
Los Angeles features a Mediterranean climate with mild, wet winters and warm, dry summers. The city boasts over 280 sunny days a year, making it a favorite destination for sun-loving tourists. In contrast, Houston experiences more frequent and unpredictable weather patterns. It has a humid subtropical climate with long, hot summers and mild, wet winters. Hurricane season can also significantly impact Houston’s weather from June to November.
Weather and climate
Type
Los Angeles
Houston
Temperature - Average
63.9°F
69.7°F
Humidity - Average morning or afternoon humidity
60.9%
80.3%
Humidity - Differences between morning and afternoon humidity
16.1%
36.7%
Humidity - Maximum monthly morning or afternoon humidity
65.1%
92.8%
Humidity - Minimum monthly morning or afternoon humidity
49%
56.1%
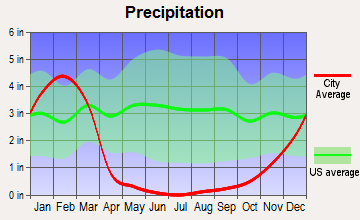
Precipitation - Yearly average
17.1 in
52.9 in
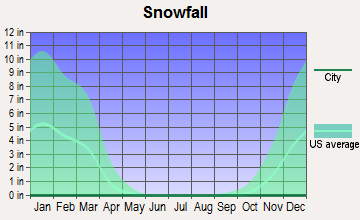
Snowfall - Yearly average
0 in
0.6 in
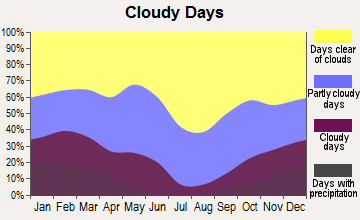
Clouds - Number of days clear of clouds
29.9%
15%
Sunshine amount - Average
78.4%
60.4%
Sunshine amount - Differences during a year
22%
24%
Sunshine amount - Maximum monthly
85%
67%
Sunshine amount - Minimum monthly
63%
43%
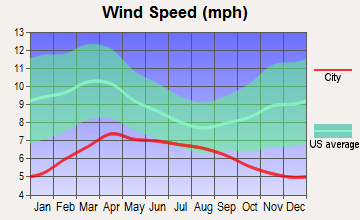
Wind speed - Average
2.1 mph
8.2 mph
Average climate in Los Angeles, California
Average climate in Houston, Texas
Air pollution
Type
AQI
CO
NO2
OZONE
PB
PM10
PM25
SO2
Year
Los Angeles
Houston
Los Angeles
Houston
Los Angeles
Houston
Los Angeles
Houston
Los Angeles
Houston
Los Angeles
Los Angeles
Houston
Los Angeles
Houston
2018
137
102
0.38
0.19
9.9
9.2
26.9
21.5
0.008
N/A
24.4
N/A
16.0
10.0
0.4
0.3
2017
136
96
0.41
0.16
10.3
9.4
27.2
23.1
0.007
N/A
25.0
N/A
16.2
9.1
0.5
0.3
2016
128
91
0.37
0.16
10.0
10.4
27.7
22.7
0.007
N/A
23.8
N/A
15.4
8.6
0.4
0.2
2015
128
109
0.38
0.15
10.9
10.1
28.5
21.7
0.005
N/A
21.8
N/A
17.4
9.9
0.3
0.2
2014
139
98
0.50
0.24
12.0
10.4
27.8
21.8
0.007
N/A
26.4
N/A
19.9
10.2
0.3
0.3
2013
140
106
0.48
0.25
11.8
11.1
26.2
23.0
0.007
N/A
25.5
N/A
19.0
10.6
0.3
0.4
2012
144
115
0.48
0.25
10.9
11.6
26.3
23.8
0.008
N/A
24.8
N/A
19.9
11.1
0.4
0.5
2011
141
118
0.38
0.27
13.4
10.8
24.2
24.6
0.009
N/A
32.4
N/A
18.3
11.5
0.3
0.8
2010
127
110
0.44
0.25
12.2
12.8
23.2
22.8
0.027
N/A
33.9
N/A
17.3
11.4
0.5
1.1
2009
153
115
0.51
0.21
16.0
10.5
24.0
22.1
0.009
N/A
45.2
N/A
18.8
11.4
1.1
1.0
2008
145
105
0.37
0.30
14.0
13.1
24.8
22.1
0.010
0.006
44.7
N/A
19.5
12.4
1.0
1.3
2007
121
119
0.39
0.31
14.0
15.2
24.3
20.5
0.013
0.006
N/A
N/A
N/A
13.5
1.9
1.9
2006
131
134
0.38
0.32
15.4
14.6
23.1
22.3
0.006
0.006
N/A
N/A
N/A
13.0
1.9
2.3
2005
132
126
0.43
0.42
12.8
16.3
24.1
22.8
0.012
0.005
N/A
N/A
N/A
13.9
3.7
3.5
2004
142
137
0.64
0.44
17.6
17.7
27.5
20.4
0.016
0.010
N/A
N/A
N/A
N/A
2.5
3.2
2003
145
146
0.94
0.62
27.1
17.0
19.8
20.9
0.030
0.009
N/A
N/A
N/A
N/A
2.1
3.2
2002
154
128
1.04
0.55
31.3
16.1
21.7
19.7
0.027
0.007
N/A
N/A
N/A
N/A
2.4
1.7
2001
135
147
1.16
0.44
37.0
18.4
18.7
19.6
0.041
0.008
N/A
N/A
N/A
N/A
2.4
2.5
2000
147
136
1.13
0.50
31.1
17.0
16.7
22.0
0.035
0.008
N/A
N/A
N/A
N/A
1.4
3.1
Natural disasters
Type
Los Angeles
Houston
Tornado activity compared to U.S. average
16.2%
187.3%
Earthquake activity compared to U.S. average
7,082.4%
63.9%
Natural disasters compared to U.S. average
57%
32%
Transportation
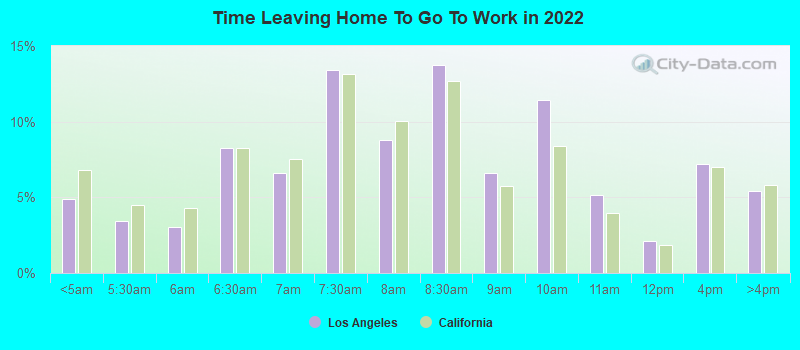
Los Angeles has a comprehensive public transit system, although traffic can be a significant issue. The Metro Rail, buses, and several bike-share programs offer alternatives to driving. In contrast, Houston is spread out, with commuting often requiring a car. The Metro offers some public transit options, but routes can be limited.
Transport
Type
Los Angeles
Houston
Amtrak stations
1
1
Amtrak stations nearby
3
2
FAA registered aircraft
669
1
FAA registered aircraft manufacturers and dealers
14
44
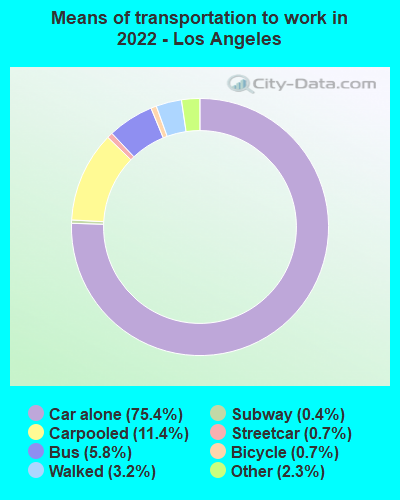
Means of transportation to work
Type
Los Angeles
Houston
Bicycle
0.6%
0.5%
Bus
5.8%
2.4%
Carpooled
10.6%
11.1%
Car alone
76.5%
81.2%
Ferryboat
0.2%
0%
Motorcycle
0.2%
0.1%
Railroad
0.1%
0.1%
Streetcar
0.5%
0%
Subway
0.2%
0%
Taxicab
0.1%
0.1%
Walked
3%
1.6%
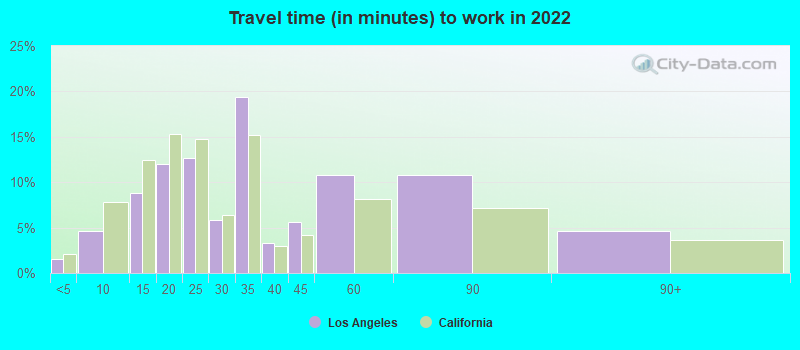
Average travel time to work
Type
Los Angeles
Houston
Average
34.8 min
32 min
Other means
28.5 min
27.1 min
Public transportation
46.4 min
47.6 min
Private vehicle occupancy
Type
Los Angeles
Houston
Average
1.2
1.2
Drove alone
87.4%
86.4%
In 2 person carpool
10.1%
9.7%
In 3 person carpool
1.6%
2.4%
In 4 person carpool
0.5%
0.9%
In 5-6 person carpool
0.3%
0.4%
In 7+ person carpool
0.1%
0.3%
How many people usually rode to work in the car, truck or van.
Real Estate
While both cities offer a variety of housing options, real estate in Los Angeles is generally more expensive than in Houston. LA boasts iconic properties in Hollywood and Beverly Hills, while Houston offers affordable homes and luxury mansions in areas such as the Museum District and River Oaks.
Neighborhoods
Los Angeles is known for its diverse neighborhoods, from the seaside views of Santa Monica to the urban allure of downtown LA. Houston also offers a variety of neighborhoods, from the historic charm of the Heights to the bustling activity of downtown Houston.
Houses and residents
Type
Los Angeles
Houston
Houses
1,542,391
1,028,763
Average household size (people)
2.8
2.6
Median year apartment built
1970
1985
Median year house/condo built
1957
1976
Length of stay in the house since moving in
16 years
14.4 years
Houses occupied
1,410,594 (91.5%)
924,981 (89.9%)
Houses occupied by owners
521,485 (37%)
390,226 (42.2%)
Houses occupied by renters
889,109 (63%)
534,755 (57.8%)
Median rent asked for vacant for-rent units
$2,146
$1,323
Median monthly housing costs
$1,845
$1,134
Median price asked for vacant for-sale houses and condos
$1,410,311
$334,556
Estimated median house or condo value
$812,800
$236,700
Median numbers of rooms
4.1
4.4
Median number of rooms in apartments
3.4
3.5
Median number of rooms in houses and condos
5.8
6.1
Median house price - detached houses
Over $1,000,000
$348,048
Median house price - in 2-unit structures
$906,968
$232,228
Median house price - in 3-to-4-unit structures
$752,598
$205,330
Median house price - in 5 or more unit structures
$760,192
$297,061
Median house price - mobile homes
$204,691
$68,903
Median house price - occupied boats, rvs, vans etc.
$134,345
$50,694
Median house price - Townhouses or other attached units
$809,932
$299,072
Median house price - All housing units
Over $1,000,000
$337,365
Median house age
57
40
Renting percentage
61.8%
54.6%
Housing density (houses/condos per square mile)
3,288.2
1,775.5
House value disparities
23.2%
40.9%
Household income disparities
47.7%
49%
Median household income for houses/condes with a mortgage
$122,032
$109,539
Median household income for apartments without a mortgage
$83,712
$65,707
Housing units without a mortgage
5,970 (1.6%)
4,386 (2.1%)
Housing units with both a second mortgage and home equity loan
28,556 (7.6%)
7,696 (3.6%)
Housing units with a mortgage
369,242 (98.4%)
207,809 (97.9%)
Housing units with a home equity loan
2,061 (0.5%)
421 (0.2%)
Housing units with a second mortgage
37,750 (10.1%)
11,969 (5.6%)
House/condo owner moved in on average (years ago)
15
13
House/condo renter moved in on average (years ago)
4
1
Housing units lacking complete kitchen facilities
3.1%
2.4%
Housing units lacking complete plumbing facilities
0.9%
1.5%
Housing units in structures
Housing units in structures
Los Angeles
Houston
One, detached
37.2%
43.2%
One, attached
5.7%
4.8%
Two
2.8%
2.2%
3 or 4
6.3%
4.4%
5 to 9
8.9%
7.1%
10 to 19
9.5%
10.9%
20 to 49
13.1%
7.7%
50 or more
15.9%
18.6%
Mobile homes
0.6%
0.9%
Boats, RVs, vans, etc.
0.0%
0.1%
Median real estate property taxes paid for housing units
Self-employed workers in own not incorporated business
200,073
75,956
State government workers
54,504
38,359
Unpaid family workers
4,643
2,429
Industries and Occupations
Los Angeles is renowned for its entertainment industry, with Hollywood being the center of American cinema. Other major industries include technology, fashion, and international trade. Houston, on the other hand, is a global hub for the energy industry, and also has strong healthcare, aerospace, and manufacturing sectors.
Both Los Angeles and Houston boast advanced healthcare systems. Los Angeles has numerous renowned hospitals like Cedars-Sinai and UCLA Medical Center. In Houston, you'll find the world's largest medical center, the Texas Medical Center.
Health (county statistics)
Type
Los Angeles
Houston
General health status score of residents in this county from 1 (poor) to 5 (excellent)
Los Angeles has a more extensive public transportation system, including an extensive freeway system, bus network, and growing subway and light rail lines. In contrast, Houston's infrastructure is more car-centric, with fewer public transit options. Investments are being made in both cities for infrastructural improvements and expansions.
Infrastructure
Type
Los Angeles
Houston
Hospitals
62
156
TV stations
21
26
Arenas or stadiums
5
6
Bank branches located here
385
755
Bank institutions located here
73
81
Main business address for public companies
69
197
Drinking water stations with no reported violations in the past
5
49
Drinking water stations with reported violations in the past
HMDA - Conventional home purchase loans - Applications denied
Year
Los Angeles
Houston
1999
10,170
9,163
2000
9,527
0
2001
7,928
0
2002
9,092
0
2003
14,114
8,173
2004
18,901
11,803
2005
22,524
15,127
2006
26,600
16,911
2007
19,394
10,643
2008
7,924
4,410
2009
4,210
2,279
Culture and Food
Both cities have rich cultural scenes. Los Angeles has a vibrant arts scene, hosting multiple art galleries, museums, and theaters. Hollywood also influences the city's cultural dynamic. Similarly, Houston has a thriving arts scene, including theater and a vibrant music culture. Both cities are culinary capitals, offering diverse food options and are home to numerous top-notch restaurants.
Sports Teams
Los Angeles is home to many professional sports teams such as the Lakers, the Clippers, the Dodgers, and the Rams. Houston also has its fair share of professional sports teams like the Rockets, the Texans, and the Astros.


 Los Angeles, CA
 Houston, TX