Los Angeles and San Diego, two of California's largest cities, offer distinct atmospheres, cultures, and lifestyle opportunities. Los Angeles, known for its bustling environment, entertainment industry, and fast-paced life, contrasts with San Diego's laid-back feel, beach-oriented lifestyle, and technological-forward economy. Dive into the detailed comparison below to understand how these two cities differ and what they have in common.
Distance between
Los Angeles, CA and
San Diego, CA : 114.8 miles
Los Angeles's population is larger by 179%. Its population has grown by 154,477 people (4.2%) since 2000. The population of San Diego has grown by 158,211 people (12.9%) during that time.
Los Angeles has a higher crime rate than San Diego. According to the FBI, the incidence of violent crime in Los Angeles is almost twice that of San Diego. However, specific neighborhoods in both cities can be more or less safe than the overall city averages. For tourists and newcomers, it's crucial to prioritize personal safety measures and be aware of your surroundings, regardless of the city.
City-data.com crime index counts serious crimes and violent crime more heavily. It adjusts for the number of visitors and daily workers commuting into cities. (higher means more crime, U.S. average = 301.1)
City-data.com crime index counts serious crimes and violent crime more heavily. It adjusts for the number of visitors and daily workers commuting into cities. (higher means more crime, U.S. average = 301.1)
Sex Offenders
According to our data, there are 4,425 registered sex offenders living in Los Angeles and 1,334 registered sex offenders living in . The ratio of residents to sex offenders in Los Angeles is 899 to 1; the ratio in San Diego is 1,054 to 1. The number of registered sex offenders compared to the number of residents in Los Angeles is near to than in San Diego.
Cost of Living
Living in Los Angeles is generally more expensive than in San Diego, particularly in terms of housing costs. Groceries, healthcare, utilities, and transportation are relatively similar in both cities, but Los Angeles' median home cost is significantly higher compared to San Diego.
Income Tax
Income tax rates are consistent across California, with the highest state income tax rates in the country.
Property Tax
The average property tax rate in Los Angeles is .72%, whereas San Diego's is .76%.
Sales Tax
Los Angeles has a slightly higher sales tax at 9.50% compared to San Diego's 7.75%.
Income
Type
Los Angeles
San Diego
Estimated median household income
$70,372
$93,042
Estimated per capita income
$39,509
$48,380
Cost of living index (U.S. average is 100)
145.1
126.4
If you make $50,000 in San Diego, you will have to make $57,397 in Los Angeles to maintain the same standard of living.
Geographical Conditions
San Diego has more beaches and a higher density of parks, emphasizing outdoor activities. Los Angeles, however, has a more urban sprawl but is also close to mountains and beaches.
Both cities host a variety of highly ranked public and private schools and notable universities. Los Angeles, home to UCLA and USC, has a greater number of higher educational institutions. Meanwhile, San Diego is known for its high-quality school districts and universities like UC San Diego.
Los Angeles, as a global city, has a diversified economy, with entertainment, manufacturing, technology, and fashion industries playing a significant role. In San Diego, emphasis is placed on science, defense, and healthcare industries. Overall, Los Angeles may offer more job opportunities due to its larger size and more diverse economy.
Biggest Employers
In Los Angeles, the biggest employers are the County of Los Angeles, the City of Los Angeles, and the University of Southern California. In San Diego, the U.S. Navy, University of California San Diego, and QualComm are among the largest employers.
There were 2,475 building permits issued in Los Angeles in 2012 (1950 more than in 2011) compared to 539 building permits issued in San Diego in 2012 (88 more than in 2011).
In Los Angeles (Los Angeles County), 69.7% voted for Democrats and 27.8% for Republicans in 2012 Presidential Election. In San Diego (San Diego County), 52.6% voted for Democrats and 45.0% for Republicans.
Elections
Type
Democrats
Republicans
Other
Year
Los Angeles
San Diego
Los Angeles
San Diego
Los Angeles
San Diego
2020
71.0%
60.3%
26.9%
37.5%
2.1%
2.1%
2016
72.0%
56.3%
22.5%
36.6%
5.5%
7.1%
2012
69.7%
52.6%
27.8%
45.0%
2.4%
2.4%
2008
69.2%
54.2%
28.8%
44.0%
1.9%
1.8%
2004
63.3%
46.7%
35.7%
52.9%
1.0%
0.4%
2000
63.6%
45.8%
32.4%
49.8%
4.0%
4.5%
1996
59.3%
44.1%
31.0%
45.6%
9.7%
10.3%
Breakdown of population affiliated with a religious congregation
Type
Adherents
Congregations
Religion
Los Angeles
San Diego
Los Angeles
San Diego
CATHOLIC CHURCH
36.1%
25.9%
4.7%
6.7%
SOUTHERN BAPTIST CONVENTION
1.0%
1.1%
9.0%
12.0%
MUSLIM ESTIMATE
0.7%
0.7%
1.0%
1.1%
AMERICAN BAPTIST CHURCHES IN THE USA
0.5%
0.1%
3.1%
1.5%
SEVENTH DAY ADVENTIST CHURCH
0.5%
0.5%
2.4%
2.0%
EPISCOPAL CHURCH
0.4%
0.4%
1.4%
2.0%
EVANGELICAL LUTHERAN CHURCH IN AMERICA
0.2%
0.4%
1.9%
2.0%
LUTHERAN CHURCH
0.2%
0.4%
1.6%
2.2%
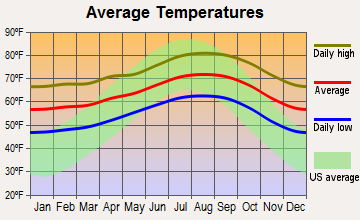
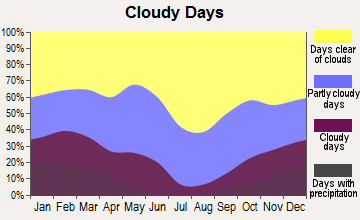
Weather
Both cities boast a Mediterranean climate, which guarantees plenty of sunshine throughout the year. However, Los Angeles encounters a hotter summer and slightly colder winters than San Diego. On the other hand, San Diego has beautiful, consistent weather, with less extreme heat in summer, making it ideal for beach-focused tourism or relaxed living.
Weather and climate
Type
Los Angeles
San Diego
Temperature - Average
63.9°F
64.4°F
Humidity - Average morning or afternoon humidity
60.9%
74%
Humidity - Differences between morning and afternoon humidity
16.1%
22%
Humidity - Maximum monthly morning or afternoon humidity
65.1%
80%
Humidity - Minimum monthly morning or afternoon humidity
49%
58%
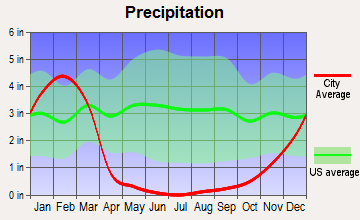
Precipitation - Yearly average
17.1 in
11 in
Snowfall - Yearly average
0 in
0 in
Clouds - Number of days clear of clouds
29.9%
24.3%
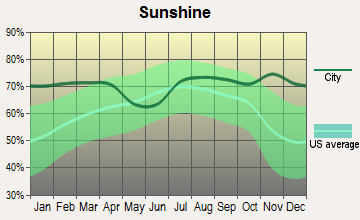
Sunshine amount - Average
78.4%
74.8%
Sunshine amount - Differences during a year
22%
19%
Sunshine amount - Maximum monthly
85%
75%
Sunshine amount - Minimum monthly
63%
56%
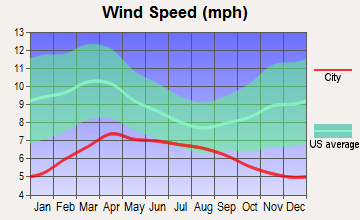
Wind speed - Average
2.1 mph
6.9 mph
Average climate in Los Angeles, California
Average climate in San Diego, California
Air pollution
Type
AQI
CO
NO2
OZONE
PB
PM10
PM25
SO2
Year
Los Angeles
San Diego
Los Angeles
San Diego
Los Angeles
San Diego
Los Angeles
San Diego
Los Angeles
San Diego
Los Angeles
San Diego
Los Angeles
San Diego
Los Angeles
San Diego
2018
137
101
0.38
0.53
9.9
11.2
26.9
32.6
0.008
0.007
24.4
N/A
16.0
10.5
0.4
0.1
2017
136
115
0.41
0.63
10.3
12.7
27.2
32.7
0.007
0.007
25.0
N/A
16.2
10.8
0.5
0.1
2016
128
105
0.37
0.46
10.0
13.0
27.7
30.4
0.007
0.006
23.8
N/A
15.4
11.4
0.4
0.1
2015
128
111
0.38
0.43
10.9
13.2
28.5
29.9
0.005
0.005
21.8
N/A
17.4
11.9
0.3
0.1
2014
139
105
0.50
0.44
12.0
11.6
27.8
31.1
0.007
0.007
26.4
N/A
19.9
11.1
0.3
0.1
2013
140
138
0.48
0.50
11.8
12.4
26.2
27.4
0.007
0.019
25.5
N/A
19.0
12.3
0.3
0.2
2012
144
110
0.48
0.53
10.9
12.7
26.3
28.0
0.008
0.019
24.8
N/A
19.9
13.6
0.4
0.2
2011
141
122
0.38
0.51
13.4
13.5
24.2
29.0
0.009
0.034
32.4
N/A
18.3
14.0
0.3
1.5
2010
127
109
0.44
0.52
12.2
14.0
23.2
29.3
0.027
0.019
33.9
N/A
17.3
13.9
0.5
1.0
2009
153
121
0.51
0.64
16.0
15.6
24.0
26.9
0.009
0.014
45.2
N/A
18.8
15.1
1.1
2.7
2008
145
127
0.37
0.71
14.0
16.1
24.8
28.4
0.010
N/A
44.7
67.3
19.5
N/A
1.0
2.6
2007
121
157
0.39
0.71
14.0
16.4
24.3
28.0
0.013
0.012
N/A
64.6
N/A
N/A
1.9
2.8
2006
131
123
0.38
0.81
15.4
18.9
23.1
27.1
0.006
0.056
N/A
64.8
N/A
N/A
1.9
3.4
2005
132
112
0.43
0.90
12.8
19.2
24.1
24.4
0.012
0.049
N/A
N/A
N/A
N/A
3.7
3.7
2004
142
120
0.64
0.93
17.6
18.4
27.5
25.9
0.016
0.055
N/A
N/A
N/A
N/A
2.5
4.6
2003
145
124
0.94
0.88
27.1
19.4
19.8
25.4
0.030
0.049
N/A
N/A
N/A
N/A
2.1
3.8
2002
154
125
1.04
0.86
31.3
20.9
21.7
25.9
0.027
0.039
N/A
N/A
N/A
N/A
2.4
3.6
2001
135
132
1.16
0.93
37.0
20.4
18.7
26.5
0.041
0.048
N/A
N/A
N/A
N/A
2.4
3.4
2000
147
134
1.13
1.02
31.1
22.3
16.7
23.8
0.035
0.054
N/A
N/A
N/A
N/A
1.4
3.6
Natural disasters
Type
Los Angeles
San Diego
Tornado activity compared to U.S. average
16.2%
6.7%
Earthquake activity compared to U.S. average
7,082.4%
5,835%
Natural disasters compared to U.S. average
57%
39%
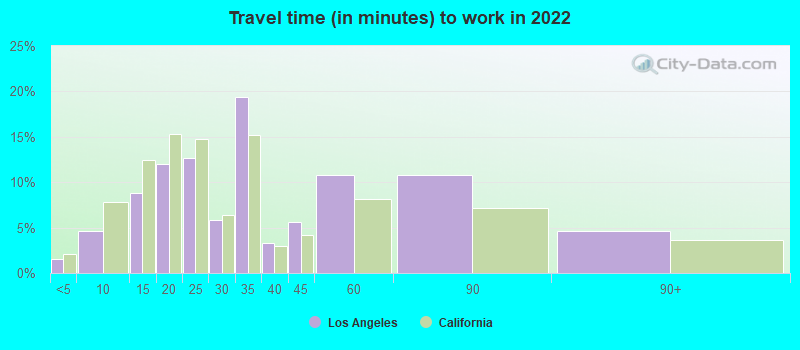
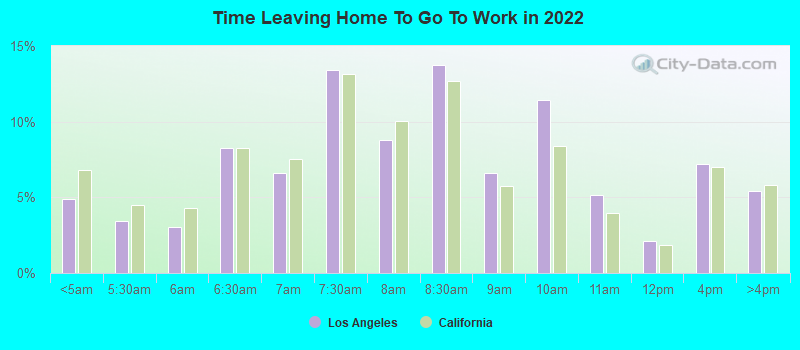
Transportation
Both cities offer public transportation, but Los Angeles has a more extensive network due to its larger area. Commute times are generally longer in Los Angeles, with San Diego offering better commuting conditions due to less congestion.
Transport
Type
Los Angeles
San Diego
Amtrak stations
1
1
Amtrak stations nearby
3
2
FAA registered aircraft
669
852
FAA registered aircraft manufacturers and dealers
14
33
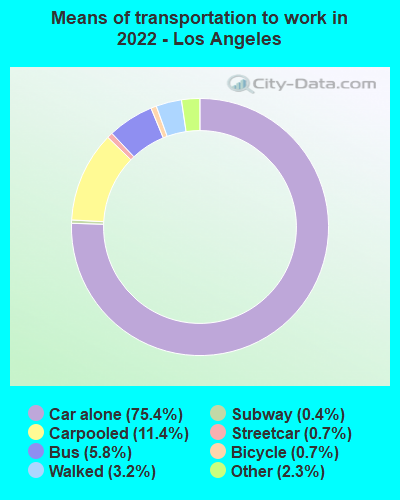
Means of transportation to work
Type
Los Angeles
San Diego
Bicycle
0.6%
0.6%
Bus
5.8%
2%
Carpooled
10.6%
9.4%
Car alone
76.5%
81.7%
Ferryboat
0.2%
0.1%
Motorcycle
0.2%
0.3%
Railroad
0.1%
0.5%
Streetcar
0.5%
0%
Subway
0.2%
0.1%
Taxicab
0.1%
0.1%
Walked
3%
3.6%
Average travel time to work
Type
Los Angeles
San Diego
Average
34.8 min
27.4 min
Other means
28.5 min
22.7 min
Public transportation
46.4 min
45.7 min
Private vehicle occupancy
Type
Los Angeles
San Diego
Average
1.2
1.2
Drove alone
87.4%
89.5%
In 2 person carpool
10.1%
7.6%
In 3 person carpool
1.6%
1.8%
In 4 person carpool
0.5%
0.4%
In 5-6 person carpool
0.3%
0.5%
In 7+ person carpool
0.1%
0.2%
How many people usually rode to work in the car, truck or van.
Real Estate
Real estate in Los Angeles is significantly more expensive than in San Diego, with a higher median home price. However, San Diego's home prices have been increasing steadily.
Neighborhoods
Los Angeles neighborhoods have wide disparities, from the glitz of Beverly Hills to the hipster vibe of Silverlake. San Diego neighborhoods offer more consistency, with beachfront communities showcasing a mix of luxury and laid-back vibes.
Houses and residents
Type
Los Angeles
San Diego
Houses
1,542,391
555,456
Average household size (people)
2.8
2.6
Median year apartment built
1970
1980
Median year house/condo built
1957
1977
Length of stay in the house since moving in
16 years
14.1 years
Houses occupied
1,410,594 (91.5%)
521,000 (93.8%)
Houses occupied by owners
521,485 (37%)
251,507 (48.3%)
Houses occupied by renters
889,109 (63%)
269,493 (51.7%)
Median rent asked for vacant for-rent units
$2,146
$2,096
Median monthly housing costs
$1,845
$2,044
Median price asked for vacant for-sale houses and condos
$1,410,311
$957,871
Estimated median house or condo value
$812,800
$768,800
Median numbers of rooms
4.1
4.6
Median number of rooms in apartments
3.4
3.7
Median number of rooms in houses and condos
5.8
5.9
Median house price - detached houses
Over $1,000,000
Over $1,000,000
Median house price - in 2-unit structures
$906,968
Over $1,000,000
Median house price - in 3-to-4-unit structures
$752,598
$529,375
Median house price - in 5 or more unit structures
$760,192
$543,091
Median house price - mobile homes
$204,691
$134,064
Median house price - occupied boats, rvs, vans etc.
$134,345
$219,865
Median house price - Townhouses or other attached units
$809,932
$696,014
Median house price - All housing units
Over $1,000,000
$941,291
Median house age
57
42
Renting percentage
61.8%
51.7%
Housing density (houses/condos per square mile)
3,288.2
1,712.6
House value disparities
23.2%
23.6%
Household income disparities
47.7%
42.3%
Median household income for houses/condes with a mortgage
$122,032
$138,584
Median household income for apartments without a mortgage
$83,712
$97,588
Housing units without a mortgage
5,970 (1.6%)
2,803 (1.6%)
Housing units with both a second mortgage and home equity loan
28,556 (7.6%)
12,495 (6.9%)
Housing units with a mortgage
369,242 (98.4%)
177,643 (98.4%)
Housing units with a home equity loan
2,061 (0.5%)
694 (0.4%)
Housing units with a second mortgage
37,750 (10.1%)
16,654 (9.2%)
House/condo owner moved in on average (years ago)
15
11
House/condo renter moved in on average (years ago)
4
1
Housing units lacking complete kitchen facilities
3.1%
0.8%
Housing units lacking complete plumbing facilities
0.9%
0.3%
Housing units in structures
Housing units in structures
Los Angeles
San Diego
One, detached
37.2%
43.4%
One, attached
5.7%
9.9%
Two
2.8%
1.9%
3 or 4
6.3%
6.0%
5 to 9
8.9%
9.3%
10 to 19
9.5%
7.4%
20 to 49
13.1%
6.3%
50 or more
15.9%
14.6%
Mobile homes
0.6%
1.0%
Median real estate property taxes paid for housing units
Self-employed workers in own not incorporated business
200,073
39,709
State government workers
54,504
29,438
Unpaid family workers
4,643
808
Industries and Occupations
Los Angeles is world-renowned for its entertainment industry, notably Hollywood. In contrast, San Diego's economy is largely driven by military/defense, tourism, trade, and manufacturing sectors.
Both cities have renowned hospitals, but Los Angeles, being larger, has more healthcare facilities. San Diego, with its emphasis on the biotech industry, is a critical hub for medical research.
Health (county statistics)
Type
Los Angeles
San Diego
General health status score of residents in this county from 1 (poor) to 5 (excellent)
Los Angeles has more skyscrapers and a busier city layout. Its infrastructure is often jammed due to high population density. San Diego has a well-planned infrastructure with less congestion, with an emphasis on parks and recreational areas.
Infrastructure
Type
Los Angeles
San Diego
Hospitals
62
26
TV stations
21
13
Arenas or stadiums
5
4
Bank branches located here
385
255
Bank institutions located here
73
40
Main business address for public companies
69
92
Drinking water stations with no reported violations in the past
5
5
Drinking water stations with reported violations in the past
HMDA - Conventional home purchase loans - Applications denied
Year
Los Angeles
San Diego
1999
10,170
3,865
2000
9,527
2,257
2001
7,928
1,754
2002
9,092
2,118
2003
14,114
5,074
2004
18,901
7,646
2005
22,524
8,409
2006
26,600
7,551
2007
19,394
5,741
2008
7,924
2,876
2009
4,210
1,675
Culture and Food
Both cities have rich culinary scenes. Los Angeles is famous for its fusion cuisine and trendy food scene, while San Diego is known for fresh seafood and Mexican-inspired cuisine. They both offer vibrant arts and culture scenes, though Los Angeles has a larger concentration of cultural institutions and events.
Sports Teams
Los Angeles houses famous teams like the Dodgers (MLB), Lakers (NBA), and Rams (NFL). San Diego has the Padres (MLB) and used to have the Chargers (NFL) before they moved to Los Angeles.


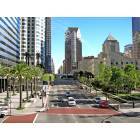


 Los Angeles, CA
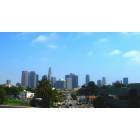
 San Diego, CA