Relocating or planning a visit between Manhattan, NY and Atlanta, GA presents distinct considerations based on numerous variables. From crime rates, weather, education, lifestyle, and economy to tax structures and healthcare facilities, both cities offer a unique set of opportunities and challenges. Here we comprehensively outline these aspects, providing a granular perspective to foreguide your decision making process while firmly considering the needs and preferences for individuals wishing to settle or simply looking for a memorable visit.
Manhattan has a higher crime rate compared to national averages, yet it’s considerably lower than many other urban areas in the U.S. The area prioritizes police presence, making it considerably safe. Atlanta has struggled with crime rates in the past but recent initiatives have resulted in a downward trend. Still, it is advised for residents and tourists to stay aware of their surroundings. Both cities observe a mix of safer and riskier neighborhoods, common in large urban regions.
Cost of Living
Living in Manhattan is notably more expensive than Atlanta, especially when it comes to housing. While groceries, utilities, and transportation are also higher, residents often find the trade-off for access to amenities and higher wages acceptable. Conversely, Atlanta is more affordable, offering lower housing costs and overall living expenses, perfect for budget-conscious individuals.
Income Tax
New York City residents pay a city income tax that ranges from 3.078% to 3.876%. New York State levies a separate income tax ranging from 4% to 8.82%. Georgia State has income tax rates ranging from 1% to 5.75%, but Atlanta does not impose a city income tax.
Property Tax
Property tax rates in Manhattan are relatively low compared to the national average, with an effective rate of 0.88%. In Atlanta, the property tax rate is slightly higher, at an effective rate of 0.98%.
Sales Tax
New York City has a 4.5% city sales tax, and New York State charges an additional 4%, meaning a total sales tax of 8.5%. Atlanta's city sales tax is 4%, and Georgia State also levies a 4% sales tax, a total of 8% sales tax.
Income
Type
Manhattan
Atlanta
Estimated median household income
$84,435
$74,107
Estimated per capita income
$76,589
$55,051
Cost of living index (U.S. average is 100)
185.3
104.3
If you make $50,000 in Atlanta, you will have to make $88,830 in Manhattan to maintain the same standard of living.
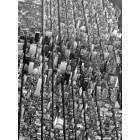
Geographical Conditions
Manhattan is an island defined by its iconic skyscrapers and surrounded by the Hudson, East, and Harlem rivers. Atlanta, known as the city in a forest, features rolling hills and is heavily covered with trees.
Geographical information
Type
Manhattan
Atlanta
Land area
23 sq. miles
131.7 sq. miles
Population density
70,629 people per sq. mile
3,768.3 people per sq. mile
Relative area comparison
Manhattan, NY Atlanta, GA
Education
Both Manhattan and Atlanta boast highly regarded educational institutions. Manhattan is home to world-class universities like Columbia and NYU. Atlanta houses Emory University and Georgia Tech, plus excellent public and charter schools. Education choices are plentiful in both cities, ideal for families and individuals planning their academic careers.
Manhattan, as a financial, advertising, and media hub, offers vast opportunities, although the job market is highly competitive. Atlanta's economy, praised for its diversity, features strong sectors like logistics, professional and business services, and media operations. Both cities have robust economies and ample job opportunities, yet the competition level and industry concentration vary.
Biggest Employers
Manhattan hosts multinational giants like JPMorgan Chase, Citigroup, and Verizon. Atlanta, on the other hand, is home to Coca-Cola, Home Depot, and Delta Airlines. Careers with these employers can facilitate prosperous opportunities, largely shaping the cities' demographic composition.
In Manhattan (New York County), 83.9% voted for Democrats and 14.9% for Republicans in 2012 Presidential Election. In Atlanta (Fulton County), 64.3% voted for Democrats and 34.5% for Republicans.
Elections
Type
Democrats
Republicans
Other
Year
Manhattan
Atlanta
Manhattan
Atlanta
Manhattan
Atlanta
2020
86.5%
72.6%
12.2%
26.2%
1.2%
1.2%
2016
86.7%
67.8%
9.7%
26.9%
3.6%
5.3%
2012
83.9%
64.3%
14.9%
34.5%
1.2%
1.2%
2008
86.1%
67.2%
13.5%
32.2%
0.3%
0.6%
2004
82.3%
59.4%
16.8%
40.0%
0.9%
0.7%
2000
80.0%
57.9%
14.5%
39.9%
5.5%
2.2%
1996
80.0%
58.9%
13.8%
36.9%
6.3%
4.1%
Breakdown of population affiliated with a religious congregation
Type
Adherents
Congregations
Religion
Manhattan
Atlanta
Manhattan
Atlanta
CATHOLIC CHURCH
20.4%
9.9%
12.6%
2.4%
MUSLIM ESTIMATE
2.7%
1.4%
2.4%
1.7%
EPISCOPAL CHURCH
1.7%
2.1%
5.3%
2.1%
AMERICAN BAPTIST CHURCHES IN THE USA
1.6%
0.8%
4.7%
1.1%
REFORMED CHURCH IN AMERICA
0.6%
0.0%
1.2%
0.1%
PATRIAR PARISHE RUSSIAN ORTHODO CHURCH USA
0.4%
0.0%
0.2%
0.0%
EVANGELICAL LUTHERAN CHURCH IN AMERICA
0.3%
0.6%
2.0%
1.5%
SEVENTH DAY ADVENTIST CHURCH
0.3%
1.2%
2.4%
1.5%
SOUTHERN BAPTIST CONVENTION
0.2%
7.9%
2.9%
14.7%
Weather
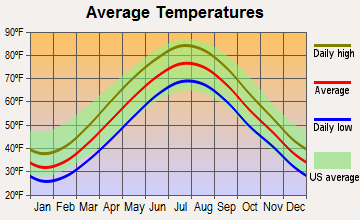
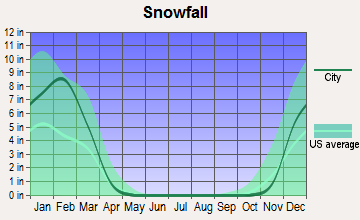
Manhattan experiences a humid subtropical climate, creating cold winters and hot, humid summers. Snowfall is common during winter. Atlanta, GA, on the contrary, has a subtropical monsoon influence, resulting in milder winters but summers can be hot and humid as well. Both cities enjoy a vibrant autumn but spring in Atlanta takes the cake with a stunning array of blooming flowers and foliage.
Weather and climate
Type
Manhattan
Atlanta
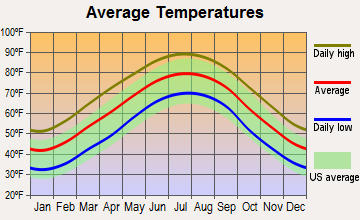
Temperature - Average
54.6°F
61.7°F
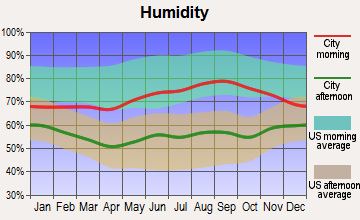
Humidity - Average morning or afternoon humidity
67.4%
73.9%
Humidity - Differences between morning and afternoon humidity
30%
38%
Humidity - Maximum monthly morning or afternoon humidity
77%
87%
Humidity - Minimum monthly morning or afternoon humidity
47%
49%
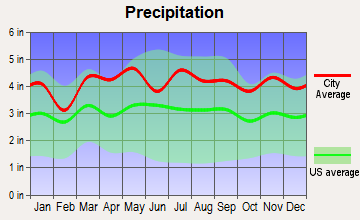
Precipitation - Yearly average
49.6 in
51.4 in
Snowfall - Yearly average
57.4 in
4 in
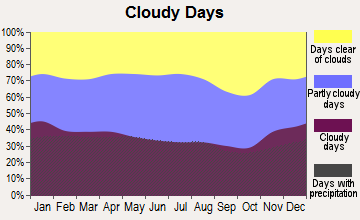
Clouds - Number of days clear of clouds
17.8%
18.3%
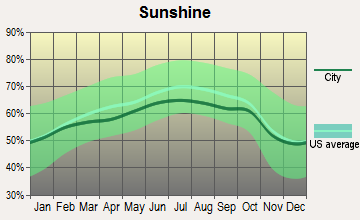
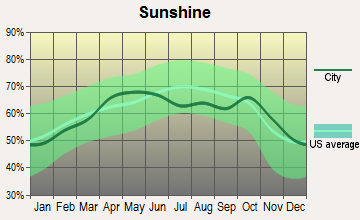
Sunshine amount - Average
60.2%
65.6%
Sunshine amount - Differences during a year
20%
17%
Sunshine amount - Maximum monthly
64%
67%
Sunshine amount - Minimum monthly
44%
50%
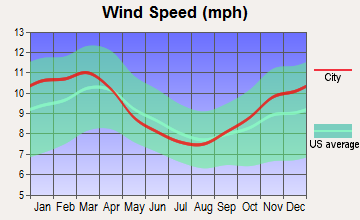
Wind speed - Average
6.7 mph
9 mph
Average climate in Manhattan, New York
Average climate in Atlanta, Georgia
Air pollution
Type
AQI
CO
NO2
OZONE
PB
PM10
PM25
SO2
Year
Manhattan
Atlanta
Manhattan
Atlanta
Manhattan
Atlanta
Manhattan
Atlanta
Manhattan
Atlanta
Manhattan
Atlanta
Manhattan
Atlanta
Manhattan
Atlanta
2018
94
84
0.29
0.27
17.3
N/A
23.9
24.7
N/A
N/A
N/A
17.5
7.9
10.6
0.5
0.8
2017
97
87
0.16
0.31
17.4
N/A
24.0
24.7
N/A
N/A
N/A
17.5
7.7
11.3
0.4
1.2
2016
94
105
0.28
0.31
18.1
N/A
24.2
25.9
N/A
N/A
N/A
17.2
7.7
11.1
0.6
1.0
2015
100
91
0.36
0.31
18.9
N/A
23.0
23.9
N/A
N/A
N/A
17.6
8.6
10.2
1.0
0.9
2014
95
88
0.40
0.31
19.1
N/A
22.3
24.0
N/A
N/A
N/A
18.4
8.3
9.1
1.1
1.1
2013
97
88
0.43
0.30
19.5
N/A
22.6
23.7
N/A
N/A
N/A
18.0
9.0
8.7
1.1
1.0
2012
99
109
0.46
0.33
18.6
N/A
23.4
26.2
N/A
N/A
N/A
19.5
9.3
9.8
1.7
1.1
2011
108
98
0.46
0.33
20.7
N/A
22.2
27.5
N/A
N/A
N/A
21.2
10.9
12.0
2.7
1.7
2010
113
102
0.45
0.35
19.3
N/A
23.3
25.8
N/A
N/A
N/A
18.5
10.4
12.5
2.7
1.9
2009
104
96
0.51
N/A
21.9
N/A
18.8
25.2
N/A
N/A
N/A
18.5
10.7
13.8
3.8
1.7
2008
110
99
0.49
0.53
23.0
15.3
19.8
31.2
0.013
0.003
N/A
22.5
12.3
16.3
4.6
2.5
2007
121
124
0.56
0.45
24.4
17.0
19.4
33.1
0.016
0.003
N/A
29.4
13.1
18.1
5.5
2.7
2006
116
129
0.64
0.58
24.6
17.9
18.9
31.3
0.018
0.003
N/A
22.9
12.9
19.7
6.5
3.4
2005
112
123
0.77
0.55
26.7
17.2
18.4
29.0
N/A
0.005
N/A
25.5
N/A
15.8
8.2
3.2
2004
108
118
0.77
0.54
26.7
16.9
17.3
28.8
0.030
0.004
N/A
22.9
N/A
14.6
8.0
2.8
2003
107
112
0.83
0.56
27.8
16.4
17.5
26.7
0.024
0.004
26.9
22.2
N/A
15.4
8.2
3.0
2002
122
120
0.78
0.60
27.9
19.4
18.7
27.9
0.008
N/A
25.9
23.2
N/A
13.1
7.3
3.0
2001
123
117
0.79
0.69
29.4
23.3
19.4
27.2
0.020
N/A
25.0
27.0
N/A
N/A
8.7
3.1
2000
115
132
0.90
0.50
30.2
22.9
15.0
31.2
0.022
N/A
22.2
28.4
N/A
N/A
8.4
3.2
Natural disasters
Type
Manhattan
Atlanta
Tornado activity compared to U.S. average
59.1%
159.5%
Earthquake activity compared to U.S. average
31.1%
153.4%
Natural disasters compared to U.S. average
18%
15%
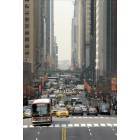
Transportation
Manhattan offers extensive public transportation, primarily through its subway system and buses. Commuting can be done easily without a car. Atlanta's public transportation includes the MARTA system, but many residents prefer cars. Traffic can be a significant issue in both cities, particularly during rush hour.
Transport
Type
Manhattan
Atlanta
Amtrak stations
0
1
Amtrak stations nearby
3
1
FAA registered aircraft
2
1
FAA registered aircraft manufacturers and dealers
0
28
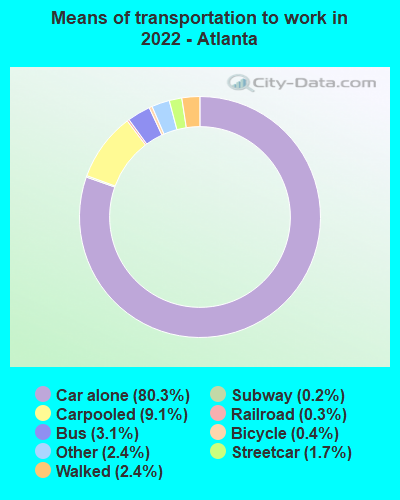
Means of transportation to work
Type
Manhattan
Atlanta
Bicycle
0.9%
0.5%
Bus
10.1%
2.1%
Carpooled
3.4%
7.6%
Car alone
7.6%
84%
Motorcycle
0.1%
0.1%
Railroad
1.1%
0.2%
Streetcar
0.1%
1.1%
Subway
43.6%
0.4%
Taxicab
4.7%
0.3%
Walked
21.9%
1.9%
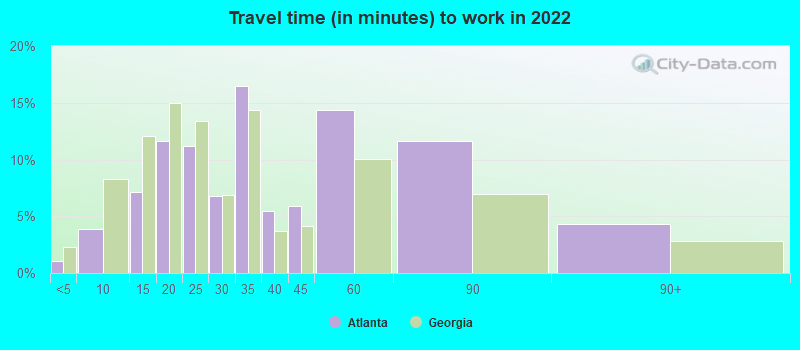
Average travel time to work
Type
Manhattan
Atlanta
Average
30.3 min
34.9 min
Real Estate
Real estate in Manhattan is notoriously high-priced. However, investment here can appreciate significantly. Atlanta's real estate is more affordable, attractive to first-time homeowners, yet the city is experiencing rising property prices due to recent growth.
Neighborhoods
From upscale Upper East Side to eclectic Greenwich Village, Manhattan's neighborhoods are rich in history and diverse in character. Atlanta's neighbourhoods, like the historic Grant Park or trendy Midtown, offer equally diverse choices reflecting southern charm and vibrant city life.
Houses and residents
Type
Manhattan
Atlanta
Houses
798,144
253,355
Average household size (people)
2
2.1
Houses occupied
738,644 (92.5%)
232,720 (91.9%)
Houses occupied by owners
148,695 (20.1%)
113,092 (48.6%)
Houses occupied by renters
589,949 (79.9%)
119,628 (51.4%)
Median rent asked for vacant for-rent units
$1,690
$1,226
Median price asked for vacant for-sale houses and condos
$3,393,315
$325,147
Estimated median house or condo value
$940,900
$375,500
Median number of rooms in apartments
3.2
3.5
Median number of rooms in houses and condos
4
6.2
Renting percentage
77.2%
55.1%
Housing density (houses/condos per square mile)
34,757
1,923
Household income disparities
47.8%
47.8%
Housing units without a mortgage
1,104 (40.3%)
1,022 (1.3%)
Housing units with both a second mortgage and home equity loan
13 (0.5%)
5,566 (7%)
Housing units with a mortgage
1,636 (59.7%)
78,250 (98.7%)
Housing units with a home equity loan
140 (5.1%)
58 (0.1%)
Housing units with a second mortgage
140 (5.1%)
7,203 (9.1%)
Housing units lacking complete kitchen facilities
2%
2%
Housing units lacking complete plumbing facilities
Self-employed workers in own not incorporated business
69,517
15,892
State government workers
15,544
13,288
Unpaid family workers
1,861
550
Industries and Occupations
Manhattan thrives on finance, media, technology, and healthcare industries, so occupations align accordingly. Atlanta is a logistics hub, hosts several Fortune 500 companies, and is known for its growing film industry, influencing occupational trends. Both cities offer diverse industries, appealing to an array of professionals.
Both cities boast excellent healthcare facilities. Manhattan is home to internationally renowned hospitals like NY Presbyterian, Mount Sinai, and Memorial Sloan Kettering Cancer Center. Atlanta matches up with healthcare facilities like Emory Healthcare and Grady Memorial Hospital.
Health (county statistics)
Type
Manhattan
Atlanta
General health status score of residents in this county from 1 (poor) to 5 (excellent)
Manhattan's infrastructure, including its elaborate subway system and numerous bridges and tunnels, is impressive yet aged, with regular maintenance required. Atlanta's infrastructure, while less vast, is comparatively newer and includes a growing metro system and expansive highway network. Traffic can be busy in both cities - typical of major metro areas.
Infrastructure
Type
Manhattan
Atlanta
TV stations
30
22
Culture and Food
Manhattan is a cultural melting pot, offering robust arts scenes, diverse food options, and a massive assortment of entertainment venues. Atlanta also boasts a rich culture embodied by southern hospitality, an amazing food scene-inspired by southern and international cuisines and a vibrant arts scene.
Sports Teams
Both cities have diverse sports scenes. Manhattan offers teams in all major leagues, including the Giants (NFL), Yankees (MLB), and Knicks (NBA). Atlanta is home to Falcons (NFL), Braves (MLB), and Hawks (NBA). Both cities offer abundant opportunities for sports fans.


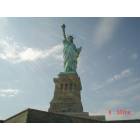


 Manhattan, NY
 Atlanta, GA