Mesa and Chandler, both situated in the Arizona desert, offer residents and visitors alike a unique Southwestern experience. These two vibrant cities differ in terms of safety, cost of living, job opportunities, and more. Below, we delve into an in-depth comparison of these two communities, providing the essential data needed to make an informed decision whether you're looking to relocate or merely pay a visit.
Distance between
Mesa, AZ and
Chandler, AZ : 10.3 miles
Mesa's population is larger by 82%. Its population has grown by 113,100 people (28.5%) since 2000. The population of Chandler has grown by 102,877 people (58.3%) during that time.
When it comes to crime and safety, both cities are relatively comparable. However, according to data from the FBI, the crime rate in Mesa is slightly higher than in Chandler. While both cities are considered safer than the national average, it's important to keep in mind that crime can vary greatly from neighborhood to neighborhood.
City-data.com crime index counts serious crimes and violent crime more heavily. It adjusts for the number of visitors and daily workers commuting into cities. (higher means more crime, U.S. average = 301.1)
City-data.com crime index counts serious crimes and violent crime more heavily. It adjusts for the number of visitors and daily workers commuting into cities. (higher means more crime, U.S. average = 301.1)
Sex Offenders
According to our data, there are 635 registered sex offenders living in Mesa and 99 registered sex offenders living in . The ratio of residents to sex offenders in Mesa is 763 to 1; the ratio in Chandler is 2,500 to 1. The number of registered sex offenders compared to the number of residents is much larger in Mesa than that in Chandler.
Cost of Living
Cost of living is lower in Mesa compared to Chandler. This includes housing, utilities, groceries, healthcare, and transportation costs. Lower cost of living in Mesa can be a deciding factor for people planning to move or for long-stay tourists.
Income Tax
Arizona has a state income tax, but no cities, including Chandler and Mesa, impose local income tax. Therefore, there is no difference in city or state income tax for these two cities.
Property Tax
The property tax rates for Mesa and Chandler are similar. However, due to the higher median home price in Chandler, those homeowners usually pay more in property taxes than those in Mesa.
Sales Tax
As part of Arizona, both cities have a relatively high sales tax rate, with Chandler having slightly higher rates than Mesa. However, the difference is minimal, and unlikely to significantly impact day-to-day expenses or decision-making.
Income
Type
Mesa
Chandler
Estimated median household income
$69,266
$94,613
Estimated per capita income
$35,439
$46,965
Cost of living index (U.S. average is 100)
101
101.2
If you make $50,000 in Mesa, you will have to make $50,099 in Chandler to maintain the same standard of living.
Geographical Conditions
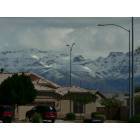
Both cities are located in the Sonoran Desert and share similar geographical features. However, Mesa offers closer proximity to the Superstition Mountains offering breathtaking views and outdoor pursuits options.
Chandler offers higher-ranked schools compared to Mesa, with Chandler Unified School District consistently receiving excellent ratings. Mesa has a larger number of schools, including charter and magnet schools, but their ratings are generally lower than those in Chandler. Both cities are home to multiple community colleges and universities providing tertiary level opportunities to residents.
The economies of both cities are robust and diverse. Key industries in Chandler include technology, health care, and finance while Mesa's local economy is driven by healthcare, education, and aviation. Availability of jobs tends to be higher in Mesa due to its larger population and geographical size.
Biggest Employers
The largest employers in Chandler are Intel and Wells Fargo, whereas the Banner Health System and Mesa Public Schools are the biggest employers in Mesa. Employment opportunities available in these cities are diverse and offer competitive wages in their respective areas.
There were 2,046 building permits issued in Mesa in 2012 (1543 more than in 2011) compared to 670 building permits issued in Chandler in 2012 (5 more than in 2011).
Weather
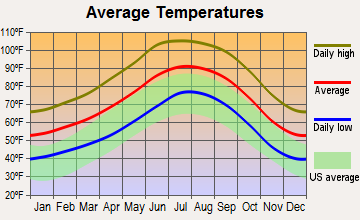
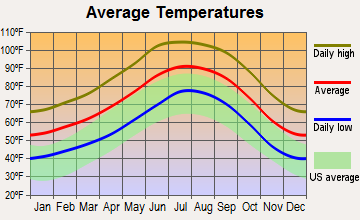
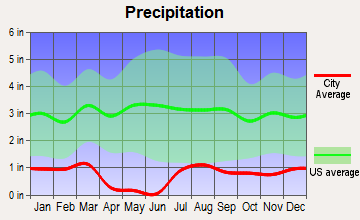
As you would expect in Arizona, both Mesa and Chandler enjoy plenty of sunshine throughout the year. Summers can be extremely hot, with temperatures often surpassing 100 degrees Fahrenheit. Fall, Winter, and Spring seasons are relatively mild and comfortable. While Chandler tends to be slightly cooler due to its proximity to the Gila River, the temperature difference is minimal and unlikely to significantly impact living conditions or tourism.
Weather and climate
Type
Mesa
Chandler
Temperature - Average
71.7°F
71.8°F
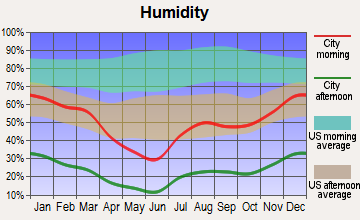
Humidity - Average morning or afternoon humidity
37.5%
37.5%
Humidity - Differences between morning and afternoon humidity
48%
48%
Humidity - Maximum monthly morning or afternoon humidity
60%
60%
Humidity - Minimum monthly morning or afternoon humidity
12%
12%
Precipitation - Yearly average
9.5 in
9.1 in
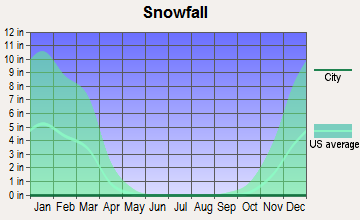
Snowfall - Yearly average
0 in
0 in
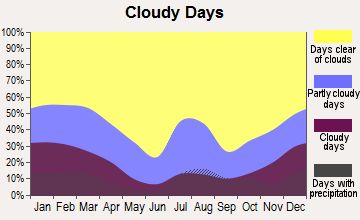
Clouds - Number of days clear of clouds
35.2%
35.3%
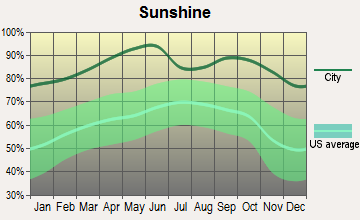
Sunshine amount - Average
92.8%
92.8%
Sunshine amount - Differences during a year
16%
16%
Sunshine amount - Maximum monthly
95%
95%
Sunshine amount - Minimum monthly
79%
79%
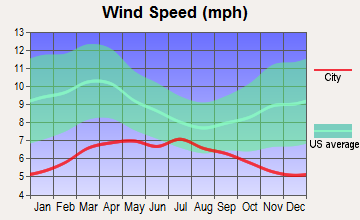
Wind speed - Average
6.6 mph
6.6 mph
Average climate in Mesa, Arizona
Average climate in Chandler, Arizona
Air pollution
Type
AQI
CO
NO2
OZONE
PM10
PM25
SO2
Year
Mesa
Chandler
Mesa
Chandler
Mesa
Chandler
Mesa
Chandler
Mesa
Chandler
Mesa
Chandler
Mesa
Chandler
2018
200
206
0.28
0.29
15.1
15.2
34.8
30.6
28.1
35.5
7.5
7.7
0.6
0.6
2017
128
132
0.28
0.36
15.8
15.9
35.1
31.2
24.5
34.0
8.2
7.8
1.4
1.4
2016
121
125
0.31
0.34
15.7
15.8
34.6
30.2
21.5
30.2
6.8
7.1
0.4
0.4
2015
104
173
0.34
0.39
17.6
17.8
33.4
29.2
17.7
24.2
6.8
7.3
0.9
0.9
2014
135
231
0.33
0.44
19.6
19.9
34.0
27.8
30.8
29.8
8.4
8.6
1.1
1.1
2013
141
148
0.31
0.32
19.9
20.1
34.8
29.8
29.3
28.9
5.8
7.5
0.9
0.9
2012
159
165
0.38
0.36
21.2
21.5
33.7
29.3
37.9
36.8
8.1
8.8
1.3
1.3
2011
205
205
0.31
0.32
18.5
19.1
34.1
30.1
40.4
40.4
9.5
9.5
0.9
0.9
2010
100
100
0.31
0.42
16.4
17.4
32.9
29.8
29.5
23.8
8.3
8.3
1.2
1.2
2009
109
109
0.33
0.40
16.6
17.6
32.3
29.8
37.8
36.1
N/A
N/A
1.0
1.1
2008
106
107
0.29
0.36
17.5
18.6
34.2
29.6
39.9
40.2
N/A
N/A
1.1
1.3
2007
134
135
0.43
0.38
19.3
20.6
31.0
28.5
50.6
50.2
N/A
N/A
1.9
1.9
2006
138
138
0.44
0.46
22.1
23.1
30.9
29.5
57.5
56.3
N/A
N/A
1.8
1.9
2005
109
109
0.49
0.56
22.6
23.6
30.0
26.6
49.1
48.7
N/A
N/A
1.7
1.8
2004
97
97
0.51
0.56
22.4
23.3
30.4
25.9
33.4
33.7
N/A
N/A
1.4
1.4
2003
99
100
0.56
0.58
24.0
24.6
31.7
27.3
42.6
42.6
N/A
N/A
1.4
1.4
2002
110
111
0.69
0.66
24.9
25.5
28.0
27.1
41.8
41.8
N/A
N/A
1.6
1.6
2001
105
105
0.65
0.68
23.8
24.3
27.2
26.3
37.8
37.8
N/A
N/A
1.5
1.5
2000
117
117
0.76
0.69
29.8
29.6
27.1
26.8
45.6
45.6
N/A
N/A
1.7
1.7
Natural disasters
Type
Mesa
Chandler
Tornado activity compared to U.S. average
18.1%
18.5%
Earthquake activity compared to U.S. average
2,348.6%
2,391%
Natural disasters compared to U.S. average
16%
16%
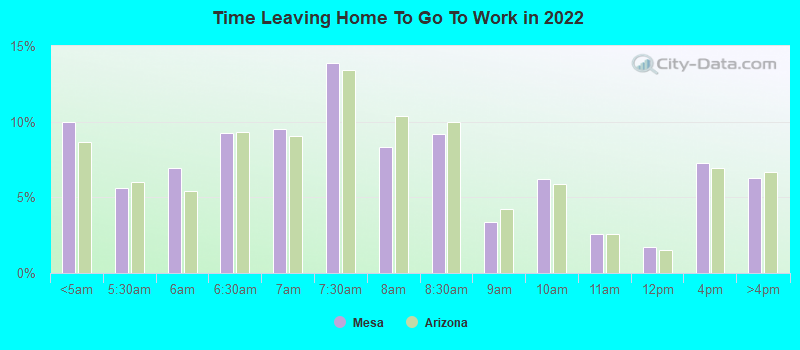
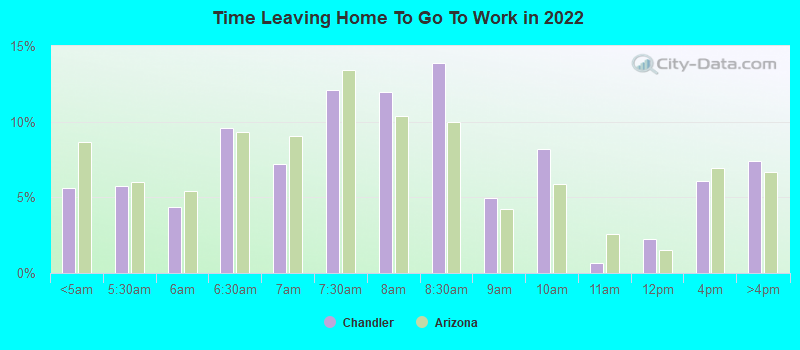
Transportation
Both cities are part of the Metropolitan Phoenix public transportation system. However, Mesa has a light rail line that connects it to Phoenix downtown. Commute times tend to be similar in both cities, and both have easy access to major freeways.
Transport
Type
Mesa
Chandler
Amtrak stations nearby
2
2
FAA registered aircraft
828
438
FAA registered aircraft manufacturers and dealers
20
5
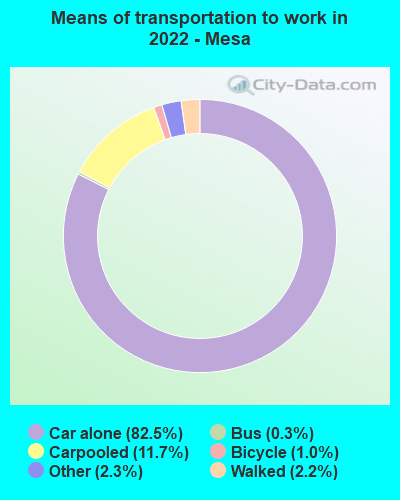
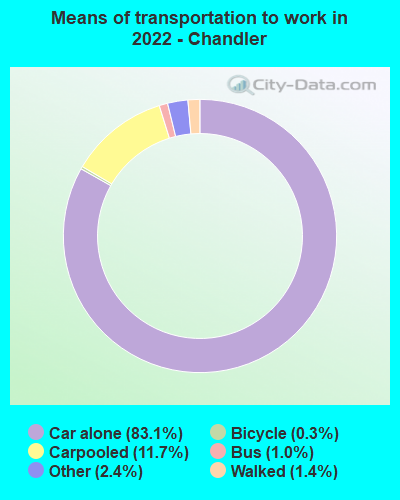
Means of transportation to work
Type
Mesa
Chandler
Bicycle
0.6%
0.4%
Bus
0.3%
0.3%
Carpooled
14.4%
10.6%
Car alone
79.9%
84.8%
Motorcycle
0.5%
0.5%
Walked
2.5%
2.2%
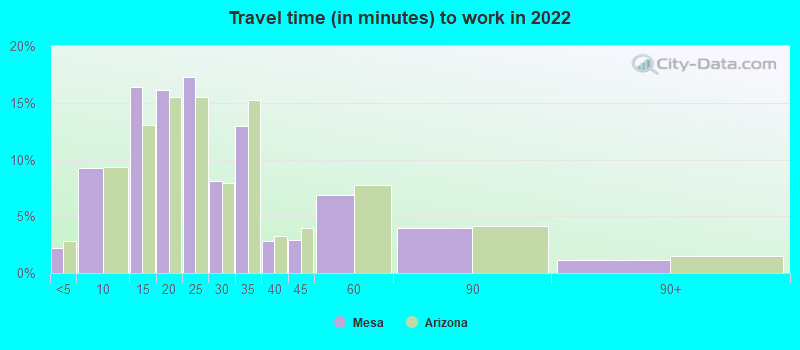
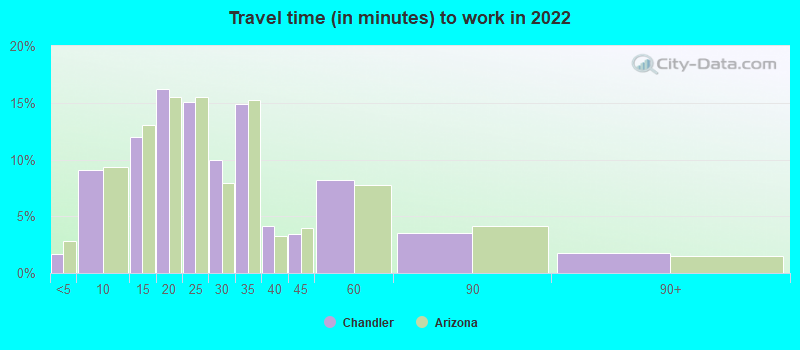
Average travel time to work
Type
Mesa
Chandler
Average
25 min
25.7 min
Other means
26.9 min
26.3 min
Public transportation
45.9 min
50.1 min
Private vehicle occupancy
Type
Mesa
Chandler
Average
1.2
1.2
Drove alone
85.8%
89.3%
In 2 person carpool
11.1%
8%
In 3 person carpool
2.1%
1%
In 4 person carpool
0.5%
0.7%
In 5-6 person carpool
0.5%
0.9%
In 7+ person carpool
0.1%
0.1%
How many people usually rode to work in the car, truck or van.
Real Estate
Real estate prices are, on average, higher in Chandler than Mesa. The median home price in Chandler is higher than Mesa's. However, Mesa offers a wider range of housing options, from apartments to ranch-style homes, appealing to various tastes and budgets.
Neighborhoods
Chandler is known for its upscale, master-planned communities, while Mesa offers a mix of old and new neighborhoods, each with its unique charm. Both cities offer gated communities, areas with high walkability, and varying degrees of urban and suburban feels.
Houses and residents
Type
Mesa
Chandler
Houses
221,995
112,136
Average household size (people)
2.6
2.7
Median year apartment built
1987
1997
Median year house/condo built
1989
1997
Length of stay in the house since moving in
11.2 years
10.6 years
Houses occupied
199,112 (89.7%)
107,668 (96%)
Houses occupied by owners
126,146 (63.4%)
71,036 (66%)
Houses occupied by renters
72,966 (36.6%)
36,632 (34%)
Median rent asked for vacant for-rent units
$1,890
$2,338
Median monthly housing costs
$1,220
$1,573
Median price asked for vacant for-sale houses and condos
$262,297
$461,127
Estimated median house or condo value
$350,100
$435,100
Median numbers of rooms
5.2
5.5
Median number of rooms in apartments
4
4.2
Median number of rooms in houses and condos
5.9
6.3
Median house price - detached houses
$421,563
$493,497
Median house price - in 2-unit structures
$124,748
$583,625
Median house price - in 3-to-4-unit structures
$226,327
$260,715
Median house price - in 5 or more unit structures
$250,077
$287,805
Median house price - mobile homes
$70,636
$81,606
Median house price - occupied boats, rvs, vans etc.
$94,693
$36,427
Median house price - Townhouses or other attached units
$256,984
$316,438
Median house price - All housing units
$364,728
$471,395
Median house age
33
24
Renting percentage
36.8%
33.7%
Housing density (houses/condos per square mile)
1,776.1
1,937.2
House value disparities
31.1%
22.8%
Household income disparities
42.1%
38.9%
Median household income for houses/condes with a mortgage
$97,987
$122,158
Median household income for apartments without a mortgage
$63,218
$78,975
Housing units without a mortgage
1,338 (1.6%)
907 (1.6%)
Housing units with both a second mortgage and home equity loan
5,628 (6.9%)
3,763 (6.8%)
Housing units with a mortgage
80,572 (98.4%)
54,712 (98.4%)
Housing units with a home equity loan
48 (0.1%)
0 (0%)
Housing units with a second mortgage
7,236 (8.8%)
4,390 (7.9%)
House/condo owner moved in on average (years ago)
8
8
House/condo renter moved in on average (years ago)
1
1
Housing units lacking complete kitchen facilities
0.9%
1.1%
Housing units lacking complete plumbing facilities
0.4%
0.4%
Housing units in structures
Housing units in structures
Mesa
Chandler
One, detached
55.9%
68.7%
One, attached
6.6%
5.5%
Two
1.0%
1.2%
3 or 4
5.1%
4.5%
5 to 9
6.0%
4.7%
10 to 19
5.0%
4.8%
20 to 49
2.8%
1.8%
50 or more
5.3%
7.5%
Mobile homes
11.8%
1.3%
Boats, RVs, vans, etc.
0.6%
0.0%
Median real estate property taxes paid for housing units
Self-employed workers in own not incorporated business
10,562
8,781
State government workers
6,039
4,501
Unpaid family workers
830
180
Industries and Occupations
Chandler's industries are heavily influenced by the presence of Intel, its largest employer. Other industries include finance and healthcare. In contrast, Mesa, with its larger and more diverse economy, offers opportunities in education, retail, healthcare, and the city's government.
Health diagnosing and treating practitioners and other technical occupations
6.7%
6.2%
Food preparation and serving related occupations
6.0%
3.6%
Healthcare support occupations
5.7%
3.7%
Health technologists and technicians
3.7%
1.8%
Personal care and service occupations
3.6%
5.8%
Production occupations
3.0%
2.8%
Building and grounds cleaning and maintenance occupations
2.6%
1.8%
Material moving occupations
2.3%
1.1%
Transportation occupations
1.9%
1.1%
Community and social service occupations
1.8%
1.9%
Computer and mathematical occupations
1.6%
4.3%
Arts, design, entertainment, sports, and media occupations
1.3%
1.8%
Architecture and engineering occupations
0.9%
2.3%
Legal occupations
0.7%
1.5%
Health Care
Mesa and Chandler both offer high-quality healthcare options. Dignity Health and Banner Health operate hospitals in both cities providing comprehensive healthcare services. Mesa's larger size means a greater number of hospitals and clinics to choose from.
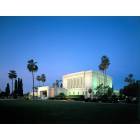
Chandler tends to have newer infrastructure, including state-of-the-art recreational facilities and parks. On the other hand, Mesa, being older and larger, has a diverse range of accommodations and facilities that cater for a wider range of taste and lifestyle.
Infrastructure
Type
Mesa
Chandler
Hospitals
13
2
TV stations
18
20
Bank branches located here
97
59
Bank institutions located here
22
20
Main business address for public companies
2
1
Drinking water stations with no reported violations in the past
1
1
Drinking water stations with reported violations in the past
HMDA - Conventional home purchase loans - Applications denied
Year
Mesa
Chandler
1999
2,532
879
2000
2,428
790
2001
1,854
513
2002
1,520
487
2003
1,991
854
2004
2,897
1,296
2005
3,857
1,916
2006
3,727
1,705
2007
1,896
949
2008
765
374
2009
440
249
Culture and Food
Both cities boast impressive arrays of dining options that reflect the diverse culture of the region. Chandler is known for its upscale dining and shopping, while Mesa offers a more traditional Arizona experience with Southwestern fare and local treasures.
Sports Teams
While neither city hosts major league sports teams, both have easy access to the professional sports venues in nearby Phoenix. Mesa is the spring training home for the Chicago Cubs and the Oakland A's, making it a favorite destination for baseball fans.


 Mesa, AZ
 Chandler, AZ