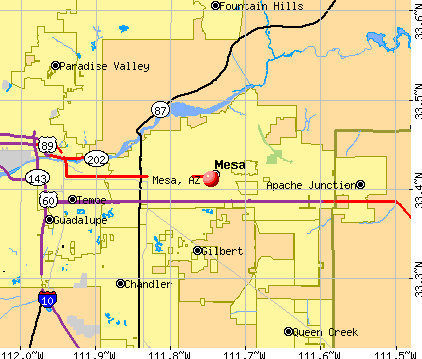
Mesa, Arizona
Mesa: East Mesa during sunset.

Mesa: September sunset
Mesa: January Sunset looking west over Mesa
Mesa: Sunset over the palms
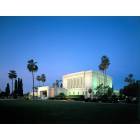
Mesa: LDS (Mormon) temple at dusk
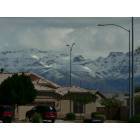
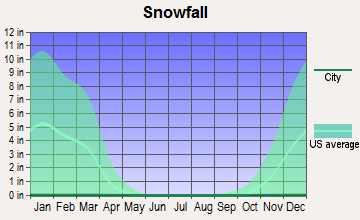
Mesa: Who Says It Doesn't Snow In Arizona (Superstition Mtns.)
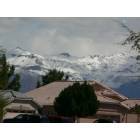
Mesa: 1st Winter Storm of March 2006
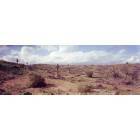
Mesa: North Mesa
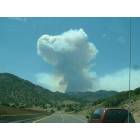
Mesa: Wildfire seen from Mesa, AZ
Mesa: Residential Mesa
Mesa: Dust Storm - Mesa, AZ
- see
22
more - add
your
Submit your own pictures of this city and show them to the world
- OSM Map
- General Map
- Google Map
- MSN Map
Population change since 2000: +29.3%
 |
| Males: 257,866 | |
| Females: 254,632 |
| Median resident age: | 36.7 years |
| Arizona median age: | 38.8 years |
Zip codes: 85201, 85202, 85203, 85205, 85207, 85208, 85210, 85213, 85215, 85281.
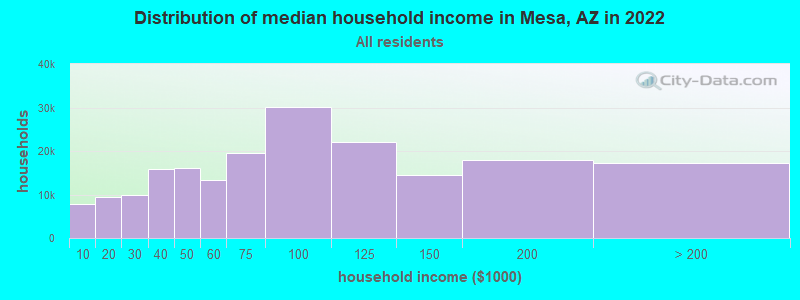
Mesa Zip Code Map| Mesa: | $79,496 |
| AZ: | $74,568 |
Estimated per capita income in 2022: $38,873 (it was $19,601 in 2000)
Mesa city income, earnings, and wages data
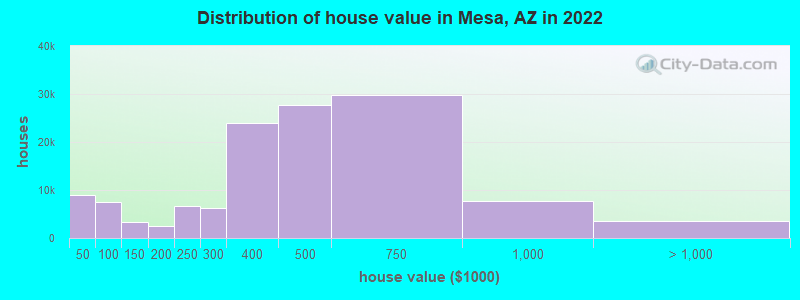
Estimated median house or condo value in 2022: $420,600 (it was $112,100 in 2000)
| Mesa: | $420,600 |
| AZ: | $402,800 |
Mean prices in 2022: all housing units: $449,158; detached houses: $523,767; townhouses or other attached units: $293,690; in 2-unit structures: $447,619; in 3-to-4-unit structures: $295,100; in 5-or-more-unit structures: $226,454; mobile homes: $131,639; occupied boats, rvs, vans, etc.: $32,036
Median gross rent in 2022: $1,500.
(6.9% for White Non-Hispanic residents, 16.9% for Black residents, 14.9% for Hispanic or Latino residents, 16.2% for American Indian residents, 13.5% for Native Hawaiian and other Pacific Islander residents, 17.4% for other race residents, 9.0% for two or more races residents)
Detailed information about poverty and poor residents in Mesa, AZ

Compare current foreclosures in Mesa, AZ:
| Photo | Address | Area | Beds / Baths | Price | Details |
|---|---|---|---|---|---|

|
#1
E University Dr Unit 2017
Mesa, AZ 85205
|
932 sq. feet
|
2 baths 2 beds |
show details | |

|
#2
S Westwood Unit 150
Mesa, AZ 85210
|
792 sq. feet
|
1 baths 2 beds |
show details | |

|
#3
S Pima Unit 8
Mesa, AZ 85210
|
729 sq. feet
|
1 baths 1 beds |
show details | |

|
#4
N 22nd Pl
Mesa, AZ 85213
|
1,364 sq. feet
|
2 baths 3 beds |
show details | |

|
#5
E Posada Ave
Mesa, AZ 85212
|
2,285 sq. feet
|
3 baths 4 beds |
show details | |

|
#6
E Lobo Ave
Mesa, AZ 85209
|
1,617 sq. feet
|
2 baths 3 beds |
show details | |

|
#7
E Inverness Ave
Mesa, AZ 85209
|
1,334 sq. feet
|
2 baths 3 beds |
show details | |

|
#8
W Baseline Rd Unit 2011
Mesa, AZ 85202
|
1,190 sq. feet
|
3 baths 2 beds |
show details | |

|
#9
E Boise St
Mesa, AZ 85205
|
1,025 sq. feet
|
2 baths 2 beds |
show details | |

|
#10
E Fairbrook St
Mesa, AZ 85207
|
1,762 sq. feet
|
2 baths 3 beds |
show details |
| Photo | Address | Area | Beds / Baths | Price | Details |
|---|---|---|---|---|---|

|
#11
E Leonora St
Mesa, AZ 85213
|
2,440 sq. feet
|
3 baths 4 beds |
show details | |

|
#12
E 8th St
Mesa, AZ 85203
|
1,545 sq. feet
|
2 baths 3 beds |
show details | |

|
#13
E Baseline Rd
Mesa, AZ 85209
|
1,612 sq. feet
|
2 baths 3 beds |
show details | |

|
#14
E Carol Ave
Mesa, AZ 85206
|
1,416 sq. feet
|
2 baths 3 beds |
show details | |

|
#15
N 95th Pl
Mesa, AZ 85207
|
1,064 sq. feet
|
2 baths 3 beds |
show details | |

|
#16
S Dobson Rd Unit 85
Mesa, AZ 85202
|
784 sq. feet
|
1 baths 2 beds |
show details | |

|
#17
S Del Rancho
Mesa, AZ 85208
|
2,027 sq. feet
|
2 baths 4 beds |
show details | |

|
#18
E Clovis Cir
Mesa, AZ 85208
|
1,040 sq. feet
|
2 baths 3 beds |
show details | |

|
#19
E Crescent Ave
Mesa, AZ 85208
|
1,245 sq. feet
|
2 baths 3 beds |
show details | |

|
#20
E Hobart St
Mesa, AZ 85205
|
2,170 sq. feet
|
2 baths 3 beds |
show details |
| Photo | Address | Area | Beds / Baths | Price | Details |
|---|---|---|---|---|---|

|
#21
W Elena Ave
Mesa, AZ 85210
|
1,448 sq. feet
|
2 baths 4 beds |
show details | |

|
#22
E Osage Ave
Mesa, AZ 85212
|
3,350 sq. feet
|
2 baths 5 beds |
show details | |

|
#23
S Hill
Mesa, AZ 85204
|
1,432 sq. feet
|
2 baths 3 beds |
show details | |

|
#24
S Canfield
Mesa, AZ 85212
|
2,250 sq. feet
|
2 baths 5 beds |
show details | |

|
#25
W Jasmine St
Mesa, AZ 85201
|
1,843 sq. feet
|
2 baths 3 beds |
show details | |

|
#26
S El Paradiso Unit 64
Mesa, AZ 85202
|
1,963 sq. feet
|
2 baths 3 beds |
show details | |

|
#27
S 33rd Pl
Mesa, AZ 85204
|
1,346 sq. feet
|
2 baths 2 beds |
show details | |

|
#28
S Toltec
Mesa, AZ 85204
|
1,428 sq. feet
|
2 baths 3 beds |
show details | |

|
#29
E Dodge St
Mesa, AZ 85205
|
1,623 sq. feet
|
2 baths 2 beds |
show details | |

|
#30
E Hopi Ave
Mesa, AZ 85204
|
2,366 sq. feet
|
3 baths 5 beds |
show details |
| Photo | Address | Area | Beds / Baths | Price | Details |
|---|---|---|---|---|---|

|
#31
N Saguaro
Mesa, AZ 85201
|
2,312 sq. feet
|
3 baths 4 beds |
show details | |

|
#32
W Pueblo Ave
Mesa, AZ 85202
|
1,379 sq. feet
|
2 baths 3 beds |
show details | |

|
#33
E 2nd Ave
Mesa, AZ 85204
|
1,714 sq. feet
|
2 baths 3 beds |
show details | |

|
#34
E Des Moines St
Mesa, AZ 85205
|
1,332 sq. feet
|
2 baths 2 beds |
show details | |

|
#35
E 1st St
Mesa, AZ 85203
|
1,572 sq. feet
|
1 baths 4 beds |
show details | |

|
#36
W Pantera Ave
Mesa, AZ 85210
|
1,549 sq. feet
|
2 baths 3 beds |
show details | |

|
#37
E Hale St
Mesa, AZ 85203
|
3,881 sq. feet
|
4 baths 5 beds |
show details | |

|
#38
E Decatur St
Mesa, AZ 85205
|
1,654 sq. feet
|
2 baths 3 beds |
show details | |

|
#39
N New Hvn
Mesa, AZ 85205
|
1,566 sq. feet
|
2 baths 3 beds |
show details | |

|
#40
N Stapley Dr Unit 81
Mesa, AZ 85203
|
1,650 sq. feet
|
3 baths 3 beds |
show details |
| Photo | Address | Area | Beds / Baths | Price | Details |
|---|---|---|---|---|---|

|
#41
E Belmont Ave
Mesa, AZ 85208
|
- sq. feet
|
2 baths 3 beds |
show details | |

|
#42
E El Moro Ave
Mesa, AZ 85208
|
3,088 sq. feet
|
3 baths 5 beds |
show details | |

|
#43
W Guadalupe Rd Unit 2016
Mesa, AZ 85210
|
828 sq. feet
|
2 baths - beds |
show details | |

|
#44
E Javelina Ave
Mesa, AZ 85204
|
1,764 sq. feet
|
2 baths 4 beds |
show details | |

|
#45
N Matlock St
Mesa, AZ 85203
|
700 sq. feet
|
2 baths 3 beds |
show details | |

|
#46
E Garnet Ave
Mesa, AZ 85204
|
1,461 sq. feet
|
2 baths 3 beds |
show details | |

|
#47
E Brown Rd Unit 1022
Mesa, AZ 85201
|
917 sq. feet
|
1 baths 2 beds |
show details | |

|
#48
N 97th St
Mesa, AZ 85207
|
1,144 sq. feet
|
2 baths 3 beds |
show details | |

|
#49
N Balboa
Mesa, AZ 85205
|
2,171 sq. feet
|
3 baths - beds |
show details | |

|
Check over 1 million property listings on Foreclosure.com!
|
browse all offers | |||


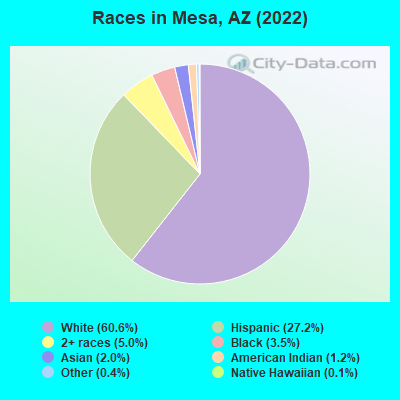
- 310,77160.6%White alone
- 139,16127.2%Hispanic
- 25,7695.0%Two or more races
- 17,9433.5%Black alone
- 10,0422.0%Asian alone
- 6,3711.2%American Indian alone
- 1,8320.4%Other race alone
- 6340.1%Native Hawaiian and Other
Pacific Islander alone
According to our research of Arizona and other state lists, there were 635 registered sex offenders living in Mesa, Arizona as of April 26, 2024.
The ratio of all residents to sex offenders in Mesa is 763 to 1.
The ratio of registered sex offenders to all residents in this city is near the state average.
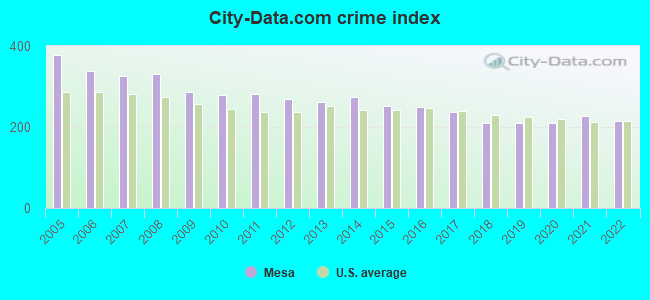
The City-Data.com crime index weighs serious crimes and violent crimes more heavily. Higher means more crime, U.S. average is 246.1. It adjusts for the number of visitors and daily workers commuting into cities.
- means the value is smaller than the state average.- means the value is about the same as the state average.
- means the value is bigger than the state average.
- means the value is much bigger than the state average.
Crime rate in Mesa detailed stats: murders, rapes, robberies, assaults, burglaries, thefts, arson
Full-time law enforcement employees in 2021, including police officers: 1,278 (846 officers - 739 male; 107 female).
| Officers per 1,000 residents here: | 1.65 |
| Arizona average: | 1.75 |
 Recent articles from our blog. Our writers, many of them Ph.D. graduates or candidates, create easy-to-read articles on a wide variety of topics.

 | The Positives of Mesa and Prescott (8 replies) |
| Neighborhood advice - North Phoenix vs North Glendale vs West Mesa/North Gilbert (21 replies) |
| Apartment leads southern Mesa/northern Gilbert near the 60 (26 replies) |
| information on Mesa (9 replies) |
| Mesa since the 1980's (11 replies) |
| USS Arizona exhibit opening today in Mesa (0 replies) |
Latest news from Mesa, AZ collected exclusively by city-data.com from local newspapers, TV, and radio stations
Ancestries: American (11.2%), English (7.5%), German (7.3%), Irish (4.2%), European (3.7%), Italian (2.1%).
Current Local Time: MST (no DST) time zone
Incorporated in 1883
Land area: 125.0 square miles.
Population density: 4,100 people per square mile (average).
59,853 residents are foreign born (7.6% Latin America, 1.7% Asia).
| This city: | 11.6% |
| Arizona: | 13.0% |
Median real estate property taxes paid for housing units with mortgages in 2022: $1,656 (0.4%)
Median real estate property taxes paid for housing units with no mortgage in 2022: $1,344 (0.4%)
Nearest city with pop. 1,000,000+: Phoenix, AZ  (20.7 miles , pop. 1,321,045).
Nearest cities:
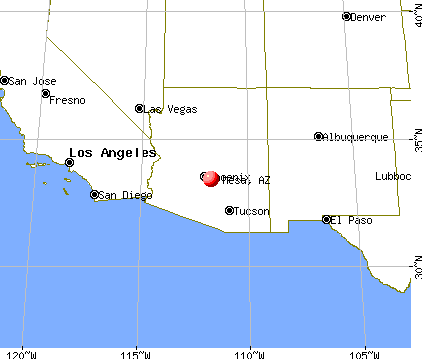
), Latitude: 33.41 N, Longitude: 111.75 W
Daytime population change due to commuting: -23,266 (-4.5%)
Workers who live and work in this city: 123,809 (48.5%)
Property values in Mesa, AZ

Mesa tourist attractions:
- The Arizona Museum for Youth encourages hand-on activities to encourage children into appreciating art
- Fiesta Mall - Mesa, Arizona - Shopping Center
- Mesa Convention Center - Mesa, AZ - Events and exhibition facility
- Mesa Riverview - Mesa, Arizona - Shopping Center Featuring Entertainment Facilities
- Commemorative Air Force Museum
- Longbow Golf Club
- Cedar Grove Village
- Cedar Springs Trail
- Arizona Museum of Natural History
- JJ's Old West Flea Market & Farmer's Market
- Mesa Historical Museum - Mesa, AZ - a museum dedication to preserving the history of Mesa, Arizona
- Superstition Springs Golf Club - Mesa, AZ - a club that offers facilities to meet virtually every need
- Superstition Farm - Mesa, AZ - Working dairy farm
- Superstition Springs Center - Mesa, Arizona - Shopping Complex
Mesa, Arizona accommodation & food services, waste management - Economy and Business Data
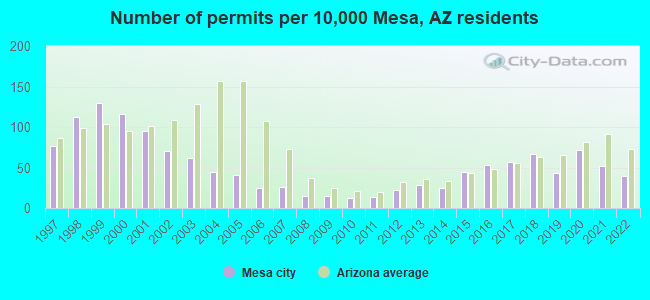
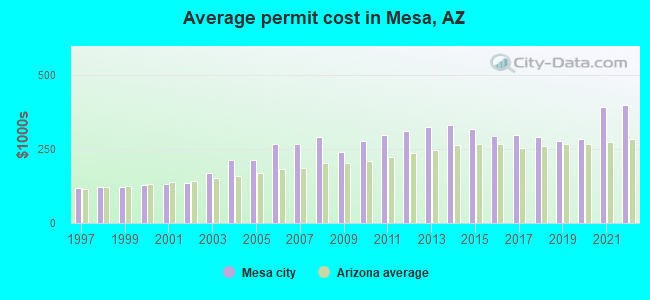
Single-family new house construction building permits:
- 2022: 1536 buildings, average cost: $398,600
- 2021: 2046 buildings, average cost: $391,600
- 2020: 2826 buildings, average cost: $284,800
- 2019: 1710 buildings, average cost: $276,800
- 2018: 2658 buildings, average cost: $289,200
- 2017: 2251 buildings, average cost: $296,000
- 2016: 2113 buildings, average cost: $291,800
- 2015: 1746 buildings, average cost: $317,800
- 2014: 1006 buildings, average cost: $330,400
- 2013: 1097 buildings, average cost: $324,000
- 2012: 861 buildings, average cost: $311,100
- 2011: 503 buildings, average cost: $296,700
- 2010: 487 buildings, average cost: $276,200
- 2009: 604 buildings, average cost: $240,100
- 2008: 584 buildings, average cost: $289,200
- 2007: 1039 buildings, average cost: $264,900
- 2006: 975 buildings, average cost: $264,500
- 2005: 1607 buildings, average cost: $213,300
- 2004: 1774 buildings, average cost: $210,700
- 2003: 2474 buildings, average cost: $169,300
- 2002: 2765 buildings, average cost: $134,300
- 2001: 3767 buildings, average cost: $131,900
- 2000: 4581 buildings, average cost: $127,300
- 1999: 5147 buildings, average cost: $119,900
- 1998: 4447 buildings, average cost: $121,700
- 1997: 3060 buildings, average cost: $117,000
| Here: | 3.3% |
| Arizona: | 3.8% |

Population change in the 1990s: +105,119 (+36.1%).
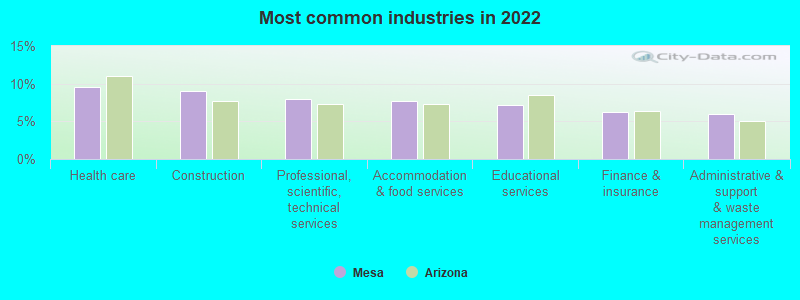
- Health care (9.5%)
- Construction (9.0%)
- Professional, scientific, technical services (8.0%)
- Accommodation & food services (7.8%)
- Educational services (7.2%)
- Finance & insurance (6.3%)
- Administrative & support & waste management services (6.0%)
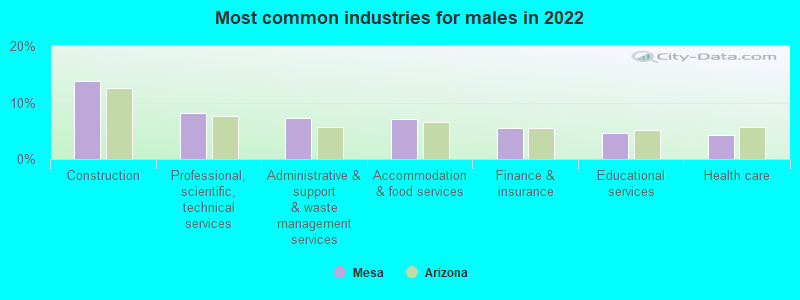
- Construction (13.8%)
- Professional, scientific, technical services (8.2%)
- Administrative & support & waste management services (7.2%)
- Accommodation & food services (7.0%)
- Finance & insurance (5.5%)
- Educational services (4.6%)
- Health care (4.2%)
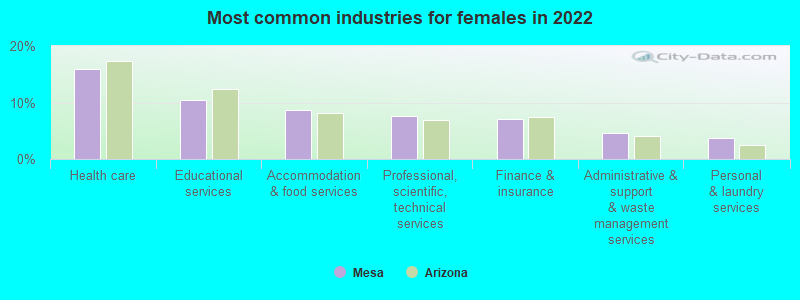
- Health care (15.9%)
- Educational services (10.4%)
- Accommodation & food services (8.7%)
- Professional, scientific, technical services (7.7%)
- Finance & insurance (7.1%)
- Administrative & support & waste management services (4.5%)
- Personal & laundry services (3.7%)
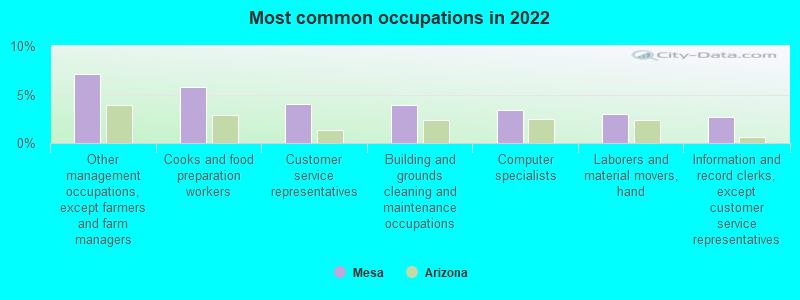
- Other management occupations, except farmers and farm managers (7.1%)
- Cooks and food preparation workers (5.7%)
- Customer service representatives (4.0%)
- Building and grounds cleaning and maintenance occupations (3.9%)
- Computer specialists (3.5%)
- Laborers and material movers, hand (3.0%)
- Information and record clerks, except customer service representatives (2.7%)
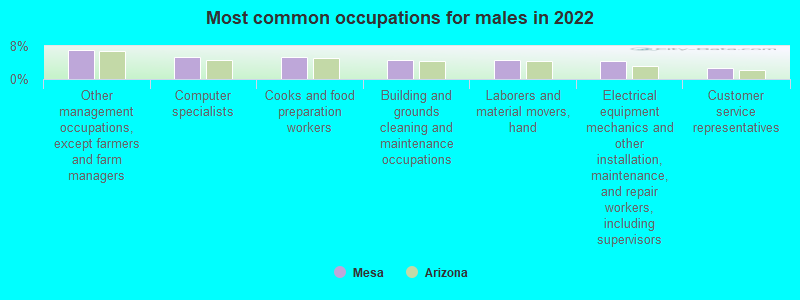
- Other management occupations, except farmers and farm managers (7.0%)
- Computer specialists (5.5%)
- Cooks and food preparation workers (5.3%)
- Building and grounds cleaning and maintenance occupations (4.6%)
- Laborers and material movers, hand (4.6%)
- Electrical equipment mechanics and other installation, maintenance, and repair workers, including supervisors (4.2%)
- Customer service representatives (2.7%)
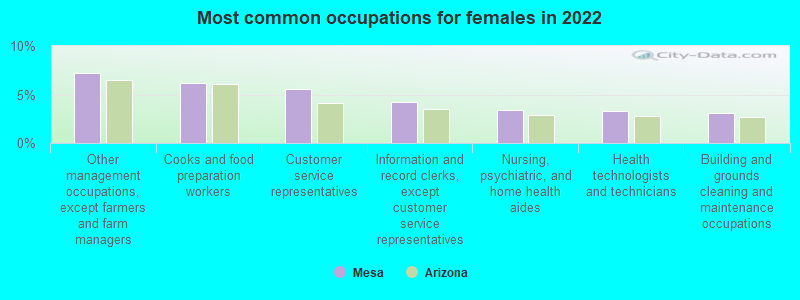
- Other management occupations, except farmers and farm managers (7.2%)
- Cooks and food preparation workers (6.2%)
- Customer service representatives (5.6%)
- Information and record clerks, except customer service representatives (4.3%)
- Nursing, psychiatric, and home health aides (3.4%)
- Health technologists and technicians (3.3%)
- Building and grounds cleaning and maintenance occupations (3.1%)
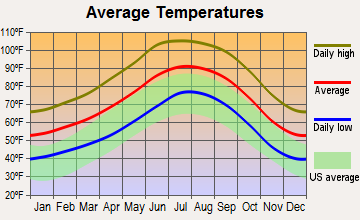
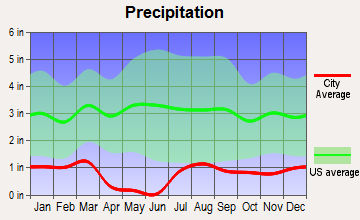
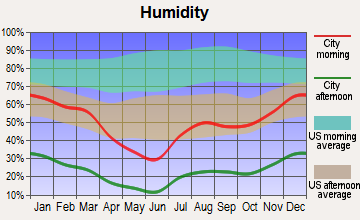
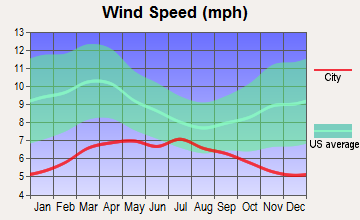
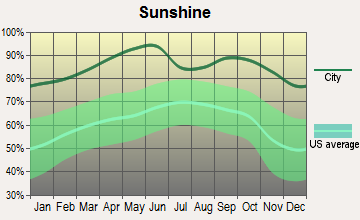
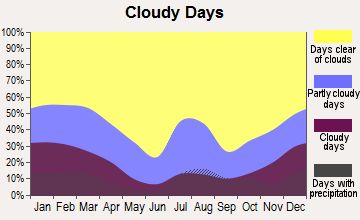
Average climate in Mesa, Arizona
Based on data reported by over 4,000 weather stations
|
|

(lower is better)
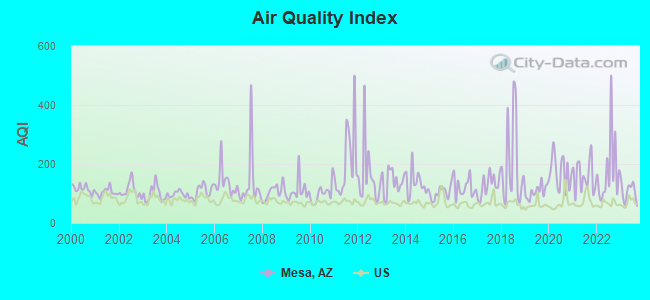
Air Quality Index (AQI) level in 2023 was 106. This is significantly worse than average.
| City: | 106 |
| U.S.: | 73 |
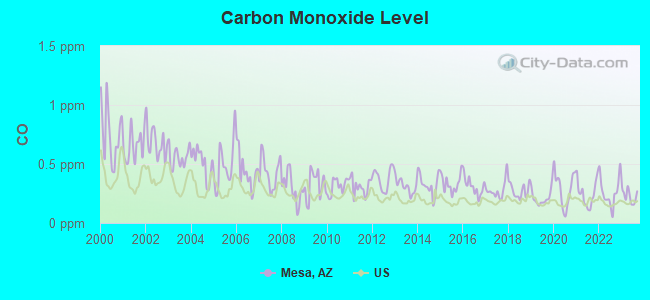
Carbon Monoxide (CO) [ppm] level in 2023 was 0.230. This is about average. Closest monitor was 3.7 miles away from the city center.
| City: | 0.230 |
| U.S.: | 0.251 |
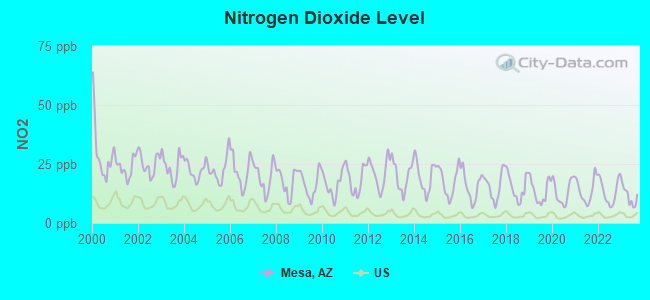
Nitrogen Dioxide (NO2) [ppb] level in 2023 was 11.3. This is significantly worse than average. Closest monitor was 8.6 miles away from the city center.
| City: | 11.3 |
| U.S.: | 5.1 |
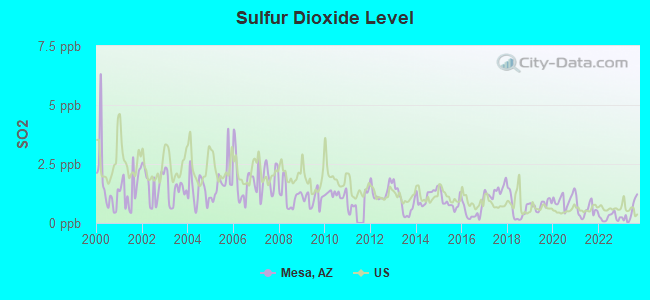
Sulfur Dioxide (SO2) [ppb] level in 2023 was 0.478. This is significantly better than average. Closest monitor was 6.8 miles away from the city center.
| City: | 0.478 |
| U.S.: | 1.515 |
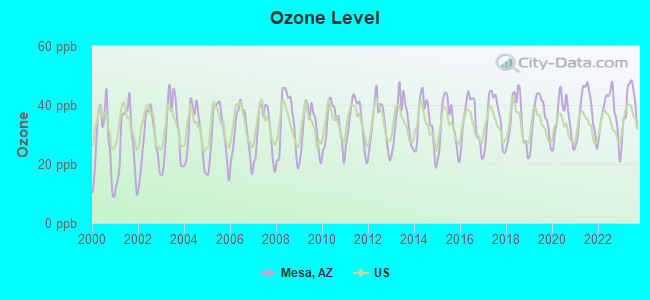
Ozone [ppb] level in 2023 was 39.8. This is about average. Closest monitor was 3.0 miles away from the city center.
| City: | 39.8 |
| U.S.: | 33.3 |
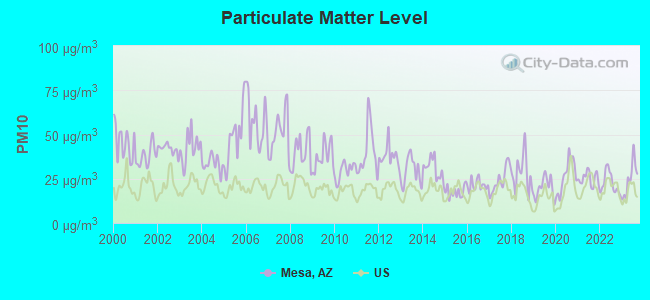
Particulate Matter (PM10) [µg/m3] level in 2023 was 25.1. This is worse than average. Closest monitor was 3.7 miles away from the city center.
| City: | 25.1 |
| U.S.: | 19.2 |
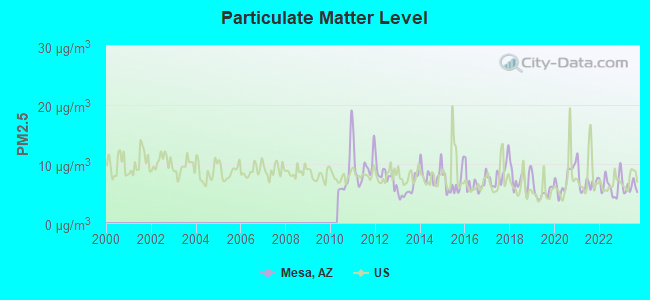
Particulate Matter (PM2.5) [µg/m3] level in 2023 was 6.09. This is better than average. Closest monitor was 6.9 miles away from the city center.
| City: | 6.09 |
| U.S.: | 8.11 |
Earthquake activity:
Mesa-area historical earthquake activity is significantly above Arizona state average. It is 2249% greater than the overall U.S. average.On 6/28/1992 at 11:57:34, a magnitude 7.6 (6.2 MB, 7.6 MS, 7.3 MW, Depth: 0.7 mi, Class: Major, Intensity: VIII - XII) earthquake occurred 280.2 miles away from Mesa center, causing 3 deaths (1 shaking deaths, 2 other deaths) and 400 injuries, causing $100,000,000 total damage and $40,000,000 insured losses
On 5/19/1940 at 04:36:40, a magnitude 7.2 (7.2 UK) earthquake occurred 228.7 miles away from the city center, causing $33,000,000 total damage
On 10/16/1999 at 09:46:44, a magnitude 7.4 (6.3 MB, 7.4 MS, 7.2 MW, 7.3 ML) earthquake occurred 279.6 miles away from the city center
On 12/31/1934 at 18:45:56, a magnitude 7.1 (7.1 UK) earthquake occurred 238.1 miles away from Mesa center
On 10/15/1979 at 23:16:54, a magnitude 7.0 (5.7 MB, 6.9 MS, 7.0 ML, 6.4 MW) earthquake occurred 229.2 miles away from Mesa center
On 7/21/1952 at 11:52:14, a magnitude 7.7 (7.7 UK) earthquake occurred 429.1 miles away from Mesa center, causing $50,000,000 total damage
Magnitude types: body-wave magnitude (MB), local magnitude (ML), surface-wave magnitude (MS), moment magnitude (MW)
Natural disasters:
The number of natural disasters in Maricopa County (16) is near the US average (15).Major Disasters (Presidential) Declared: 11
Emergencies Declared: 1
Causes of natural disasters: Floods: 10, Storms: 9, Fires: 3, Flash Flood: 1, Heavy Rain: 1, Hurricane: 1, Tornado: 1, Wind: 1, Other: 1 (Note: some incidents may be assigned to more than one category).
Main business address for: YP CORP (SERVICES-COMPUTER PROGRAMMING SERVICES), DURASWITCH INDUSTRIES INC (ELECTRONIC COMPONENTS, NEC).
Hospitals in Mesa:
- AMERICARE HOSPICE AND PALLIATIVE CARE (1103 SOUTH MESA DRIVE SUITE # 2)
- ARIZONA REGIONAL MEDICAL CENTER (provides emergency services, 515 NORTH MESA DRIVE)
- ARIZONA SPINE AND JOINT HOSPITAL (Proprietary, provides emergency services, 4620 EAST BASELINE ROAD)
- BANNER BAYWOOD MEDICAL CENTER (Voluntary non-profit - Private, 6644 EAST BAYWOOD AVENUE)
- BANNER HEART HOSPITAL (Voluntary non-profit - Private, provides emergency services, 6750 EAST BAYWOOD AVENUE)
- CHARTER MESA BEHAVIORAL HEALTH SYSTEM (570 WEST BROWN ROAD)
- HOSPICE FAMILY CARE (1550 S. ALMA SCHOOL RD #102)
- HOSPICE OF THE VALLEY EAST (777 WEST SOUTHERN AVENUE, SUITE 301)
- MOUNTAIN VISTA MEDICAL CENTER, LP (Proprietary, 1301 SOUTH CRISMON ROAD)
- SELECT SPECIALTY HOSPITAL MESA ("1010 NORTH COUNTRY CLUB, 7TH FLOOR")
Airports and heliports located in Mesa:
- Falcon Fld Airport (FFZ) (Runways: 4, Commercial Ops: 18, Air Taxi Ops: 38,255, Itinerant Ops: 65,268, Local Ops: 129,839, Military Ops: 3,043)
- Phoenix-Mesa Gateway Airport (IWA) (Runways: 3, Commercial Ops: 10,134, Air Taxi Ops: 22,867, Itinerant Ops: 60,617, Local Ops: 125,871, Military Ops: 8,879)
- Heliports: 8
Amtrak stations near Mesa:
- 16 miles: PHOENIX AIRPORT (PHOENIX, TERMINAL 2) - Bus Station . Services: enclosed waiting area, public restrooms, public payphones, full-service food facilities, paid short-term parking, paid long-term parking, car rental agency, taxi stand, intercity bus service, public transit connection.
- 20 miles: PHOENIX (401 W. HARRISON ST.) - Bus Station . Services: ticket office, enclosed waiting area, public restrooms, public payphones, vending machines, free short-term parking, paid long-term parking, taxi stand.
Colleges/Universities in Mesa:
- Mesa Community College (Full-time enrollment: 14,726; Location: 1833 W Southern Ave; Public; Website: www.mesacc.edu)
- Arizona State University-Polytechnic (Full-time enrollment: 3,311; Location: 7001 E Williams Field Road; Public; Website: www.asu.edu/; Offers Doctor's degree)
- Pima Medical Institute-Mesa (Full-time enrollment: 1,713; Location: 957 S. Dobson Road; Private, for-profit; Website: pmi.edu)
- Carrington College-Mesa (Full-time enrollment: 767; Location: 1001 Southern Ave., Ste. 130; Private, for-profit; Website: www.carrington.edu)
- Pima Medical Institute-East Valley (Full-time enrollment: 683; Location: 2160 S Power Rd; Private, for-profit; Website: pmi.edu)
- Avalon School of Cosmetology-Mesa (Full-time enrollment: 492; Location: 2111 S Alma School Rd Ste 21; Private, for-profit; Website: www.avalon.com)
- East Valley Institute of Technology (Full-time enrollment: 379; Location: 1601 W Main St; Public; Website: www.evit.com)
- Everest College-Mesa (Full-time enrollment: 372; Location: 5416 East Baseline Ste. 200; Private, for-profit; Website: www.everestcollegephoenix.edu)
- International Academy of Hair Design (Full-time enrollment: 269; Location: 1445 W Southern Ave #2006; Private, for-profit; Website: www.intlacademyaz.com/)
- Regency Beauty Institute-Mesa (Full-time enrollment: 79; Location: 1457 W Southern Ave, Suite 113; Private, for-profit; Website: www.regency.edu)
- Arizona College-Mesa (Full-time enrollment: 78; Location: 163 N Dobson Rd; Private, for-profit; Website: www.arizonacollege.edu)
Other colleges/universities with over 2000 students near Mesa:
- Chandler-Gilbert Community College (about 9 miles; Chandler, AZ; Full-time enrollment: 8,047)
- Scottsdale Community College (about 11 miles; Scottsdale, AZ; FT enrollment: 6,030)
- Arizona State University-Skysong (about 11 miles; Scottsdale, AZ; FT enrollment: 5,445)
- Le Cordon Bleu College of Culinary Arts-Scottsdale (about 12 miles; Scottsdale, AZ; FT enrollment: 2,123)
- Arizona State University-Tempe (about 12 miles; Tempe, AZ; FT enrollment: 45,951)
- University of Phoenix-Phoenix Campus (about 13 miles; Tempe, AZ; FT enrollment: 3,862)
- Rio Salado College (about 14 miles; Tempe, AZ; FT enrollment: 14,894)
Private high schools in Mesa:
Private elementary/middle schools in Mesa:
- CHRIST THE KING SCHOOL (Students: 227, Location: 1551 E DANA AVE, Grades: PK-8)
- ST TIMOTHY CATHOLIC SCHOOL (Students: 203, Location: 2520 S ALMA SCHOOL RD, Grades: KG-8)
- QUEEN OF PEACE CATHOLIC SCHOOL (Students: 188, Location: 109 N MACDONALD, Grades: PK-8)
- MONTESSORI INTERNATIONAL SCHOOL (Students: 114, Location: 1230 N GILBERT RD, Grades: PK-8)
- PILGRIM LUTHERAN SCHOOL (Students: 64, Location: 3257 E UNIVERSITY DR, Grades: PK-8)
- TEMPE MONTESSORI SCHOOL LTD (Students: 61, Location: 410 S EL DORADO RD, Grades: PK-T1)
- ADOBE ADVENTIST CHRISTIAN SCHOOL (Students: 8, Location: 9910 E ADOBE RD, Grades: 1-7)
- RED ROCK CHRISTIAN SCHOOL (Students: 5, Location: 6263 E THOMAS RD, Grades: 1-5)
Library in Mesa:
- CITY OF MESA MAIN LIBRARY (Operating income: $9,352,136; Location: 64 E. FIRST ST.; 548,918 books; 36,161 e-books; 7,824 audio materials; 15,041 video materials; 33 local licensed databases; 1 state licensed databases; 31 other licensed databases; 991 print serial subscriptions; 1 electronic serial subscriptions)
User-submitted facts and corrections:
- Additional colleges: Arizona School of Allied Health Sciences.
- It is no longer Valley Lutheran Hospital, it is Banner Baywood
- University in Mesa A.T. Still University, Arizona School of Health Sciences, located on Baseline and S. Recker Rd.
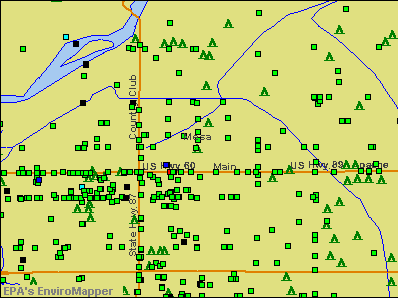
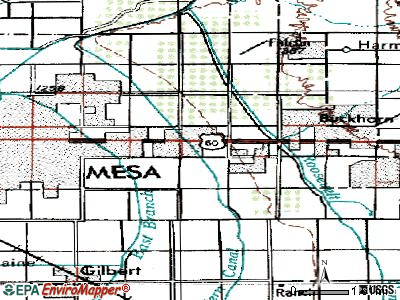
Points of interest:
Notable locations in Mesa: Alma (A), Arizona Girls Ranch (B), Anderson Ranch (C), Water Users Camp Ten (D), Red Mountain Ranch (E), Apache Substation (F), Falcon Substation (G), Happy Days Travel Trailer Park (H), Signal Butte Substation (I), Sun Life Travel Trailer Park (J), Desert Proving Grounds (K), Lehi Substation (L), Mesa Grande Ruins (M), Mesa Substation (N), Rice Substation (O), Mesa Golf and Country Club (P), Shady Grove Mobile and Recreational Vehicle Park (Q), University of Arizona Experimental Farm (R), Apache Wells Golf Course (S), Camelot Golf Course (T). Display/hide their locations on the map
Shopping Centers: Apache Plaza Shopping Center (1), Buckhorn Shopping Center (2), Fountain of the Sun Shopping Center (3), Mesa Mall (4), Sun Valley Plaza Shopping Center (5), Sunvalley Square Shopping Center (6), Velda Rose Shopping Center (7), Dobson Plaza Shopping Center (8), Fiesta Mall (9). Display/hide their locations on the map
Main business address in Mesa include: YP CORP (A), DURASWITCH INDUSTRIES INC (B). Display/hide their locations on the map
Churches in Mesa include: Iglesia el Buen Pastor (A), Latter Day Saints Temple (B), Hi - Way Baptist Church (C), Harmony Community Baptist Church (D), Grace United Methodist Church (E), Grace Church (F), Gospel Light Baptist Church (G), Gilbert Family Church (H), Gethsemane Park Apostolic Church (I). Display/hide their locations on the map
Cemeteries: City of Mesa Cemetery (1), Mountain View Memorial Gardens (2), Queen of Heaven Cemetery (3). Display/hide their locations on the map
Reservoirs: Country Manor Subdivision Water Retention Basin (A), Emerald Acres Number Two Subdivision Water Retention Basin (B), Gilbert Estates Phase Two Water Retention Basin (C), Kirk Estates Subdivision Water Retention Basin (D), Knoll East Subdivision Water Retention Basin (E), McAfee Place Unit Two Water Retention Basin (F), Mesa Meadows Subdivision Water Retention Basin (G), Mesa Tierra Number Three Subdivision Water Retention Basin (H). Display/hide their locations on the map
Parks in Mesa include: Val Vista Village Trailer Park Mini Park (1), Rendezvous Park (2), Fitch Park (3), Sunset Mesa Subdivision Mini Park (4), Alma Ward Park (5), Stewart Park (6), Stapley Park (7), Sherwood Park (8), Ho Ho Kam Park (9). Display/hide their locations on the map
Tourist attractions: Mesa Southwest Museum (53 North Macdonald) (1), Commemorative Airforce (Museums; 2017 North Greenfield Road) (2), Arizona Museum for Youth (35 North Robson) (3), Buckhorn Wildlife Museum (5900 East Main Street) (4), Mesa Historical Museum (2345 North Horne) (5), Mesa City Government - Arts and Cultural Division- Mesa Southwest Museum- Informa (53 North Macdonald) (6), Sliger T W (Cultural Attractions- Events- & Facilities; 5900 East Main Street) (7), Golfland Entertainment Centers (Water Parks & Slides; 155 West Hampton Avenue) (8), Sirrine House Museum (Cultural Attractions- Events- & Facilities; 160 North Center Street) (9). Display/hide their approximate locations on the map
Hotels: Hampton Inn Phoenix-Mesa (1563 S Gilbert Rd) (1), Extended Stay America - Mesa (455 W Baseline Rd) (2), Kiva Lodge Motel (668 West Main Street) (3), City Accommaditions Network (1855 East Southern Avenue) (4), Hilton Phoenix East Mesa (1011 West Holmes Avenue) (5), Appollo Mezona Inc (250 West Main Street) (6), Extended Stayamerica (455 West Baseline Road) (7), Inn Management Company (1666 South Dobson Road) (8), Lost Dutchman Lodge Motel (560 South Country Club Drive) (9). Display/hide their approximate locations on the map
Courts: Maricopa County Government - Justice of the Peace- West Mesa Justice C (2050 West University Drive) (1), Maricopa County - Superior Court In Maricopa County (222 East Javelina Avenue) (2), Maricopa County Government - Justice Of The Peace- North Mesa Justice C (1837 South Mesa Drive) (3), Maricopa County - Constables- S Mesa-Gilbert (1837 South Mesa Drive) (4), Maricopa County Government - Justice of the Peace- East Mesa Justice C (4811 East Julep Street Suite 128) (5), Mesa City Government - City Court (245 West 2nd Street Frnt) (6), Maricopa County - Superior Court In Maricopa County- Southeast Mesa Complex- Adult C (222 East Javelina Avenue) (7), Maricopa County - Superior Court In Maricopa County- Southeast Mesa Branch Superior C (222 East Javelina Avenue) (8). Display/hide their approximate locations on the map
Birthplace of: Russell Pearce - Law enforcement officer and politician, Mickey McConnell - Basketball player, Danny White - Football player, Mike Lee (U.S. politician) - Politician, Abigail Mavity - Child actor, Jake Shears - Male singer, Wayne Thiebaud - Artist, Marquis Cooper - 2005 NFL player (Tampa Bay Buccaneers, born: Mar 11, 1982), Vance Wilson - 2005 Major League Baseball player (Detroit Tigers, born: Mar 17, 1973), Todd Heap - 2005 NFL player (Baltimore Ravens, born: Mar 16, 1980).
Drinking water stations with addresses in Mesa and their reported violations in the past:
MESA CITY OF (Population served: 466,000, Surface water):Past monitoring violations:CASA GRANDE WEST WATER COMPANY (Address: 7165 E UNIVERSITY DR , Population served: 834, Groundwater):
- Monitoring and Reporting (DBP) - Between JUL-2012 and SEP-2012, Contaminant: Chlorine
- Monitoring and Reporting (DBP) - Between JUL-2007 and SEP-2007, Contaminant: Total Haloacetic Acids (HAA5). Follow-up actions: St Compliance achieved (APR-20-2009)
- Monitoring and Reporting (DBP) - Between JUL-2007 and SEP-2007, Contaminant: TTHM. Follow-up actions: St Compliance achieved (APR-20-2009)
- Monitoring and Reporting (DBP) - Between APR-2007 and JUN-2007, Contaminant: TTHM. Follow-up actions: St Compliance achieved (APR-20-2009)
- Monitoring and Reporting (DBP) - Between APR-2007 and JUN-2007, Contaminant: Total Haloacetic Acids (HAA5). Follow-up actions: St Compliance achieved (APR-20-2009)
- 4 routine major monitoring violations
- One minor monitoring violation
- 448 regular monitoring violations
- 8 other older monitoring violations
Past health violations:SAGUARO LAKE MARINA (Population served: 450, Surface water):Past monitoring violations:
- MCL, Average - Between APR-2011 and JUN-2011, Contaminant: Arsenic. Follow-up actions: St AO (w/o penalty) issued (MAR-02-2010), State No Longer Subject to Rule (MAY-23-2012)
- MCL, Single Sample - Between JAN-2011 and MAR-2011, Contaminant: Arsenic. Follow-up actions: St AO (w/o penalty) issued (MAR-02-2010), St Compliance achieved (2 times from DEC-11-2012 to DEC-20-2012)
- MCL, Average - Between JAN-2011 and MAR-2011, Contaminant: Arsenic. Follow-up actions: St AO (w/o penalty) issued (MAR-02-2010), State No Longer Subject to Rule (MAY-23-2012), St Compliance achieved (DEC-20-2012)
- MCL, Average - Between JUL-2010 and SEP-2010, Contaminant: Arsenic. Follow-up actions: St AO (w/o penalty) issued (MAR-02-2010), St Compliance achieved (2 times from DEC-11-2012 to DEC-20-2012)
- MCL, Average - Between JUL-2010 and SEP-2010, Contaminant: Arsenic. Follow-up actions: St AO (w/o penalty) issued (MAR-02-2010), State No Longer Subject to Rule (MAY-23-2012), St Compliance achieved (DEC-20-2012)
- MCL, Average - Between APR-2010 and JUN-2010, Contaminant: Arsenic. Follow-up actions: St AO (w/o penalty) issued (MAR-02-2010), St Compliance achieved (2 times from DEC-11-2012 to DEC-20-2012)
- 12 other older health violations
- Follow-up Or Routine LCR Tap M/R - In OCT-01-2013, Contaminant: Lead and Copper Rule. Follow-up actions: St Violation/Reminder Notice (DEC-23-2013), St Compliance achieved (MAY-06-2014)
- Follow-up Or Routine LCR Tap M/R - In OCT-01-2012, Contaminant: Lead and Copper Rule. Follow-up actions: St Violation/Reminder Notice (NOV-06-2012), St Compliance achieved (MAY-06-2014)
- Monitoring and Reporting (DBP) - Between JAN-2011 and DEC-2011, Contaminant: Total Haloacetic Acids (HAA5). Follow-up actions: St Compliance achieved (MAR-11-2014)
- Monitoring and Reporting (DBP) - Between JAN-2011 and DEC-2011, Contaminant: TTHM. Follow-up actions: St Compliance achieved (MAR-11-2014)
- Follow-up Or Routine LCR Tap M/R - In OCT-01-2010, Contaminant: Lead and Copper Rule. Follow-up actions: St Violation/Reminder Notice (FEB-01-2011), St Compliance achieved (2 times from FEB-26-2013 to MAY-06-2014)
- 7 routine major monitoring violations
- 25 regular monitoring violations
- 12 other older monitoring violations
Past health violations:USFS TNF RATTLESNAKE COVE (Address: 5140 E INGRAM ST , Population served: 150, Groundwater):Past monitoring violations:
- MCL, Average - Between JAN-2006 and MAR-2006, Contaminant: TTHM. Follow-up actions: St Compliance achieved (NOV-21-2006)
- MCL, Average - Between OCT-2005 and DEC-2005, Contaminant: Total Haloacetic Acids (HAA5). Follow-up actions: St Compliance achieved (OCT-26-2006)
- MCL, Average - Between OCT-2005 and DEC-2005, Contaminant: TTHM. Follow-up actions: St Compliance achieved (NOV-21-2006)
- MCL, Average - Between JUL-2005 and SEP-2005, Contaminant: Total Haloacetic Acids (HAA5). Follow-up actions: St Compliance achieved (NOV-21-2006)
- MCL, Average - Between JUL-2005 and SEP-2005, Contaminant: TTHM. Follow-up actions: St Compliance achieved (NOV-21-2006)
- MCL, Average - Between APR-2005 and JUN-2005, Contaminant: Total Haloacetic Acids (HAA5). Follow-up actions: St Compliance achieved (OCT-26-2006)
- MCL, Average - Between APR-2005 and JUN-2005, Contaminant: TTHM. Follow-up actions: St Compliance achieved (OCT-26-2006)
- Monitoring and Reporting (DBP) - Between OCT-2008 and DEC-2008, Contaminant: Chlorine. Follow-up actions: State No Longer Subject to Rule (OCT-31-2008)
- Follow-up Or Routine LCR Tap M/R - In OCT-01-2006, Contaminant: Lead and Copper Rule. Follow-up actions: St Violation/Reminder Notice (MAY-19-2008), State No Longer Subject to Rule (OCT-31-2008)
- Follow-up Or Routine LCR Tap M/R - In OCT-01-2005, Contaminant: Lead and Copper Rule. Follow-up actions: St Violation/Reminder Notice (MAY-19-2008), State No Longer Subject to Rule (OCT-31-2008)
- Monitoring and Reporting (DBP) - Between JUL-2005 and SEP-2005, Contaminant: Chlorine. Follow-up actions: St Compliance achieved (DEC-06-2006)
- Monitoring and Reporting (DBP) - Between APR-2005 and JUN-2005, Contaminant: Chlorine
- 2 other older monitoring violations
Past monitoring violations:ARIZONA DAIRY COMPANY LLP (Address: 19135 E ELLIOTT RD , Population served: 100, Groundwater):
- Monitoring, Source Water (GWR) - In MAY-26-2010, Contaminant: E. COLI. Follow-up actions: St Compliance achieved (JUL-22-2010)
- Monitoring, Repeat Major (TCR) - In MAY-2010, Contaminant: Coliform (TCR). Follow-up actions: St Compliance achieved (MAY-16-2011)
- 6 routine major monitoring violations
- One regular monitoring violation
Past monitoring violations:SLEEPY HOLLOW RV PARK (Address: 6223 E SNOWDON , Population served: 100, Groundwater):
- Monitoring and Reporting (DBP) - Between OCT-2008 and DEC-2008, Contaminant: Chlorine. Follow-up actions: St Violation/Reminder Notice (FEB-13-2009), St Compliance achieved (FEB-25-2009)
- Monitoring and Reporting (DBP) - Between JAN-2006 and DEC-2006, Contaminant: TTHM. Follow-up actions: St Compliance achieved (DEC-04-2007)
- Monitoring and Reporting (DBP) - Between JAN-2006 and DEC-2006, Contaminant: Total Haloacetic Acids (HAA5). Follow-up actions: St Compliance achieved (DEC-04-2007)
- Monitoring and Reporting (DBP) - Between JUL-2005 and SEP-2005, Contaminant: Chlorine. Follow-up actions: St Compliance achieved (MAR-23-2007)
- Monitoring and Reporting (DBP) - Between JAN-2005 and DEC-2005, Contaminant: Total Haloacetic Acids (HAA5). Follow-up actions: St Compliance achieved (DEC-04-2007)
- One routine major monitoring violation
- 6 regular monitoring violations
- 2 other older monitoring violations
Past monitoring violations:SNOWBIRD WEST RV PARK (Address: 2623 N MOUNTVIEW RD , Population served: 100, Groundwater):
- Monitoring, Source Water (GWR) - In JUN-22-2014, Contaminant: E. COLI. Follow-up actions: St Violation/Reminder Notice (AUG-07-2014)
- Monitoring, Source Water (GWR) - In AUG-18-2011, Contaminant: E. COLI. Follow-up actions: St Compliance achieved (NOV-08-2011)
- Monitoring, Repeat Major (TCR) - In AUG-2011, Contaminant: Coliform (TCR). Follow-up actions: St Compliance achieved (MAR-20-2012)
- 9 routine major monitoring violations
- 2 minor monitoring violations
- One regular monitoring violation
Past health violations:STANFORD GENERAL STORE (Address: 151 N. COUNTRY CLUB , Population served: 50, Groundwater):Past monitoring violations:
- MCL, Monthly (TCR) - In DEC-2011, Contaminant: Coliform. Follow-up actions: St Violation/Reminder Notice (FEB-01-2012), St Compliance achieved (APR-26-2012)
- MCL, Monthly (TCR) - In DEC-2009, Contaminant: Coliform. Follow-up actions: St Compliance achieved (MAY-10-2011)
- Monitoring, Source Water (GWR) - In DEC-24-2009, Contaminant: E. COLI. Follow-up actions: St Compliance achieved (DEC-12-2011)
- Monitoring, Repeat Major (TCR) - In MAR-2007, Contaminant: Coliform (TCR). Follow-up actions: St Compliance achieved (AUG-15-2008)
- 15 routine major monitoring violations
- 2 minor monitoring violations
- 3 regular monitoring violations
Past monitoring violations:
- One regular monitoring violation
| This city: | 2.6 people |
| Arizona: | 2.6 people |
| This city: | 65.8% |
| Whole state: | 66.2% |
| This city: | 7.7% |
| Whole state: | 7.8% |
Likely homosexual households (counted as self-reported same-sex unmarried-partner households)
- Lesbian couples: 0.4% of all households
- Gay men: 0.3% of all households
People in group quarters in Mesa in 2010:
- 928 people in nursing facilities/skilled-nursing facilities
- 756 people in group homes intended for adults
- 373 people in other noninstitutional facilities
- 336 people in residential treatment centers for adults
- 311 people in college/university student housing
- 262 people in workers' group living quarters and job corps centers
- 177 people in group homes for juveniles (non-correctional)
- 156 people in emergency and transitional shelters (with sleeping facilities) for people experiencing homelessness
- 105 people in correctional facilities intended for juveniles
- 59 people in residential treatment centers for juveniles (non-correctional)
- 29 people in hospitals with patients who have no usual home elsewhere
- 26 people in correctional residential facilities
- 20 people in in-patient hospice facilities
People in group quarters in Mesa in 2000:
- 1,705 people in nursing homes
- 1,259 people in other noninstitutional group quarters
- 287 people in homes or halfway houses for drug/alcohol abuse
- 207 people in wards in general hospitals for patients who have no usual home elsewhere
- 106 people in hospitals/wards and hospices for chronically ill
- 106 people in homes for the mentally retarded
- 80 people in other hospitals or wards for chronically ill
- 69 people in college dormitories (includes college quarters off campus)
- 68 people in homes for abused, dependent, and neglected children
- 67 people in orthopedic wards and institutions for the physically handicapped
- 26 people in hospices or homes for chronically ill
- 25 people in other group homes
- 21 people in residential treatment centers for emotionally disturbed children
- 15 people in training schools for juvenile delinquents
- 14 people in homes for the physically handicapped
Banks with most branches in Mesa (2011 data):
- JPMorgan Chase Bank, National Association: 24 branches. Info updated 2011/11/10: Bank assets: $1,811,678.0 mil, Deposits: $1,190,738.0 mil, headquarters in Columbus, OH, positive income, International Specialization, 5577 total offices, Holding Company: Jpmorgan Chase & Co.
- Wells Fargo Bank, National Association: 20 branches. Info updated 2011/04/05: Bank assets: $1,161,490.0 mil, Deposits: $905,653.0 mil, headquarters in Sioux Falls, SD, positive income, 6395 total offices, Holding Company: Wells Fargo & Company
- Bank of America, National Association: 13 branches. Info updated 2009/11/18: Bank assets: $1,451,969.3 mil, Deposits: $1,077,176.8 mil, headquarters in Charlotte, NC, positive income, 5782 total offices, Holding Company: Bank Of America Corporation
- Compass Bank: Fiesta Mall Branch, Signal Butte Branch, Stapley/University Kbc Branch, Power / Mcdowell Kbc Branch, Baseline/Ellsworth Kbc Branch, Greenfield & Main Branch. Info updated 2011/02/24: Bank assets: $63,107.0 mil, Deposits: $46,232.4 mil, headquarters in Birmingham, AL, negative income in the last year, Commercial Lending Specialization, 720 total offices, Holding Company: Banco Bilbao Vizcaya Argentaria, S.A.
- U.S. Bank National Association: North Power Road Safeway Branch, Downtown Mesa Branch, East University Safeway Branch, Baseline And Ellsworth Safeway Branc, East Southern Avenue Safeway Branch, West Main Street Safeway Branch. Info updated 2012/01/30: Bank assets: $330,470.8 mil, Deposits: $236,091.5 mil, headquarters in Cincinnati, OH, positive income, 3121 total offices, Holding Company: U.S. Bancorp
- BMO Harris Bank National Association: Mesa Branch, Greenfield Road Mesa Branch, Red Mountain Branch, Mesa-Crimson Branch. Info updated 2011/07/14: Bank assets: $97,264.0 mil, Deposits: $75,624.6 mil, headquarters in Chicago, IL, positive income, 717 total offices, Holding Company: Bank Of Montreal
- Comerica Bank: Mesa - Gateway Branch, Mesa-Val Vista Branch, Mesa - Riverview Branch. Info updated 2011/07/29: Bank assets: $60,970.5 mil, Deposits: $48,300.9 mil, headquarters in Dallas, TX, positive income, Commercial Lending Specialization, 497 total offices, Holding Company: Comerica Incorporated
- TCF National Bank: Highway 60th And Greenfield Branch, Signal Butte And Southern Branch, Stapley And Mckellips Branch. Info updated 2009/11/23: Bank assets: $19,007.0 mil, Deposits: $12,377.0 mil, headquarters in Sioux Falls, SD, positive income, Commercial Lending Specialization, 441 total offices, Holding Company: Tcf Financial Corporation
- National Bank of Arizona: East Mesa Branch, Gilbert And Southern Branch, Mesa Main Branch. Info updated 2008/09/11: Bank assets: $4,485.6 mil, Deposits: $3,731.3 mil, headquarters in Tucson, AZ, positive income, Commercial Lending Specialization, 73 total offices, Holding Company: Zions Bancorporation
- 13 other banks with 15 local branches
For population 15 years and over in Mesa:
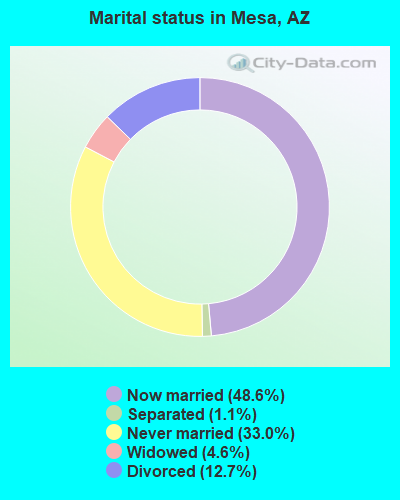
- Never married: 33.0%
- Now married: 48.6%
- Separated: 1.1%
- Widowed: 4.6%
- Divorced: 12.7%
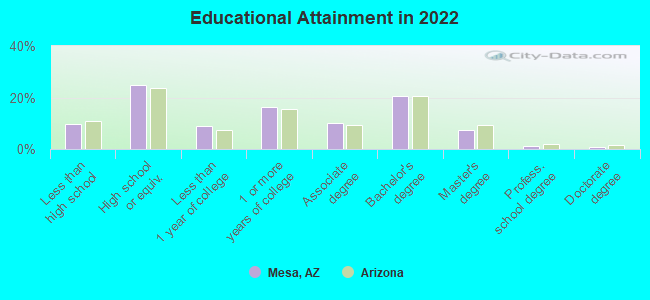
For population 25 years and over in Mesa:
- High school or higher: 90.2%
- Bachelor's degree or higher: 30.1%
- Graduate or professional degree: 9.4%
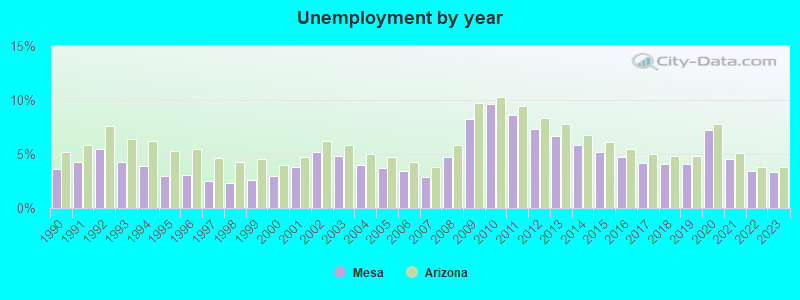
- Unemployed: 3.4%
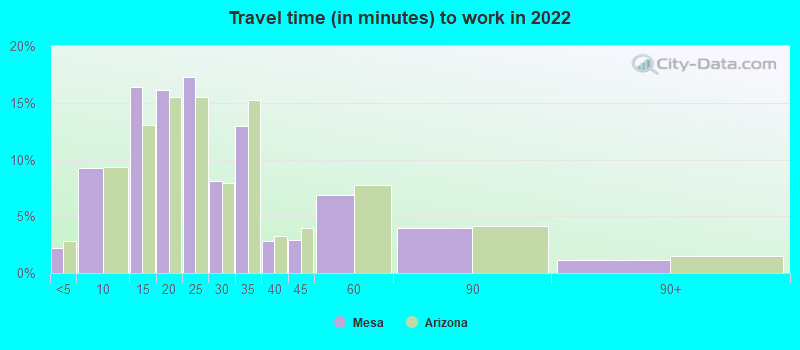
- Mean travel time to work (commute): 18.0 minutes
| Here: | 11.5 |
| Arizona average: | 12.2 |
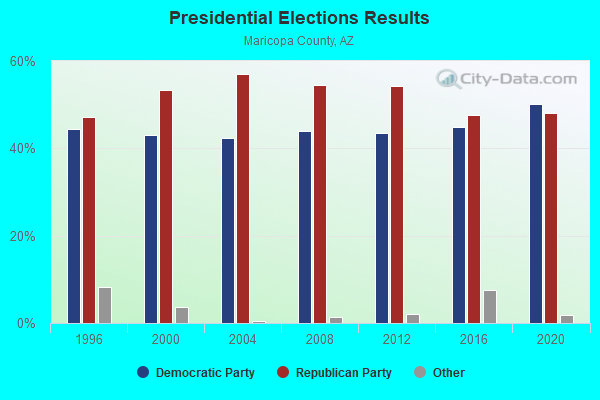
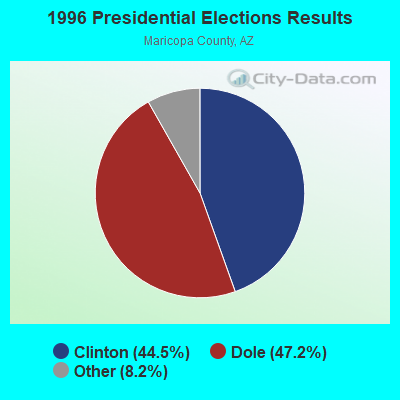
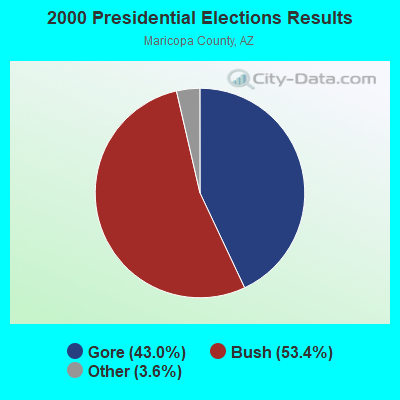
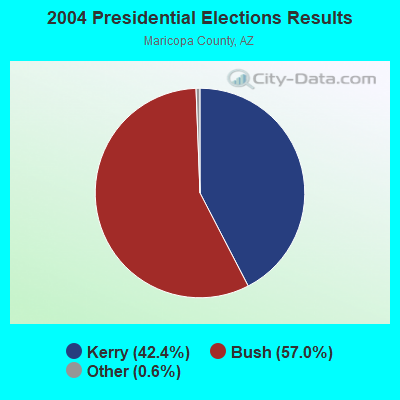
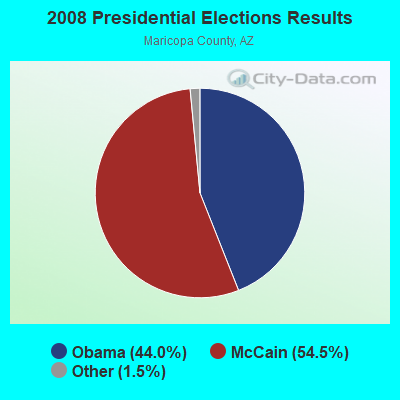
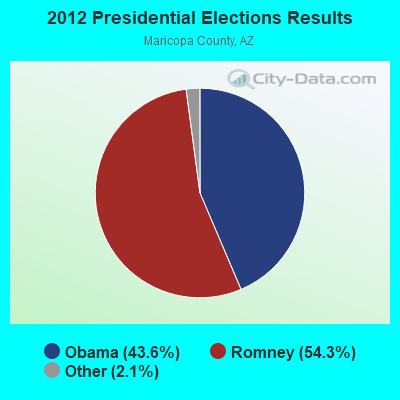
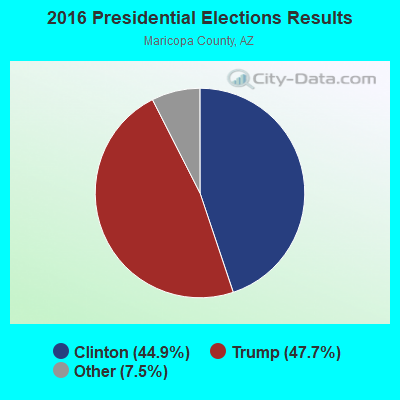
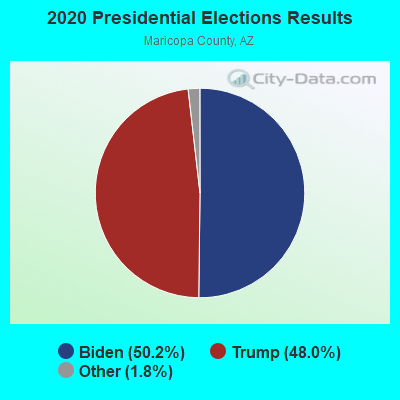
Graphs represent county-level data. Detailed 2008 Election Results
Neighborhoods in Mesa:
(Mesa, Arizona Neighborhood Map)- Alta Mesa neighborhood
- Apache Wells neighborhood
- Augusta Ranch neighborhood
- Boulder Mountain neighborhood
- C.A.N.D.O. neighborhood
- Crismon Creek neighborhood
- Dobson Ranch neighborhood
- Dobson Woods neighborhood
- Downtown (Downtown Mile-Square) neighborhood
- Glenwood-Wilbur neighborhood
- Heritage Park neighborhood
- Las Sendas neighborhood
- Lehi neighborhood
- Marlborough Mesa neighborhood
- Mesa Grande neighborhood
- North Center Street neighborhood
- Northeast (Citrus) neighborhood
- Northgrove neighborhood
- Parkwood Ranch neighborhood
- Rancho del Mar neighborhood
- Red Mountain Ranch neighborhood
- Ridgeview neighborhood
- Sierra Ranch neighborhood
- Sunland Village neighborhood
- Sunland Village East neighborhood
- Superstition Springs neighborhood
- The Groves neighborhood
Religion statistics for Mesa, AZ (based on Maricopa County data)
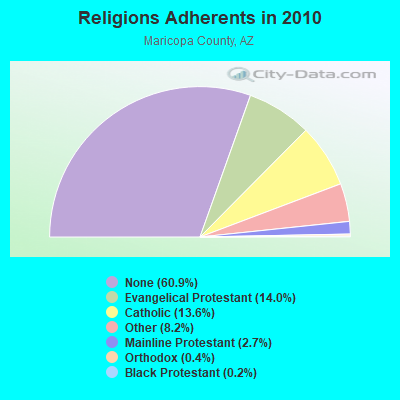
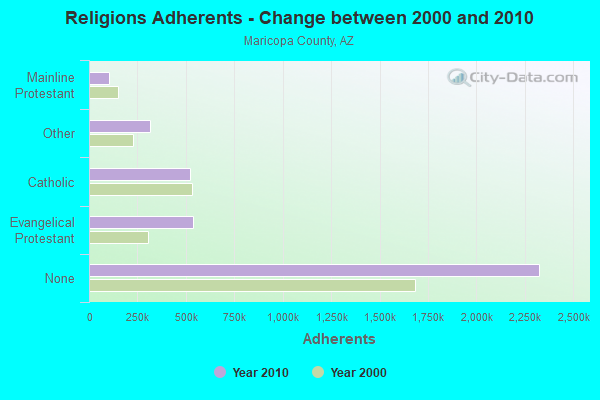
| Religion | Adherents | Congregations |
|---|---|---|
| Evangelical Protestant | 534,453 | 1,206 |
| Catholic | 520,651 | 100 |
| Other | 312,574 | 680 |
| Mainline Protestant | 104,145 | 241 |
| Orthodox | 13,379 | 24 |
| Black Protestant | 6,278 | 48 |
| None | 2,325,637 | - |
Food Environment Statistics:
| Maricopa County: | 1.30 / 10,000 pop. |
| State: | 1.36 / 10,000 pop. |
| Here: | 0.16 / 10,000 pop. |
| Arizona: | 0.14 / 10,000 pop. |
| This county: | 0.57 / 10,000 pop. |
| Arizona: | 0.55 / 10,000 pop. |
| This county: | 1.99 / 10,000 pop. |
| State: | 2.47 / 10,000 pop. |
| Maricopa County: | 5.86 / 10,000 pop. |
| Arizona: | 6.21 / 10,000 pop. |
| Maricopa County: | 7.7% |
| Arizona: | 8.0% |
| Maricopa County: | 22.5% |
| State: | 22.8% |
| Maricopa County: | 14.8% |
| Arizona: | 14.2% |
Health and Nutrition:
| Mesa: | 49.5% |
| State: | 49.0% |
| Mesa: | 48.0% |
| State: | 47.3% |
| This city: | 28.4 |
| Arizona: | 28.5 |
| This city: | 20.6% |
| Arizona: | 20.8% |
| This city: | 10.2% |
| Arizona: | 10.2% |
| Mesa: | 6.8 |
| State: | 6.8 |
| This city: | 32.9% |
| Arizona: | 33.5% |
| Mesa: | 56.9% |
| Arizona: | 56.1% |
| This city: | 79.6% |
| Arizona: | 79.4% |
More about Health and Nutrition of Mesa, AZ Residents
| Local government employment and payroll (March 2022) | |||||
| Function | Full-time employees | Monthly full-time payroll | Average yearly full-time wage | Part-time employees | Monthly part-time payroll |
|---|---|---|---|---|---|
| Police Protection - Officers | 848 | $7,087,605 | $100,296 | 0 | $0 |
| Firefighters | 466 | $4,033,056 | $103,856 | 0 | $0 |
| Police - Other | 459 | $2,626,395 | $68,664 | 20 | $48,307 |
| Financial Administration | 340 | $2,420,896 | $85,443 | 8 | $23,124 |
| Parks and Recreation | 278 | $1,484,030 | $64,059 | 291 | $237,349 |
| Streets and Highways | 236 | $1,703,027 | $86,595 | 0 | $0 |
| Fire - Other | 179 | $1,172,542 | $78,606 | 9 | $22,057 |
| Water Supply | 160 | $1,058,823 | $79,412 | 0 | $0 |
| Other and Unallocable | 154 | $948,330 | $73,896 | 0 | $0 |
| Solid Waste Management | 152 | $894,974 | $70,656 | 2 | $7,513 |
| Judicial and Legal | 140 | $943,047 | $80,833 | 3 | $8,735 |
| Other Government Administration | 110 | $889,512 | $97,038 | 10 | $31,879 |
| Sewerage | 93 | $569,820 | $73,525 | 0 | $0 |
| Gas Supply | 79 | $679,967 | $103,286 | 0 | $0 |
| Housing and Community Development (Local) | 73 | $466,599 | $76,701 | 0 | $0 |
| Welfare | 66 | $452,272 | $82,231 | 0 | $0 |
| Local Libraries | 64 | $315,263 | $59,112 | 26 | $36,317 |
| Electric Power | 42 | $379,905 | $108,544 | 0 | $0 |
| Airports | 14 | $86,399 | $74,056 | 0 | $0 |
| Transit | 3 | $24,847 | $99,388 | 0 | $0 |
| Totals for Government | 3,956 | $28,237,309 | $85,654 | 369 | $415,280 |
Mesa government finances - Expenditure in 2021 (per resident):
- Construction - Water Utilities: $107,484,000 ($209.73)
Sewerage: $28,061,000 ($54.75)
Parks and Recreation: $10,900,000 ($21.27)
Gas Utilities: $6,185,000 ($12.07)
Regular Highways: $3,469,000 ($6.77)
Electric Utilities: $2,484,000 ($4.85)
Solid Waste Management: $2,073,000 ($4.04)
Local Fire Protection: $1,396,000 ($2.72)
Police Protection: $847,000 ($1.65)
Transit Utilities: $176,000 ($0.34)
- Current Operations - Police Protection: $187,261,000 ($365.39)
Local Fire Protection: $88,911,000 ($173.49)
Financial Administration: $57,845,000 ($112.87)
Sewerage: $56,829,000 ($110.89)
Water Utilities: $49,529,000 ($96.64)
Regular Highways: $44,061,000 ($85.97)
Solid Waste Management: $40,783,000 ($79.58)
Parks and Recreation: $37,029,000 ($72.25)
Housing and Community Development: $34,896,000 ($68.09)
General - Other: $31,406,000 ($61.28)
Gas Utilities: $25,485,000 ($49.73)
Transit Utilities: $25,185,000 ($49.14)
Electric Utilities: $23,100,000 ($45.07)
Central Staff Services: $22,759,000 ($44.41)
Judicial and Legal Services: $17,112,000 ($33.39)
General Public Buildings: $14,223,000 ($27.75)
Protective Inspection and Regulation - Other: $8,557,000 ($16.70)
Libraries: $7,802,000 ($15.22)
Air Transportation: $1,722,000 ($3.36)
- Electric Utilities - Interest on Debt: $1,465,000 ($2.86)
- Gas Utilities - Interest on Debt: $4,422,000 ($8.63)
- General - Interest on Debt: $58,474,000 ($114.10)
- Other Capital Outlay - Solid Waste Management: $3,119,000 ($6.09)
General - Other: $3,044,000 ($5.94)
Financial Administration: $2,464,000 ($4.81)
Local Fire Protection: $1,052,000 ($2.05)
Water Utilities: $477,000 ($0.93)
Police Protection: $229,000 ($0.45)
Gas Utilities: $195,000 ($0.38)
Parks and Recreation: $119,000 ($0.23)
Electric Utilities: $93,000 ($0.18)
Sewerage: $56,000 ($0.11)
Central Staff Services: $27,000 ($0.05)
- Total Salaries and Wages: $216,213,000 ($421.88)
- Water Utilities - Interest on Debt: $25,969,000 ($50.67)
Mesa government finances - Revenue in 2021 (per resident):
- Charges - Sewerage: $101,025,000 ($197.12)
Solid Waste Management: $63,115,000 ($123.15)
Other: $50,508,000 ($98.55)
Parks and Recreation: $5,755,000 ($11.23)
Air Transportation: $4,836,000 ($9.44)
Regular Highways: $488,000 ($0.95)
Miscellaneous Commercial Activities: $115,000 ($0.22)
- Federal Intergovernmental - Housing and Community Development: $32,498,000 ($63.41)
Other: $5,775,000 ($11.27)
- Local Intergovernmental - Other: $13,322,000 ($25.99)
Highways: $11,355,000 ($22.16)
- Miscellaneous - Fines and Forfeits: $10,062,000 ($19.63)
Rents: $6,075,000 ($11.85)
Interest Earnings: $3,475,000 ($6.78)
Special Assessments: $1,132,000 ($2.21)
Donations From Private Sources: $175,000 ($0.34)
- Revenue - Water Utilities: $157,910,000 ($308.12)
Gas Utilities: $41,960,000 ($81.87)
Electric Utilities: $33,444,000 ($65.26)
- State Intergovernmental - General Local Government Support: $149,986,000 ($292.66)
Highways: $43,200,000 ($84.29)
Other: $6,122,000 ($11.95)
- Tax - General Sales and Gross Receipts: $207,449,000 ($404.78)
Property: $43,714,000 ($85.30)
Other License: $14,162,000 ($27.63)
Occupation and Business License - Other: $6,567,000 ($12.81)
Other Selective Sales: $4,690,000 ($9.15)
Amusements License: $4,389,000 ($8.56)
Alcoholic Beverage License: $584,000 ($1.14)
Mesa government finances - Debt in 2021 (per resident):
- Long Term Debt - Beginning Outstanding - Unspecified Public Purpose: $1,497,275,000 ($2921.52)
Outstanding Unspecified Public Purpose: $1,370,769,000 ($2674.68)
Retired Unspecified Public Purpose: $126,506,000 ($246.84)
Mesa government finances - Cash and Securities in 2021 (per resident):
- Bond Funds - Cash and Securities: $162,321,000 ($316.73)
- Other Funds - Cash and Securities: $600,586,000 ($1171.88)
- Sinking Funds - Cash and Securities: $129,842,000 ($253.35)
5.80% of this county's 2021 resident taxpayers lived in other counties in 2020 ($92,013 average adjusted gross income)
| Here: | 5.80% |
| Arizona average: | 6.85% |
0.02% of residents moved from foreign countries ($227 average AGI)
Maricopa County: 0.02% Arizona average: 0.03%
Top counties from which taxpayers relocated into this county between 2020 and 2021:
| from Pinal County, AZ | |
| from Los Angeles County, CA | |
| from Pima County, AZ |
5.04% of this county's 2020 resident taxpayers moved to other counties in 2021 ($76,911 average adjusted gross income)
| Here: | 5.04% |
| Arizona average: | 5.72% |
0.02% of residents moved to foreign countries ($234 average AGI)
Maricopa County: 0.02% Arizona average: 0.03%
Top counties to which taxpayers relocated from this county between 2020 and 2021:
| to Pinal County, AZ | |
| to Pima County, AZ | |
| to Yavapai County, AZ |
| Businesses in Mesa, AZ | ||||
| Name | Count | Name | Count | |
|---|---|---|---|---|
| 24 Hour Fitness | 2 | JoS. A. Bank | 1 | |
| 7-Eleven | 8 | Jones New York | 7 | |
| 99 Cents Only Stores | 3 | Journeys | 2 | |
| AMF Bowling | 1 | Justice | 1 | |
| AT&T | 9 | KFC | 7 | |
| Ace Hardware | 3 | Kincaid | 2 | |
| Aeropostale | 2 | Kmart | 2 | |
| Albertsons | 5 | Knights Inn | 1 | |
| American Eagle Outfitters | 2 | Kohl's | 2 | |
| Ann Taylor | 1 | Kroger | 10 | |
| Applebee's | 4 | LA Fitness | 2 | |
| Arby's | 8 | La Quinta | 2 | |
| Ashley Furniture | 1 | La-Z-Boy | 1 | |
| AutoZone | 14 | Lane Bryant | 2 | |
| Avenue | 1 | Lane Furniture | 11 | |
| Baja Fresh Mexican Grill | 1 | LensCrafters | 2 | |
| Bally Total Fitness | 1 | Little Caesars Pizza | 10 | |
| Barnes & Noble | 1 | Long John Silver's | 2 | |
| Baskin-Robbins | 2 | Lowe's | 2 | |
| Bath & Body Works | 5 | Macy's | 2 | |
| Bed Bath & Beyond | 4 | Marriott | 3 | |
| Best Western | 4 | Marshalls | 1 | |
| Big O Tires | 3 | MasterBrand Cabinets | 5 | |
| Blockbuster | 10 | Mazda | 1 | |
| Brunswick Bowling & Billiards | 1 | McDonald's | 23 | |
| Budget Car Rental | 3 | Men's Wearhouse | 2 | |
| Buffalo Wild Wings | 2 | Motel 6 | 2 | |
| Burger King | 6 | Motherhood Maternity | 3 | |
| Burlington Coat Factory | 1 | New Balance | 5 | |
| CVS | 12 | Nike | 34 | |
| Carl\s Jr. | 7 | Nissan | 2 | |
| Casual Male XL | 1 | OfficeMax | 4 | |
| Catherines | 2 | Old Country Buffet | 2 | |
| Charlotte Russe | 2 | Olive Garden | 2 | |
| Chevrolet | 2 | On The Border | 1 | |
| Chick-Fil-A | 4 | Outback | 2 | |
| Chico's | 1 | Outback Steakhouse | 2 | |
| Chipotle | 2 | Pac Sun | 2 | |
| Chuck E. Cheese's | 2 | Panda Express | 12 | |
| Church's Chicken | 1 | Papa John's Pizza | 4 | |
| Cinnabon | 2 | Payless | 10 | |
| Circle K | 43 | Penske | 2 | |
| Clarion | 1 | PetSmart | 5 | |
| Cold Stone Creamery | 4 | Pier 1 Imports | 2 | |
| Coldwater Creek | 1 | Pizza Hut | 10 | |
| Comfort Inn | 1 | Popeyes | 1 | |
| Costco | 1 | Qdoba Mexican Grill | 1 | |
| Cracker Barrel | 1 | Quality | 1 | |
| Cricket Wireless | 22 | Quiznos | 4 | |
| Curves | 3 | RadioShack | 6 | |
| Dairy Queen | 8 | Red Lobster | 2 | |
| Days Hotel | 1 | Red Robin | 2 | |
| Days Inn | 3 | Ruby Tuesday | 1 | |
| Deb | 1 | Rue21 | 1 | |
| Dennys | 3 | SAS Shoes | 1 | |
| Discount Tire | 8 | SONIC Drive-In | 11 | |
| Domino's Pizza | 6 | Safeway | 4 | |
| DressBarn | 1 | Sears | 8 | |
| Dressbarn | 1 | Sleep Inn | 1 | |
| Dunkin Donuts | 3 | Spencer Gifts | 2 | |
| El Pollo Loco | 3 | Sprint Nextel | 5 | |
| Express | 2 | Staples | 4 | |
| Extended Stay America | 1 | Starbucks | 25 | |
| Famous Footwear | 5 | Subway | 26 | |
| Fashion Bug | 1 | Super 8 | 2 | |
| FedEx | 39 | T-Mobile | 24 | |
| Finish Line | 2 | T.G.I. Driday's | 1 | |
| Firestone Complete Auto Care | 3 | Taco Bell | 10 | |
| Foot Locker | 2 | Talbots | 1 | |
| Ford | 1 | Target | 5 | |
| Forever 21 | 1 | The Cheesecake Factory | 1 | |
| GNC | 5 | The Room Place | 2 | |
| GameStop | 9 | Torrid | 2 | |
| Gap | 1 | Toyota | 2 | |
| Gymboree | 1 | Toys"R"Us | 3 | |
| H&R Block | 23 | Trader Joe's | 1 | |
| Hilton | 3 | Travelodge | 1 | |
| Hobby Lobby | 2 | True Value | 1 | |
| Holiday Inn | 1 | U-Haul | 20 | |
| Hollister Co. | 2 | UPS | 41 | |
| Home Depot | 6 | Vans | 13 | |
| Homestead Studio Suites | 1 | Verizon Wireless | 9 | |
| Honda | 1 | Victoria's Secret | 2 | |
| Hot Topic | 2 | Village Inn | 4 | |
| Howard Johnson | 1 | Vons | 6 | |
| IHOP | 4 | Waffle House | 2 | |
| IZOD | 1 | Walgreens | 13 | |
| J. Jill | 1 | Walmart | 13 | |
| JCPenney | 2 | Wendy's | 8 | |
| Jack In The Box | 15 | Wet Seal | 2 | |
| Jamba Juice | 4 | YMCA | 2 | |
| Jimmy John's | 2 | Z Gallerie | 1 | |
Strongest AM radio stations in Mesa:
- KMIK (1580 AM; 50 kW; TEMPE, AZ; Owner: ABC, INC.)
- KXAM (1310 AM; 5 kW; MESA, AZ; Owner: EMBEE BROADCASTING, INC.)
- KFNX (1100 AM; 50 kW; CAVE CREEK, AZ; Owner: NORTH AMERICAN BROADCASTING CO., INC.)
- KPXQ (1360 AM; 50 kW; GLENDALE, AZ; Owner: COMMON GROUND BROADCASTING, INC.)
- KFYI (550 AM; 5 kW; PHOENIX, AZ; Owner: AMFM RADIO LICENSES, L.L.C.)
- KTAR (620 AM; 5 kW; PHOENIX, AZ; Owner: EMMIS RADIO LICENSE CORPORATION)
- KDUS (1060 AM; 5 kW; TEMPE, AZ; Owner: TEMPE RADIO, INC.)
- KMIA (710 AM; 50 kW; BLACK CANYON CITY, AZ; Owner: ENTRAVISION HOLDINGS, LLC)
- KFNN (1510 AM; 22 kW; MESA, AZ; Owner: CRC BROADCASTING COMPANY, INC.)
- KAZG (1440 AM; 5 kW; SCOTTSDALE, AZ; Owner: CACTUS RADIO, INC.)
- KXEM (1010 AM; 15 kW; TOLLESON, AZ; Owner: JAMES CRYSTAL ENTERPRISES OF PHOENIX, INC.)
- KASA (1540 AM; 10 kW; PHOENIX, AZ; Owner: KASA RADIO HOGAR, INC.)
- KGME (910 AM; 5 kW; PHOENIX, AZ; Owner: AMFM RADIO LICENSES, L.L.C.)
Strongest FM radio stations in Mesa:
- KLVK (89.1 FM; FOUNTAIN HILLS, AZ; Owner: EDUCATIONAL MEDIA FOUNDATION)
- K210CP (89.9 FM; MESA, AZ; Owner: CALVARY CHAPEL OF TWIN FALLS, INC.)
- K220HH (91.9 FM; MESA, AZ; Owner: CALVARY CHAPEL OF TWIN FALLS, INC.)
- K206BL (89.1 FM; DREAMLAND, AZ; Owner: AMERICAN FAMILY ASSOCIATION)
- KSLX-FM (100.7 FM; SCOTTSDALE, AZ; Owner: CACTUS RADIO, INC.)
- KKLT (98.7 FM; PHOENIX, AZ; Owner: EMMIS RADIO LICENSE CORPORATION)
- KZON (101.5 FM; PHOENIX, AZ; Owner: INFINITY RADIO OPERATIONS INC.)
- KKFR (92.3 FM; GLENDALE, AZ; Owner: EMMIS RADIO LICENSE CORPORATION)
- KESZ (99.9 FM; PHOENIX, AZ; Owner: CLEAR CHANNEL BROADCASTING LICENSES, INC.)
- KOOL-FM (94.5 FM; PHOENIX, AZ; Owner: INFINITY RADIO OPERATIONS INC.)
- KNIX-FM (102.5 FM; PHOENIX, AZ; Owner: CLEAR CHANNEL BROADCASTING LICENSES, INC.)
- KUPD (97.9 FM; TEMPE, AZ; Owner: TEMPE RADIO, INC.)
- KFLR-FM (90.3 FM; PHOENIX, AZ; Owner: FAMILY LIFE BROADCASTING, INC.)
- KJZZ (91.5 FM; PHOENIX, AZ; Owner: MARICOPA COUNTY COMM. COLLEGE DIST.)
- KYOT-FM (95.5 FM; PHOENIX, AZ; Owner: AMFM RADIO LICENSES, L.L.C.)
- KEDJ (103.9 FM; GILBERT, AZ; Owner: NPR PHOENIX, LLC)
- KMXP (96.9 FM; PHOENIX, AZ; Owner: CITICASTERS LICENSES, L.P.)
- KZZP (104.7 FM; MESA, AZ; Owner: CITICASTERS LICENSES, L.P.)
- KDKB (93.3 FM; MESA, AZ; Owner: MESA RADIO, INC.)
- K240CV (95.9 FM; PHOENIX, AZ; Owner: ZORBA RESOURCES, INC.)
TV broadcast stations around Mesa:
- KAET (Channel 8; PHOENIX, AZ; Owner: ARIZONA BOARD OF REGENTS)
- K57HX (Channel 57; MESA, AZ; Owner: KAZT, L.L.C.)
- KPHO-TV (Channel 5; PHOENIX, AZ; Owner: MEREDITH CORPORATION)
- KCOS-LP (Channel 28; PHOENIX, AZ; Owner: ARACELIS ORTIZ, EXECUTRIX OF THE ESTATE OF CARLOS ORTIZ)
- KTVK (Channel 3; PHOENIX, AZ; Owner: KTVK, INC.)
- KPPX (Channel 51; TOLLESON, AZ; Owner: AMERICA 51, L.P.)
- KPHE-LP (Channel 19; PHOENIX, AZ; Owner: U.S. INTERACTIVE, L.L.C.)
- KUTP (Channel 45; PHOENIX, AZ; Owner: FOX TELEVISION STATIONS, INC.)
- KPNX (Channel 12; MESA, AZ; Owner: MULTIMEDIA HOLDINGS CORPORATION)
- KSAZ-TV (Channel 10; PHOENIX, AZ; Owner: KSAZ LICENSE, INC.)
- KASW (Channel 61; PHOENIX, AZ; Owner: KASW-TV, INC.)
- K42FD (Channel 42; PHOENIX, AZ; Owner: KDMA CHANNEL 25, INC.)
- KNXV-TV (Channel 15; PHOENIX, AZ; Owner: SCRIPPS HOWARD BROADCASTING COMPANY)
- KTVW-TV (Channel 33; PHOENIX, AZ; Owner: KTVW LICENSE PARTNERSHIP, G.P.)
- K53GF (Channel 53; PHOENIX, AZ; Owner: SPANISH INDEPENDENT BROADCAST NETWORK, LLC)
- K55EH (Channel 55; PHOENIX, AZ; Owner: KAZT, L.L.C.)
- KDRX-CA (Channel 48; PHOENIX, AZ; Owner: NBC TELEMUNDO PHOENIX, INC.)
- KFPH-CA (Channel 39; PHOENIX, AZ; Owner: TELEFUTURA PARTNERSHIP OF PHOENIX)
- National Bridge Inventory (NBI) Statistics
- 358Number of bridges
- 5,266ft / 1,605mTotal length
- $156,000Total costs
- 16,469,060Total average daily traffic
- 1,063,193Total average daily truck traffic
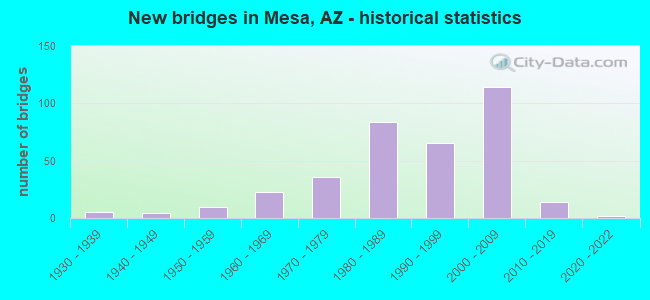
- New bridges - historical statistics
- 11920-1929
- 51930-1939
- 41940-1949
- 101950-1959
- 231960-1969
- 361970-1979
- 841980-1989
- 651990-1999
- 1142000-2009
- 142010-2019
- 22020-2022
FCC Registered Antenna Towers: 945 (See the full list of FCC Registered Antenna Towers)
FCC Registered Commercial Land Mobile Towers: 6 (See the full list of FCC Registered Commercial Land Mobile Towers in Mesa, AZ)
FCC Registered Private Land Mobile Towers: 8 (See the full list of FCC Registered Private Land Mobile Towers)
FCC Registered Broadcast Land Mobile Towers: 213 (See the full list of FCC Registered Broadcast Land Mobile Towers)
FCC Registered Microwave Towers: 338 (See the full list of FCC Registered Microwave Towers in this town)
FCC Registered Paging Towers: 22 (See the full list of FCC Registered Paging Towers)
FCC Registered Maritime Coast & Aviation Ground Towers: 32 (See the full list of FCC Registered Maritime Coast & Aviation Ground Towers)
FCC Registered Amateur Radio Licenses: 3,596 (See the full list of FCC Registered Amateur Radio Licenses in Mesa)
FAA Registered Aircraft Manufacturers and Dealers: 20 (See the full list of FAA Registered Manufacturers and Dealers in Mesa)
FAA Registered Aircraft: 828 (See the full list of FAA Registered Aircraft)
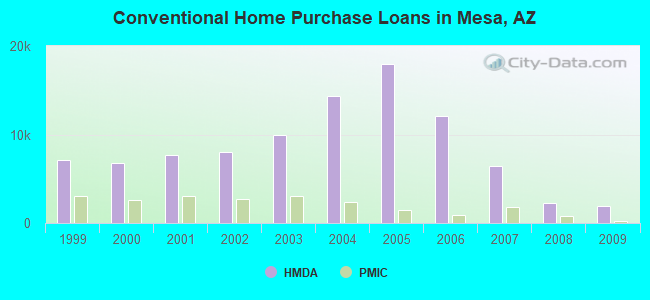
| Home Mortgage Disclosure Act Aggregated Statistics For Year 2009 (Based on 83 full and 9 partial tracts) | ||||||||||||||
| A) FHA, FSA/RHS & VA Home Purchase Loans | B) Conventional Home Purchase Loans | C) Refinancings | D) Home Improvement Loans | E) Loans on Dwellings For 5+ Families | F) Non-occupant Loans on < 5 Family Dwellings (A B C & D) | G) Loans On Manufactured Home Dwelling (A B C & D) | ||||||||
|---|---|---|---|---|---|---|---|---|---|---|---|---|---|---|
| Number | Average Value | Number | Average Value | Number | Average Value | Number | Average Value | Number | Average Value | Number | Average Value | Number | Average Value | |
| LOANS ORIGINATED | 2,796 | $138,016 | 1,874 | $139,753 | 5,303 | $173,538 | 138 | $103,340 | 5 | $9,507,688 | 1,044 | $117,199 | 211 | $85,649 |
| APPLICATIONS APPROVED, NOT ACCEPTED | 161 | $145,775 | 184 | $141,308 | 733 | $168,290 | 59 | $51,865 | 0 | $0 | 93 | $116,805 | 64 | $66,864 |
| APPLICATIONS DENIED | 478 | $136,712 | 440 | $146,644 | 2,388 | $183,502 | 195 | $53,987 | 0 | $0 | 359 | $121,476 | 118 | $65,626 |
| APPLICATIONS WITHDRAWN | 339 | $137,589 | 235 | $163,610 | 1,209 | $178,778 | 52 | $92,063 | 0 | $0 | 170 | $131,358 | 38 | $107,305 |
| FILES CLOSED FOR INCOMPLETENESS | 66 | $148,645 | 67 | $142,121 | 336 | $182,591 | 37 | $86,151 | 0 | $0 | 38 | $101,094 | 19 | $60,629 |
Detailed mortgage data for all 92 tracts in Mesa, AZ
| Private Mortgage Insurance Companies Aggregated Statistics For Year 2009 (Based on 79 full and 8 partial tracts) | ||||||
| A) Conventional Home Purchase Loans | B) Refinancings | C) Non-occupant Loans on < 5 Family Dwellings (A & B) | ||||
|---|---|---|---|---|---|---|
| Number | Average Value | Number | Average Value | Number | Average Value | |
| LOANS ORIGINATED | 223 | $163,951 | 70 | $176,444 | 11 | $130,448 |
| APPLICATIONS APPROVED, NOT ACCEPTED | 70 | $177,910 | 65 | $211,262 | 5 | $144,692 |
| APPLICATIONS DENIED | 46 | $159,221 | 26 | $207,942 | 5 | $101,512 |
| APPLICATIONS WITHDRAWN | 9 | $189,698 | 7 | $200,754 | 0 | $0 |
| FILES CLOSED FOR INCOMPLETENESS | 11 | $165,560 | 4 | $185,160 | 3 | $161,273 |

2005 - 2018 National Fire Incident Reporting System (NFIRS) incidents
- Fire incident types reported to NFIRS in Mesa, AZ
- 7,37743.4%Outside Fires
- 6,18736.4%Structure Fires
- 2,83416.7%Mobile Property/Vehicle Fires
- 5873.5%Other
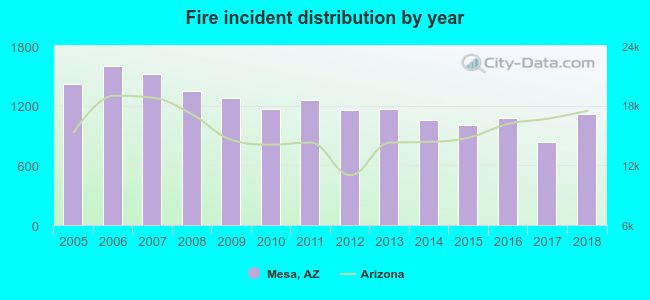 According to the data from the years 2005 - 2018 the average number of fire incidents per year is 1213. The highest number of fire incidents - 1,596 took place in 2006, and the least - 834 in 2017. The data has a declining trend.
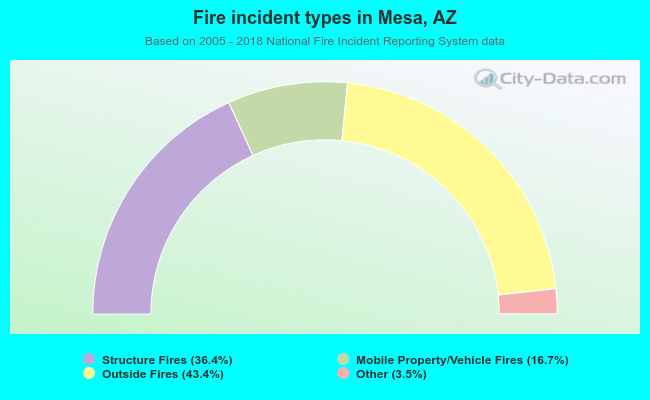 When looking into fire subcategories, the most incidents belonged to: Outside Fires (43.4%), and Structure Fires (36.4%).
Fire-safe hotels and motels in Mesa, Arizona:
- Phoenix Marriott Mesa, 200 N Centennial Way, Mesa, Arizona 85201 , Phone: (480) 898-8300, Fax: (480) 964-9279
- Courtyard By Marriott-Phoenix Mesa, 1221 S Westwood Ave, Mesa, Arizona 85210 , Phone: (480) 461-3000, Fax: (480) 461-0179
- Quality Inn & Suites, 1410 S Country Club Dr, Mesa, Arizona 85210 , Phone: (480) 964-2897, Fax: (480) 833-0536
- Arizona Golf Resort, 425 S Power Rd, Mesa, Arizona 85206 , Phone: (480) 832-3202, Fax: (480) 981-0151
- Best Western Plus Mesa, 1563 S Gilbert Rd, Mesa, Arizona 85204 , Phone: (480) 926-3600, Fax: (480) 926-4892
- Hilton Phoenix East/Mesa, 1011 W Homes Ave, Mesa, Arizona 85210 , Phone: (480) 833-5555, Fax: (480) 649-1886
- Holiday Inn Hotel & Suites, 1600 S Country CLB Dr, Mesa, Arizona 85210 , Phone: (800) 917-2010, Fax: (480) 833-6419
- Motel 6 No 378, 336 W Hampton, Mesa, Arizona 85210 , Phone: (480) 844-8899, Fax: (480) 969-6749
- 25 other hotels and motels
| Most common first names in Mesa, AZ among deceased individuals | ||
| Name | Count | Lived (average) |
|---|---|---|
| John | 1,901 | 76.1 years |
| Robert | 1,672 | 72.7 years |
| William | 1,612 | 75.5 years |
| Mary | 1,360 | 79.2 years |
| James | 1,252 | 74.0 years |
| Charles | 969 | 75.7 years |
| George | 870 | 76.8 years |
| Helen | 830 | 81.0 years |
| Dorothy | 755 | 78.9 years |
| Joseph | 718 | 76.8 years |
| Most common last names in Mesa, AZ among deceased individuals | ||
| Last name | Count | Lived (average) |
|---|---|---|
| Smith | 692 | 76.3 years |
| Johnson | 640 | 77.7 years |
| Miller | 392 | 77.8 years |
| Jones | 336 | 75.3 years |
| Brown | 334 | 77.7 years |
| Anderson | 309 | 78.4 years |
| Williams | 274 | 76.3 years |
| Davis | 262 | 75.4 years |
| Nelson | 246 | 80.2 years |
| Wilson | 235 | 75.7 years |
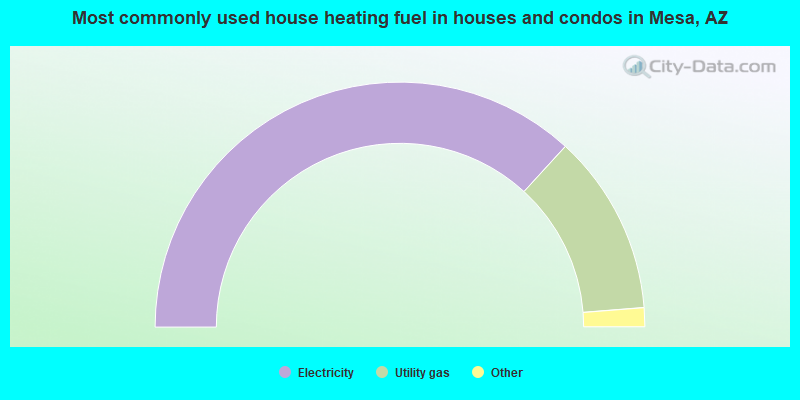
- 73.6%Electricity
- 23.9%Utility gas
- 1.0%Bottled, tank, or LP gas
- 0.6%No fuel used
- 0.4%Solar energy
- 0.3%Wood
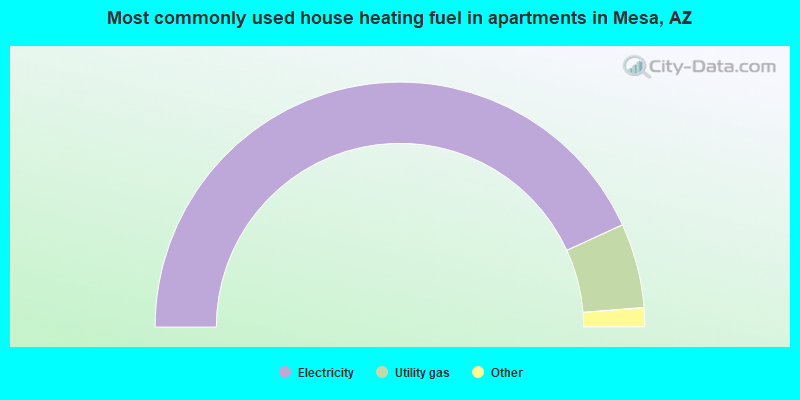
- 86.3%Electricity
- 11.2%Utility gas
- 1.2%No fuel used
- 0.8%Bottled, tank, or LP gas
- 0.2%Fuel oil, kerosene, etc.
- 0.1%Other fuel
Mesa compared to Arizona state average:
- Unemployed percentage significantly below state average.
- Length of stay since moving in below state average.
Mesa, AZ compared to other similar cities:
Mesa on our top lists:
- #11 on the list of "Top 101 cities with the highest average sunshine amount (population 50,000+)"
- #12 on the list of "Top 101 cities with the highest number of days clear of clouds (population 50,000+)"
- #12 on the list of "Top 101 cities with the lowest number of days clear of clouds (population 50,000+)"
- #12 on the list of "Top 101 cities with the highest daily high temperatures (population 50,000+)"
- #14 on the list of "Top 101 cities with the hottest summers (population 50,000+)"
- #15 on the list of "Top 101 cities with the largest city-data.com crime index decrease from 2002 to 2012 (population 50,000+)"
- #16 on the list of "Top 101 cities with the lowest maximum monthly morning or afternoon humidity (population 50,000+)"
- #20 on the list of "Top 101 cities with the lowest minimum monthly morning or afternoon humidity (population 50,000+)"
- #21 on the list of "Top 101 cities with the lowest average humidity (population 50,000+)"
- #41 on the list of "Top 101 cities with the lowest average wind speeds (population 50,000+)"
- #45 on the list of "Top 101 cities with the lowest average yearly precipitation (population 50,000+)"
- #47 on the list of "Top 100 biggest cities"
- #48 on the list of "Top 101 biggest cities in 2013"
- #58 on the list of "Top 101 cities with the smallest precipitation differences during a year (population 50,000+)"
- #58 on the list of "Top 101 cities with the largest differences between daily high and daily low temperatures (population 50,000+)"
- #61 on the list of "Top 101 cities with the smallest percentage of elementary and middle school students in private schools (5,000+ students)"
- #62 on the list of "Top 101 cities with largest percentage of females in occupations: farming, fishing, and forestry occupations (population 50,000+)"
- #66 on the list of "Top 101 cities with the smallest percentage of high school students in private schools (3,000+ students)"
- #76 on the list of "Top 101 cities with the most people born in other U.S. states (population 50,000+)"
- #92 on the list of "Top 101 cities with the highest maximum monthly sunshine amount (population 50,000+)"
- #47 (85281) on the list of "Top 101 zip codes with the most Internet business establishments in 2005"
- #2 on the list of "Top 101 counties with the highest Nitrogen Dioxide air pollution readings in 2012 (ppm)"
- #3 on the list of "Top 101 counties with the highest total withdrawal of fresh water for public supply"
- #3 on the list of "Top 101 counties with the highest surface withdrawal of fresh water for public supply"
- #4 on the list of "Top 101 counties with the most Other congregations"
- #5 on the list of "Top 101 counties with the most Evangelical Protestant adherents (pop. 50,000+)"

|
|
Total of 2998 patent applications in 2008-2024.