Estimated zip code population in 2022: 39,197 Zip code population in 2010: 35,541 Zip code population in 2000: 36,996
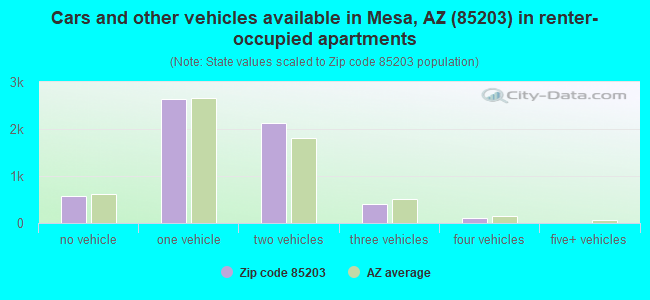
Houses and condos: 14,415 Renter-occupied apartments: 5,852
% of renters here:
43%
State:
33%
March 2022 cost of living index in zip code 85203: 101.2 (near average, U.S. average is 100)
Land area: 9.2 sq. mi. Water area: 0.5 sq. mi.
Population density: 4,279 people per square mile
(average).
OSM Map
General Map
Google Map
MSN Map
OSM Map
General Map
Google Map
MSN Map
OSM Map
General Map
Google Map
MSN Map
OSM Map
General Map
Google Map
MSN Map
Please wait while loading the map...
Real estate property taxes paid for housing units in 2022:
This zip code:
0.3% ($1,539)
Arizona:
0.4% ($1,786)
Median real estate property taxes paid for housing units with mortgages in 2022: $1,576 (0.3%) Median real estate property taxes paid for housing units with no mortgage in 2022: $1,462 (0.3%)
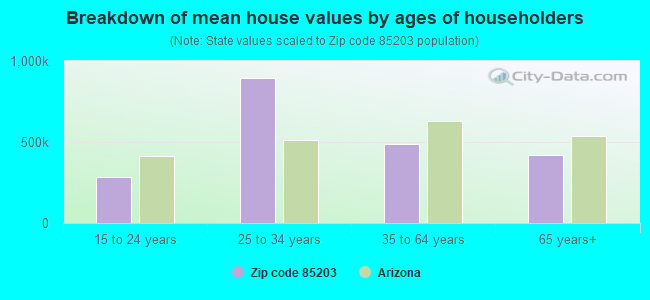
Estimated median house/condo value in 2022: $450,675
85203:
$450,675
Arizona:
$402,800
According to our research of Arizona and other state lists, there were 58 registered sex offenders living in 85203 zip code as of April 27, 2024. The ratio of all residents to sex offenders in zip code 85203 is 645 to 1. The ratio of registered sex offenders to all residents in this zip code is near the state average.
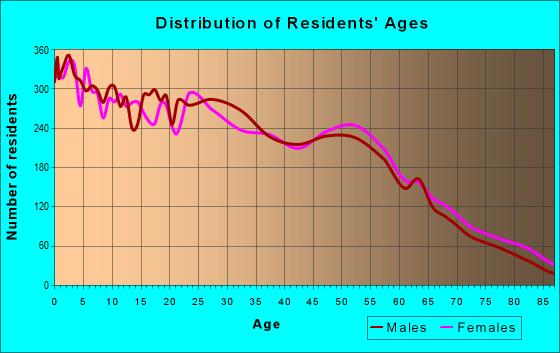
Median resident age:
This zip code:
32.6 years
Arizona median age:
38.8 years
Average household size:
This zip code:
2.9 people
Arizona:
2.5 people
Averages for the 2020 tax year for zip code 85203, filed in 2021:
Average Adjusted Gross Income (AGI) in 2020: $58,954 (Individual Income Tax Returns)
Here:
$58,954
State:
$73,499
Salary/wage: $50,151 (reported on 83.2% of returns)
Here:
$50,151
State:
$59,499
(% of AGI for various income ranges: 1197.1% for AGIs below $25k, 3966.9% for AGIs $25k-50k, 7187.8% for AGIs $50k-75k, 10443.1% for AGIs $75k-100k, 19162.8% for AGIs $100k-200k, 60599.4% for AGIs over 200k)
Taxable interest for individuals: $1,485 (reported on 20.1% of returns)
This zip code:
$1,485
Arizona:
$2,325
(% of AGI for various income ranges: 7.8% for AGIs below $25k, 8.8% for AGIs $25k-50k, 33.6% for AGIs $50k-75k, 48.8% for AGIs $75k-100k, 128.5% for AGIs $100k-200k, 1222.4% for AGIs over 200k)
Ordinary dividends: $5,636 (reported on 11.9% of returns)
Here:
$5,636
State:
$8,711
(% of AGI for various income ranges: 11.8% for AGIs below $25k, 16.6% for AGIs $25k-50k, 71.7% for AGIs $50k-75k, 109.0% for AGIs $75k-100k, 242.0% for AGIs $100k-200k, 3245.9% for AGIs over 200k)
Net capital gain/loss in AGI: +$17,343 (reported on 12.3% of returns)
Here:
+$17,343
State:
+$31,332
(% of AGI for various income ranges: 3.2% for AGIs below $25k, 13.6% for AGIs $25k-50k, 73.3% for AGIs $50k-75k, 184.3% for AGIs $75k-100k, 608.4% for AGIs $100k-200k, 15203.5% for AGIs over 200k)
Profit/loss from business: +$11,177 (reported on 18.3% of returns)
Here:
+$11,177
State:
+$13,214
(% of AGI for various income ranges: 176.4% for AGIs below $25k, 180.0% for AGIs $25k-50k, 253.9% for AGIs $50k-75k, 317.7% for AGIs $75k-100k, 758.3% for AGIs $100k-200k, 3194.7% for AGIs over 200k)
Taxable individual retirement arrangement distribution: $18,841 (reported on 5.8% of returns)
85203:
$18,841
Arizona:
$23,364
(% of AGI for various income ranges: 33.3% for AGIs below $25k, 52.6% for AGIs $25k-50k, 122.0% for AGIs $50k-75k, 294.5% for AGIs $75k-100k, 749.0% for AGIs $100k-200k, 1728.8% for AGIs over 200k)
Self-employed (Keogh) retirement plans: $21,875 (reported on 0.2% of returns)
85203:
$21,875
Arizona:
$26,938
(% of AGI for various income ranges: 91.1% for AGIs $100k-200k)
Total itemized deductions: $35,885 (reported on 8.0% of returns)
Here:
$35,885
State:
$36,308
(% of AGI for various income ranges: 41.6% for AGIs below $25k, 77.1% for AGIs $25k-50k, 230.2% for AGIs $50k-75k, 575.7% for AGIs $75k-100k, 1564.4% for AGIs $100k-200k, 11109.4% for AGIs over 200k)
Charity contributions: $17,126 (reported on 6.9% of returns)
Here:
$17,126
State:
$11,955
(% of AGI for various income ranges: 5.1% for AGIs below $25k, 17.1% for AGIs $25k-50k, 49.2% for AGIs $50k-75k, 175.1% for AGIs $75k-100k, 570.8% for AGIs $100k-200k, 6329.4% for AGIs over 200k)
Taxes paid: $6,247 (reported on 8.0% of returns)
85203:
$6,247
State:
$6,820
(% of AGI for various income ranges: 5.9% for AGIs below $25k, 10.1% for AGIs $25k-50k, 37.6% for AGIs $50k-75k, 107.4% for AGIs $75k-100k, 333.4% for AGIs $100k-200k, 1680.6% for AGIs over 200k)
Earned income credit: $2,374 (reported on 19.1% of returns)
Here:
$2,374
State:
$2,383
(% of AGI for various income ranges: 107.7% for AGIs below $25k, 75.3% for AGIs $25k-50k, 2.6% for AGIs $50k-75k)
Percentage of individuals using paid preparers for their 2020 taxes: 91.8%
Here:
92%
State:
93%
(% for various income ranges: 90.3% for AGIs below $25k, 93.0% for AGIs $25k-50k, 92.3% for AGIs $50k-75k, 93.3% for AGIs $75k-100k, 92.5% for AGIs $100k-200k, 88.7% for AGIs over 200k)
Averages for the 2012 tax year for zip code 85203, filed in 2013:
Average Adjusted Gross Income (AGI) in 2012: $46,028 (Individual Income Tax Returns)
Here:
$46,028
State:
$57,644
Salary/wage: $39,852 (reported on 85.5% of returns)
Here:
$39,852
State:
$47,932
(% of AGI for various income ranges: 79.8% for AGIs below $25k, 84.4% for AGIs $25k-50k, 79.1% for AGIs $50k-75k, 76.0% for AGIs $75k-100k, 71.6% for AGIs $100k-200k, 48.6% for AGIs over 200k)
Taxable interest for individuals: $1,479 (reported on 23.7% of returns)
This zip code:
$1,479
Arizona:
$2,064
(% of AGI for various income ranges: 0.6% for AGIs below $25k, 0.5% for AGIs $25k-50k, 0.5% for AGIs $50k-75k, 0.6% for AGIs $75k-100k, 0.8% for AGIs $100k-200k, 1.8% for AGIs over 200k)
Ordinary dividends: $3,625 (reported on 13.1% of returns)
Here:
$3,625
State:
$7,268
(% of AGI for various income ranges: 0.9% for AGIs below $25k, 0.6% for AGIs $25k-50k, 0.7% for AGIs $50k-75k, 1.0% for AGIs $75k-100k, 1.1% for AGIs $100k-200k, 2.2% for AGIs over 200k)
Net capital gain/loss in AGI: +$7,288 (reported on 11.1% of returns)
Here:
+$7,288
State:
+$15,530
(% of AGI for various income ranges: 0.3% for AGIs $25k-50k, 0.4% for AGIs $50k-75k, 0.7% for AGIs $75k-100k, 1.3% for AGIs $100k-200k, 9.2% for AGIs over 200k)
Profit/loss from business: +$10,509 (reported on 15.5% of returns)
Here:
+$10,509
State:
+$12,323
(% of AGI for various income ranges: 8.6% for AGIs below $25k, 3.5% for AGIs $25k-50k, 2.2% for AGIs $50k-75k, 1.8% for AGIs $75k-100k, 3.3% for AGIs $100k-200k, 2.5% for AGIs over 200k)
Taxable individual retirement arrangement distribution: $15,054 (reported on 7.2% of returns)
85203:
$15,054
Arizona:
$18,280
(% of AGI for various income ranges: 1.8% for AGIs below $25k, 1.3% for AGIs $25k-50k, 2.1% for AGIs $50k-75k, 3.1% for AGIs $75k-100k, 3.3% for AGIs $100k-200k, 2.5% for AGIs over 200k)
Self-employment retirement plans: $18,575 (reported on 0.3% of returns)
85203:
$18,575
Arizona:
$22,154
Total itemized deductions: $21,530 (24% of AGI, reported on 28.0% of returns)
Here:
$21,530
State:
$23,651
Here:
23.6% of AGI
State:
20.6% of AGI
(% of AGI for various income ranges: 7.7% for AGIs below $25k, 9.7% for AGIs $25k-50k, 13.5% for AGIs $50k-75k, 16.1% for AGIs $75k-100k, 16.2% for AGIs $100k-200k, 14.8% for AGIs over 200k)
Charity contributions: $6,457 (reported on 24.2% of returns)
Here:
$6,457
State:
$4,114
(% of AGI for various income ranges: 0.8% for AGIs below $25k, 1.9% for AGIs $25k-50k, 2.7% for AGIs $50k-75k, 3.7% for AGIs $75k-100k, 4.5% for AGIs $100k-200k, 6.9% for AGIs over 200k)
Taxes paid: $4,708 (reported on 27.9% of returns)
85203:
$4,708
State:
$6,509
(% of AGI for various income ranges: 1.0% for AGIs below $25k, 1.6% for AGIs $25k-50k, 2.6% for AGIs $50k-75k, 3.4% for AGIs $75k-100k, 4.1% for AGIs $100k-200k, 4.1% for AGIs over 200k)
Earned income credit: $2,461 (reported on 22.4% of returns)
Here:
$2,461
State:
$2,432
(% of AGI for various income ranges: 7.0% for AGIs below $25k, 1.4% for AGIs $25k-50k)
Percentage of individuals using paid preparers for their 2012 taxes: 53.5%
Here:
54%
State:
52%
(% for various income ranges: 53.6% for AGIs below $25k, 51.7% for AGIs $25k-50k, 52.5% for AGIs $50k-75k, 53.4% for AGIs $75k-100k, 56.9% for AGIs $100k-200k, 72.0% for AGIs over 200k)
Averages for the 2004 tax year for zip code 85203, filed in 2005:
Average Adjusted Gross Income (AGI) in 2004: $46,191 (Individual Income Tax Returns)
Here:
$46,191
State:
$50,097
Salary/wage: $39,001 (reported on 86.7% of returns)
Here:
$39,001
State:
$42,146
(% of AGI for various income ranges: 92.2% for AGIs below $10k, 82.8% for AGIs $10k-25k, 85.1% for AGIs $25k-50k, 82.5% for AGIs $50k-75k, 79.5% for AGIs $75k-100k, 56.2% for AGIs over 100k)
Taxable interest for individuals: $2,002 (reported on 36.8% of returns)
This zip code:
$2,002
Arizona:
$2,374
(% of AGI for various income ranges: 2.7% for AGIs below $10k, 1.4% for AGIs $10k-25k, 1.0% for AGIs $25k-50k, 1.2% for AGIs $50k-75k, 1.3% for AGIs $75k-100k, 2.3% for AGIs over 100k)
Taxable dividends: $1,940 (reported on 18.5% of returns)
Here:
$1,940
State:
$3,888
(% of AGI for various income ranges: 2.0% for AGIs below $10k, 0.8% for AGIs $10k-25k, 0.5% for AGIs $25k-50k, 0.6% for AGIs $50k-75k, 0.7% for AGIs $75k-100k, 1.0% for AGIs over 100k)
Net capital gain/loss: +$14,838 (reported on 16.6% of returns)
Here:
+$14,838
State:
+$17,569
(% of AGI for various income ranges: 1.2% for AGIs below $10k, 0.3% for AGIs $10k-25k, 0.3% for AGIs $25k-50k, 0.8% for AGIs $50k-75k, 2.2% for AGIs $75k-100k, 13.1% for AGIs over 100k)
Profit/loss from business: +$9,541 (reported on 14.5% of returns)
Here:
+$9,541
State:
+$11,088
(% of AGI for various income ranges: 7.7% for AGIs below $10k, 4.4% for AGIs $10k-25k, 2.9% for AGIs $25k-50k, 2.6% for AGIs $50k-75k, 2.7% for AGIs $75k-100k, 2.7% for AGIs over 100k)
IRA payment deduction: $3,038 (reported on 2.3% of returns)
85203:
$3,038
Arizona:
$3,023
(% of AGI for various income ranges: 0.2% for AGIs below $10k, 0.1% for AGIs $10k-25k, 0.2% for AGIs $25k-50k, 0.2% for AGIs $50k-75k, 0.1% for AGIs $75k-100k, 0.1% for AGIs over 100k)
Self-employed pension: $14,536 (reported on 0.5% of returns)
Here:
$14,536
Arizona:
$15,785
(% of AGI for various income ranges: 0.0% for AGIs $25k-50k, 0.1% for AGIs $50k-75k, 0.1% for AGIs $75k-100k, 0.4% for AGIs over 100k)
Total itemized deductions: $19,508 (23% of AGI, reported on 37.4% of returns)
Here:
$19,508
State:
$19,781
Here:
23.4% of AGI
State:
21.8% of AGI
(% of AGI for various income ranges: 12.7% for AGIs below $10k, 10.8% for AGIs $10k-25k, 14.4% for AGIs $25k-50k, 17.9% for AGIs $50k-75k, 18.8% for AGIs $75k-100k, 16.0% for AGIs over 100k)
Charity contributions deductions: $5,674 (7% of AGI, reported on 33.9% of returns)
Here:
$5,674
State:
$3,389
Here:
6.5% of AGI
State:
3.5% of AGI
(% of AGI for various income ranges: 1.1% for AGIs below $10k, 1.6% for AGIs $10k-25k, 2.5% for AGIs $25k-50k, 3.8% for AGIs $50k-75k, 4.6% for AGIs $75k-100k, 6.0% for AGIs over 100k)
Total tax: $6,950 (reported on 71.7% of returns)
85203:
$6,950
State:
$8,323
(% of AGI for various income ranges: 2.5% for AGIs below $10k, 3.6% for AGIs $10k-25k, 6.2% for AGIs $25k-50k, 8.1% for AGIs $50k-75k, 9.6% for AGIs $75k-100k, 17.5% for AGIs over 100k)
Earned income credit: $1,758 (reported on 16.2% of returns)
Here:
$1,758
State:
$1,786
Percentage of individuals using paid preparers for their 2004 taxes: 57.0%
Here:
57%
State:
60%
(% for various income ranges: 48.2% for AGIs below $10k, 60.6% for AGIs $10k-25k, 57.7% for AGIs $25k-50k, 56.3% for AGIs $50k-75k, 55.3% for AGIs $75k-100k, 64.1% for AGIs over 100k)
Likely homosexual households (counted as self-reported same-sex unmarried-partner households)
Lesbian couples: 0.2% of all households
Gay men: 0.2% of all households
Household received Food Stamps/SNAP in the past 12 months: 1,348 Household did not receive Food Stamps/SNAP in the past 12 months: 12,328
Women who had a birth in the past 12 months: 660 (462 now married, 200 unmarried) Women who did not have a birth in the past 12 months: 9,107 (3,940 now married, 5,156 unmarried)
Housing units in zip code 85203 with a mortgage: 5,287 (421 second mortgage, 9 home equity loan, 368 both second mortgage and home equity loan) Houses without a mortgage: 122
Median monthly owner costs for units with a mortgage: $1,631 Median monthly owner costs for units without a mortgage: $489
Residents with income below the poverty level in 2022:
This zip code:
11.7%
Whole state:
12.5%
Residents with income below 50% of the poverty level in 2022:
This zip code:
6.2%
Whole state:
6.0%
Median number of rooms in houses and condos:
Here:
6.5
State:
6.0
Median number of rooms in apartments:
Here:
3.8
State:
4.1
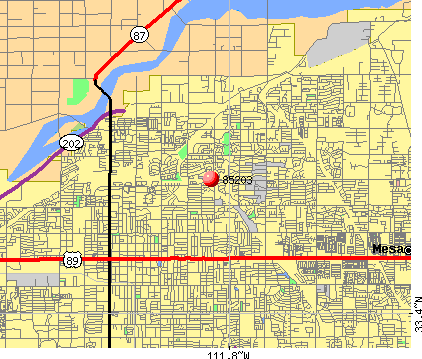
Notable locations in this zip code not listed on our city pages
Notable locations in zip code 85203: Mesa Substation (A), Shady Grove Mobile and Recreational Vehicle Park (B), Salt River Fire Department Station 292 (C), Mesa Fire Department Station 211 (D), Mesa Public Schools Administration Center (E). Display/hide their locations on the map
Shopping Centers: Gilbert Plaza Shopping Center (1), Royal Palms of Mesa Shopping Center (2), Brown and Gilbert Plaza Shopping Center (3). Display/hide their locations on the map
Churches in zip code 85203 include: First Southern Baptist Church (A), First Presbyterian Church (B), Ferguson Memorial Baptist Church (C), Desert Heritage Church (D), City of Grace Church (E), Church of the Redeemer (F), Central Church of Christ (G), The Church of Jesus Christ of Latter Day Saints (H), Lehi Presbyterian Church (I). Display/hide their locations on the map
Reservoirs: Country Manor Subdivision Water Retention Basin (A), Gilbert Estates Phase Two Water Retention Basin (B), Kirk Estates Subdivision Water Retention Basin (C), Oakwood Estates Subdivision Water Retention Basin (D), Pleasant Shadows Subdivision Water Retention Basin (E). Display/hide their locations on the map
Parks in zip code 85203 include: Porter Park (1), Pleasant Shadows Subdivision Mini Park (2), Pioneer Park (3), Kirk Estates Subdivision Mini Park (4), Gilbert Estates Phase Two Mini Park (5), Brinton Desert Botanical Garden (6), Park of the Canals (7), Oakwood Estates Subdivision Mini Park (8), Country Manor Subdivision Mini Park (9). Display/hide their locations on the map
Tourist attractions (not listed on the city page) : Amf Bowling Centers - Amf Christown Lanes Village Lanes TN (Amusement & Theme Parks; 816 East Main Street), Amf Apache Lanes (Amusement & Theme Parks; 816 East Main Street).
5,773 married couples with children.
2,821 single-parent households (848 men, 1,973 women).
77.3% of residents of 85203 zip code speak English at home.
17.6% of residents speak Spanish at home (68% very well, 17% well, 8% not well, 7% not at all).
2.1% of residents speak other Indo-European language at home (80% very well, 10% well, 10% not well).
1.6% of residents speak Asian or Pacific Island language at home (63% very well, 28% well, 7% not well, 1% not at all).
1.0% of residents speak other language at home (67% very well, 23% well, 10% not well).
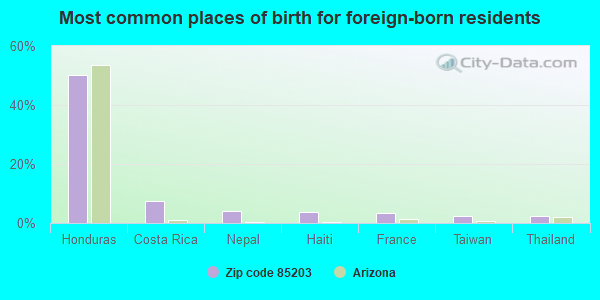
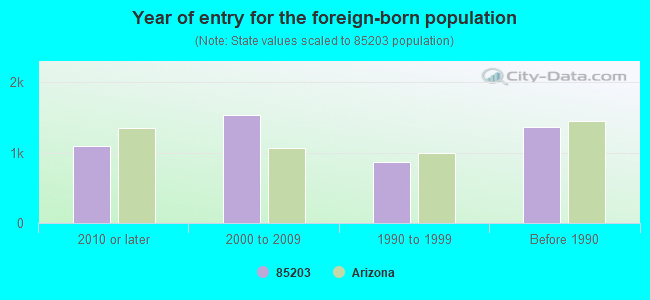
Foreign born population: 4,283 (10.9%) (35.8% of them are naturalized citizens)
Major facilities with environmental interests located in this zip code:
BIG TWO TOYOTA (1301 WEST BROADWAY in MESA, AZ)
STATE MASTER (Arizona's Tracking Of The Environment) - AZURITE-5687, LEAKING STORAGE TANK, UNDERGROUND STORAGE TANK PROGRAM, AIR PROGRAM Conditionally Exempt Small Quantity Generators, less than 100 kg/month of hazardous waste (Resource Conservation and Recovery Act (tracking hazardous waste)) Organizations: JBL & ASOCIATES INC (CONTACT/GENERAL)
, BIG TWO OLDSMOBILE (CONTACT/GENERAL)
, LON HOEYE & CHRIS HOEYE (CONTACT/OWNER)
Alternative names: BIG TWO OLDSMOBILE, CEH AUTOMOTIVE CORP
ACADEMY WITH COMMUNITY PARTNERS (433 N. HALL in MESA, AZ)
(National Center for Education Statistics) - STATE ID-201 Organizations: ACADEMY WITH COMMUNITY PARTNERS INC (SCHOOL DISTRICT)
BENJAMIN FRANKLIN CHARTER SCHOOL - MESA (2345 N. HORNE in MESA, AZ)
(National Center for Education Statistics) - STATE ID-101
EAST VALLEY ACADEMY (1858 E. BROWN ROAD in MESA, AZ)
(National Center for Education Statistics) - STATE ID-101
HOMEBOUND (549 NORTH STAPLEY DRIVE in MESA, AZ)
(National Center for Education Statistics) - STATE ID-180 Organizations: MESA UNIFIED DISTRICT (SCHOOL DISTRICT)
FRYS FOOD & DRUG #622 (1935 N STAPLEY DR in MESA, AZ)
Conditionally Exempt Small Quantity Generators, less than 100 kg/month of hazardous waste (Resource Conservation and Recovery Act (tracking hazardous waste)) - notification Organizations: FRYS FOOD AND DRUG (CONTACT/OPERATOR)
, SMITHS FOOD & DRUG CENTER IN (CONTACT/OWNER)
, KROGER CO (CONTACT/OWNER)
Alternative names: SMITTYS PHOTO 622
ARCO FACILITY 05429 (2816 MCKELLIPS RD in MESA, AZ)
Small Quantity Generators, between 100 kg and 1000 kg of hazardous waste/month (Resource Conservation and Recovery Act (tracking hazardous waste)) - notification Organizations: BP WEST COAST PRODUCTS LLC (CONTACT/OWNER)
Alternative names: ARCO 5429, ARCO NO 5429
ARCO FACILITY 5361 (1955 E MCKELLIPS RD in MESA, AZ)
Small Quantity Generators, between 100 kg and 1000 kg of hazardous waste/month (Resource Conservation and Recovery Act (tracking hazardous waste)) - notification Organizations: BP WEST COAST PRODUCTS LLC (CONTACT/OWNER)
Alternative names: ARCO 5361
WESTERN DENTAL (1161 E MAIN ST in MESA, AZ)
Conditionally Exempt Small Quantity Generators, less than 100 kg/month of hazardous waste (Resource Conservation and Recovery Act (tracking hazardous waste)) - notification Organizations: WESTERN DENTAL SERVICES (CONTACT/OWNER)
AZTEC MATERIALS (3250 E LEHI ROAD in MESA, AZ)
CRITERIA AND HAZARDOUS AIR POLLUTANT INVENTORY (Inventory of air pollution sources) Business SIC and NAICS classification: CONSTRUCTION SAND AND GRAVEL
Housing units lacking complete plumbing facilities: 0.5% Housing units lacking complete kitchen facilities: 0.8%
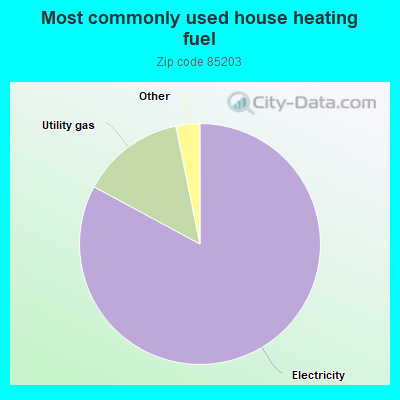
82.8%Electricity
13.9%Utility gas
1.0%No fuel used
0.7%Bottled, tank, or LP gas
0.6%Solar energy
Population in 1990: 32,853. Population change in the 1990s: +4,143 (+12.6%).
Place of birth for U.S.-born residents:
This state: 19,123
Northeast: 1,865
Midwest: 4,594
South: 2,285
West: 6,430
47% of the 85203 zip code residents lived in the same house 5 years ago. Out of people who lived in different houses, 70% lived in this county. Out of people who lived in different counties, 50% lived in Arizona.
85% of the 85203 zip code residents lived in the same house 1 year ago. Out of people who lived in different houses, 76% moved from this county. Out of people who lived in different houses, 3% moved from different county within same state. Out of people who lived in different houses, 13% moved from different state. Out of people who lived in different houses, 3% moved from abroad.
Private vs. public school enrollment:
Students in private schools in grades 1 to 8 (elementary and middle school): 533
Here:
11.5%
Arizona:
10.4%
Students in private schools in grades 9 to 12 (high school): 164
Here:
7.1%
Arizona:
8.8%
Students in private undergraduate colleges: 188
Here:
9.1%
Arizona:
13.1%
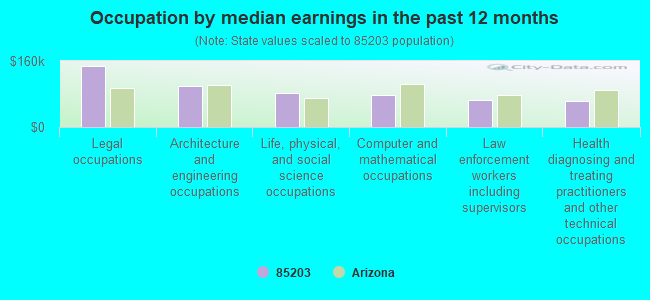
Occupation by median earnings in the past 12 months ($)
148,096Legal occupations
98,278Architecture and engineering occupations
83,099Life, physical, and social science occupations
77,337Computer and mathematical occupations
64,683Law enforcement workers including supervisors
63,610Health diagnosing and treating practitioners and other technical occupations
Companies with federal contracts located in this zip code (MESA, AZ):
ALASKAN BUSINESS SERVICES (1139 E HUBER ST; small business) : $249,661 in 6 contractsfrom 2003 to 2004
Contracts for Miscellaneous Items, Fiber Optic Interconnectors, Electrical and Electronic Properties Measuring and Testing Instruments, ADP Support Equipment, and moreby Navy, Army, Air Force, NASA, and others Signed by year:2000: $0; 2001: $0; 2002: $0; 2003: $51,696; 2004: $197,965; 2005: $0; 2006: $0.
Biggest contracts:
$73,690 with Navy for Miscellaneous Items. Signed on 2004-09-30. Completion date: 2004-10-11.
$51,696 with Army for Fiber Optic Interconnectors. Taking place in UT. Signed on 2003-09-30. Completion date: 2003-10-04.
$45,200 with Army for Electrical and Electronic Properties Measuring and Testing Instruments. Signed on 2004-04-28. Completion date: 2004-06-09.
$32,790 with Air Force for ADP Support Equipment. Signed on 2004-11-30. Completion date: 2004-12-31.
DAVE BANG ASSOCIATES, INC (140 N GILBERT ROAD; small business) : $62,530 in 2 contractsfrom 2001 to 2005
$32,530 with Air Force for Miscellaneous Prefabricated Structures. Signed on 2005-08-01. Completion date: 2005-11-18.
$30,000 with Bureau of Land Management for Prefabricated and Portable Buildings. Signed on 2001-09-15. Completion date: 2001-12-15.
DISC RECORDING TECHNOLOGY, LLC (1555 E UNIVERSITY DRIVE; small business)
$28,035 with Department of Defense for ADP Components. Signed on 2001-06-15. Completion date: 2001-06-22.
P M PLUMBING AND MECHANICAL IN (660 E MAIN ST; small business)
$11,200 with Army for Waste Disposal Equipment. Signed on 2004-06-08. Completion date: 2004-07-07.
Top industries in this zip code by the number of employees in 2005:
2003 - 2018 National Fire Incident Reporting System (NFIRS) incidents
Based on the data from the years 2003 - 2018 the average number of fires per year is 11. The highest number of reported fire incidents - 91 took place in 2018, and the least - 0 in 2005. The data has a growing trend.
When looking into fire subcategories, the most incidents belonged to: Outside Fires (42.4%), and Structure Fires (36.6%).
Fire incident types reported to NFIRS in Zip Code 85203
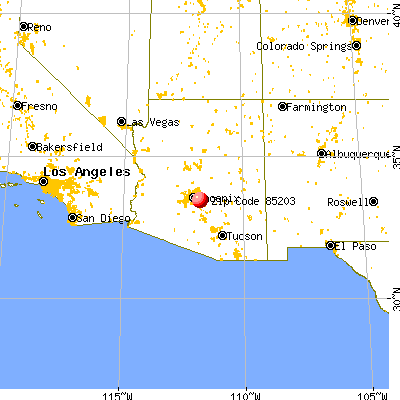


 Nearest zip codes: 85213, 85201, 85204, 85256, 85210, 85205.


 Based on the data from the years 2003 - 2018 the average number of fires per year is 11. The highest number of reported fire incidents - 91 took place in 2018, and the least - 0 in 2005. The data has a growing trend.
 When looking into fire subcategories, the most incidents belonged to: Outside Fires (42.4%), and Structure Fires (36.6%).