Estimated zip code population in 2022: 53,190 Zip code population in 2010: 46,092 Zip code population in 2000: 50,014
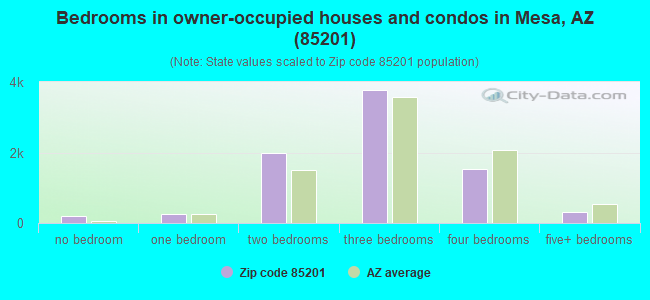
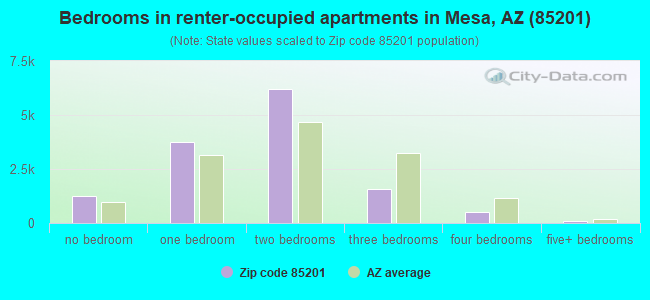
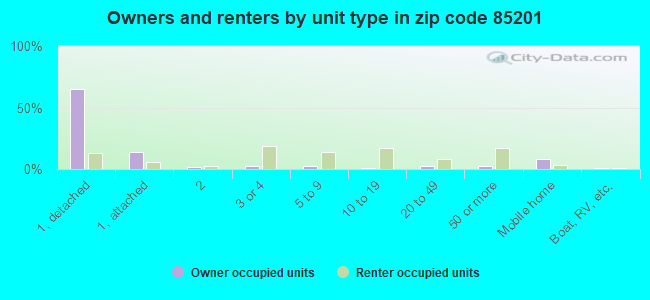
Houses and condos: 23,833 Renter-occupied apartments: 13,452
% of renters here:
63%
State:
33%
March 2022 cost of living index in zip code 85201: 99.9 (near average, U.S. average is 100)
Land area: 9.3 sq. mi. Water area: 0.5 sq. mi.
Population density: 5,705 people per square mile
(average).
OSM Map
General Map
Google Map
MSN Map
OSM Map
General Map
Google Map
MSN Map
OSM Map
General Map
Google Map
MSN Map
OSM Map
General Map
Google Map
MSN Map
Please wait while loading the map...
Real estate property taxes paid for housing units in 2022:
This zip code:
0.3% ($1,001)
Arizona:
0.4% ($1,786)
Median real estate property taxes paid for housing units with mortgages in 2022: $1,092 (0.3%) Median real estate property taxes paid for housing units with no mortgage in 2022: $851 (0.3%)
Averages for the 2020 tax year for zip code 85201, filed in 2021:
Average Adjusted Gross Income (AGI) in 2020: $41,746 (Individual Income Tax Returns)
Here:
$41,746
State:
$73,499
Salary/wage: $38,343 (reported on 86.6% of returns)
Here:
$38,343
State:
$59,499
(% of AGI for various income ranges: 1256.5% for AGIs below $25k, 3995.7% for AGIs $25k-50k, 7461.3% for AGIs $50k-75k, 10941.6% for AGIs $75k-100k, 19048.7% for AGIs $100k-200k, 46277.1% for AGIs over 200k)
Taxable interest for individuals: $1,208 (reported on 12.6% of returns)
This zip code:
$1,208
Arizona:
$2,325
(% of AGI for various income ranges: 6.0% for AGIs below $25k, 5.8% for AGIs $25k-50k, 16.0% for AGIs $50k-75k, 43.3% for AGIs $75k-100k, 156.3% for AGIs $100k-200k, 1468.6% for AGIs over 200k)
Ordinary dividends: $3,910 (reported on 7.5% of returns)
Here:
$3,910
State:
$8,711
(% of AGI for various income ranges: 7.0% for AGIs below $25k, 8.7% for AGIs $25k-50k, 25.0% for AGIs $50k-75k, 84.7% for AGIs $75k-100k, 244.0% for AGIs $100k-200k, 4210.0% for AGIs over 200k)
Net capital gain/loss in AGI: +$7,243 (reported on 7.8% of returns)
Here:
+$7,243
State:
+$31,332
(% of AGI for various income ranges: 5.0% for AGIs below $25k, 10.3% for AGIs $25k-50k, 41.7% for AGIs $50k-75k, 146.2% for AGIs $75k-100k, 695.7% for AGIs $100k-200k, 7815.7% for AGIs over 200k)
Profit/loss from business: +$9,183 (reported on 15.3% of returns)
Here:
+$9,183
State:
+$13,214
(% of AGI for various income ranges: 156.2% for AGIs below $25k, 124.9% for AGIs $25k-50k, 200.2% for AGIs $50k-75k, 301.9% for AGIs $75k-100k, 694.7% for AGIs $100k-200k, 2680.0% for AGIs over 200k)
Taxable individual retirement arrangement distribution: $15,392 (reported on 3.7% of returns)
85201:
$15,392
Arizona:
$23,364
(% of AGI for various income ranges: 23.1% for AGIs below $25k, 31.8% for AGIs $25k-50k, 90.9% for AGIs $50k-75k, 217.9% for AGIs $75k-100k, 660.0% for AGIs $100k-200k, 2322.9% for AGIs over 200k)
Total itemized deductions: $35,468 (reported on 3.4% of returns)
Here:
$35,468
State:
$36,308
(% of AGI for various income ranges: 19.2% for AGIs below $25k, 43.2% for AGIs $25k-50k, 195.7% for AGIs $50k-75k, 357.9% for AGIs $75k-100k, 1147.2% for AGIs $100k-200k, 13381.4% for AGIs over 200k)
Charity contributions: $11,970 (reported on 2.7% of returns)
Here:
$11,970
State:
$11,955
(% of AGI for various income ranges: 1.9% for AGIs below $25k, 5.3% for AGIs $25k-50k, 33.8% for AGIs $50k-75k, 96.5% for AGIs $75k-100k, 378.5% for AGIs $100k-200k, 4538.6% for AGIs over 200k)
Taxes paid: $4,813 (reported on 3.4% of returns)
85201:
$4,813
State:
$6,820
(% of AGI for various income ranges: 1.9% for AGIs below $25k, 4.2% for AGIs $25k-50k, 28.4% for AGIs $50k-75k, 61.6% for AGIs $75k-100k, 233.2% for AGIs $100k-200k, 1147.1% for AGIs over 200k)
Earned income credit: $2,406 (reported on 22.8% of returns)
Here:
$2,406
State:
$2,383
(% of AGI for various income ranges: 114.7% for AGIs below $25k, 71.6% for AGIs $25k-50k, 1.5% for AGIs $50k-75k)
Percentage of individuals using paid preparers for their 2020 taxes: 92.5%
Here:
92%
State:
93%
(% for various income ranges: 91.1% for AGIs below $25k, 93.5% for AGIs $25k-50k, 92.8% for AGIs $50k-75k, 92.5% for AGIs $75k-100k, 93.2% for AGIs $100k-200k, 95.0% for AGIs over 200k)
Averages for the 2012 tax year for zip code 85201, filed in 2013:
Average Adjusted Gross Income (AGI) in 2012: $32,917 (Individual Income Tax Returns)
Here:
$32,917
State:
$57,644
Salary/wage: $30,235 (reported on 88.2% of returns)
Here:
$30,235
State:
$47,932
(% of AGI for various income ranges: 83.1% for AGIs below $25k, 89.5% for AGIs $25k-50k, 81.8% for AGIs $50k-75k, 77.8% for AGIs $75k-100k, 72.4% for AGIs $100k-200k, 38.0% for AGIs over 200k)
Taxable interest for individuals: $1,025 (reported on 15.5% of returns)
This zip code:
$1,025
Arizona:
$2,064
(% of AGI for various income ranges: 0.3% for AGIs below $25k, 0.2% for AGIs $25k-50k, 0.6% for AGIs $50k-75k, 0.5% for AGIs $75k-100k, 0.7% for AGIs $100k-200k, 1.9% for AGIs over 200k)
Ordinary dividends: $3,449 (reported on 8.0% of returns)
Here:
$3,449
State:
$7,268
(% of AGI for various income ranges: 0.6% for AGIs below $25k, 0.3% for AGIs $25k-50k, 0.8% for AGIs $50k-75k, 1.0% for AGIs $75k-100k, 1.4% for AGIs $100k-200k, 4.2% for AGIs over 200k)
Net capital gain/loss in AGI: +$3,696 (reported on 6.5% of returns)
Here:
+$3,696
State:
+$15,530
(% of AGI for various income ranges: 0.2% for AGIs $50k-75k, 0.8% for AGIs $75k-100k, 2.3% for AGIs $100k-200k, 6.9% for AGIs over 200k)
Profit/loss from business: +$9,380 (reported on 12.2% of returns)
Here:
+$9,380
State:
+$12,323
(% of AGI for various income ranges: 7.7% for AGIs below $25k, 2.0% for AGIs $25k-50k, 1.8% for AGIs $50k-75k, 1.6% for AGIs $75k-100k, 5.5% for AGIs $100k-200k)
Taxable individual retirement arrangement distribution: $13,427 (reported on 5.2% of returns)
85201:
$13,427
Arizona:
$18,280
(% of AGI for various income ranges: 1.3% for AGIs below $25k, 1.2% for AGIs $25k-50k, 2.0% for AGIs $50k-75k, 2.1% for AGIs $75k-100k, 3.4% for AGIs $100k-200k, 9.5% for AGIs over 200k)
Total itemized deductions: $17,402 (26% of AGI, reported on 16.0% of returns)
Here:
$17,402
State:
$23,651
Here:
25.6% of AGI
State:
20.6% of AGI
(% of AGI for various income ranges: 4.4% for AGIs below $25k, 5.8% for AGIs $25k-50k, 10.1% for AGIs $50k-75k, 12.5% for AGIs $75k-100k, 13.8% for AGIs $100k-200k, 16.9% for AGIs over 200k)
Charity contributions: $4,124 (reported on 13.0% of returns)
Here:
$4,124
State:
$4,114
(% of AGI for various income ranges: 0.5% for AGIs below $25k, 0.8% for AGIs $25k-50k, 2.0% for AGIs $50k-75k, 3.0% for AGIs $75k-100k, 3.2% for AGIs $100k-200k, 4.1% for AGIs over 200k)
Taxes paid: $3,404 (reported on 15.9% of returns)
85201:
$3,404
State:
$6,509
(% of AGI for various income ranges: 0.5% for AGIs below $25k, 1.0% for AGIs $25k-50k, 1.9% for AGIs $50k-75k, 2.6% for AGIs $75k-100k, 3.4% for AGIs $100k-200k, 3.7% for AGIs over 200k)
Earned income credit: $2,402 (reported on 27.3% of returns)
Here:
$2,402
State:
$2,432
(% of AGI for various income ranges: 7.3% for AGIs below $25k, 1.3% for AGIs $25k-50k)
Percentage of individuals using paid preparers for their 2012 taxes: 50.8%
Here:
51%
State:
52%
(% for various income ranges: 51.9% for AGIs below $25k, 48.4% for AGIs $25k-50k, 48.7% for AGIs $50k-75k, 51.9% for AGIs $75k-100k, 57.6% for AGIs $100k-200k, 77.8% for AGIs over 200k)
Averages for the 2004 tax year for zip code 85201, filed in 2005:
Average Adjusted Gross Income (AGI) in 2004: $33,891 (Individual Income Tax Returns)
Here:
$33,891
State:
$50,097
Salary/wage: $29,066 (reported on 89.0% of returns)
Here:
$29,066
State:
$42,146
(% of AGI for various income ranges: 109.7% for AGIs below $10k, 88.0% for AGIs $10k-25k, 90.1% for AGIs $25k-50k, 84.7% for AGIs $50k-75k, 79.5% for AGIs $75k-100k, 34.1% for AGIs over 100k)
Taxable interest for individuals: $2,057 (reported on 25.2% of returns)
This zip code:
$2,057
Arizona:
$2,374
(% of AGI for various income ranges: 3.5% for AGIs below $10k, 1.0% for AGIs $10k-25k, 0.8% for AGIs $25k-50k, 0.9% for AGIs $50k-75k, 1.2% for AGIs $75k-100k, 3.6% for AGIs over 100k)
Taxable dividends: $2,331 (reported on 11.7% of returns)
Here:
$2,331
State:
$3,888
(% of AGI for various income ranges: 2.5% for AGIs below $10k, 0.7% for AGIs $10k-25k, 0.4% for AGIs $25k-50k, 0.8% for AGIs $50k-75k, 0.6% for AGIs $75k-100k, 1.4% for AGIs over 100k)
Net capital gain/loss: +$19,815 (reported on 10.1% of returns)
Here:
+$19,815
State:
+$17,569
(% of AGI for various income ranges: -1.2% for AGIs below $10k, 0.1% for AGIs $10k-25k, 0.3% for AGIs $25k-50k, 0.7% for AGIs $50k-75k, 3.3% for AGIs $75k-100k, 25.3% for AGIs over 100k)
Profit/loss from business: +$6,577 (reported on 10.4% of returns)
Here:
+$6,577
State:
+$11,088
(% of AGI for various income ranges: 4.5% for AGIs below $10k, 2.9% for AGIs $10k-25k, 1.4% for AGIs $25k-50k, 1.3% for AGIs $50k-75k, 2.1% for AGIs $75k-100k, 2.5% for AGIs over 100k)
Profit/loss from farming: +$1,214 (reported on 0.1% of returns)
Here:
+$1,214
State:
-$7,013
IRA payment deduction: $2,397 (reported on 1.4% of returns)
85201:
$2,397
Arizona:
$3,023
(% of AGI for various income ranges: 0.1% for AGIs $10k-25k, 0.1% for AGIs $25k-50k, 0.1% for AGIs $50k-75k, 0.1% for AGIs $75k-100k, 0.1% for AGIs over 100k)
Self-employed pension: $16,458 (reported on 0.1% of returns)
Here:
$16,458
Arizona:
$15,785
Total itemized deductions: $15,248 (22% of AGI, reported on 24.4% of returns)
Here:
$15,248
State:
$19,781
Here:
22.5% of AGI
State:
21.8% of AGI
(% of AGI for various income ranges: 9.4% for AGIs below $10k, 5.9% for AGIs $10k-25k, 10.1% for AGIs $25k-50k, 14.3% for AGIs $50k-75k, 15.5% for AGIs $75k-100k, 11.8% for AGIs over 100k)
Charity contributions deductions: $3,868 (5% of AGI, reported on 20.8% of returns)
Here:
$3,868
State:
$3,389
Here:
5.4% of AGI
State:
3.5% of AGI
(% of AGI for various income ranges: 0.8% for AGIs below $10k, 0.8% for AGIs $10k-25k, 1.4% for AGIs $25k-50k, 2.8% for AGIs $50k-75k, 3.3% for AGIs $75k-100k, 4.6% for AGIs over 100k)
Total tax: $4,398 (reported on 66.2% of returns)
85201:
$4,398
State:
$8,323
(% of AGI for various income ranges: 2.5% for AGIs below $10k, 3.4% for AGIs $10k-25k, 6.3% for AGIs $25k-50k, 8.7% for AGIs $50k-75k, 10.5% for AGIs $75k-100k, 16.0% for AGIs over 100k)
Earned income credit: $1,816 (reported on 21.5% of returns)
Here:
$1,816
State:
$1,786
Percentage of individuals using paid preparers for their 2004 taxes: 57.5%
Here:
58%
State:
60%
(% for various income ranges: 52.9% for AGIs below $10k, 60.1% for AGIs $10k-25k, 56.5% for AGIs $25k-50k, 57.3% for AGIs $50k-75k, 57.5% for AGIs $75k-100k, 69.5% for AGIs over 100k)
Likely homosexual households (counted as self-reported same-sex unmarried-partner households)
Lesbian couples: 0.3% of all households
Gay men: 0.2% of all households
Household received Food Stamps/SNAP in the past 12 months: 3,890 Household did not receive Food Stamps/SNAP in the past 12 months: 17,975
Women who had a birth in the past 12 months: 542 (219 now married, 313 unmarried) Women who did not have a birth in the past 12 months: 13,939 (5,004 now married, 8,957 unmarried)
Housing units in zip code 85201 with a mortgage: 4,996 (459 second mortgage, 30 home equity loan, 366 both second mortgage and home equity loan) Houses without a mortgage: 21
Median monthly owner costs for units with a mortgage: $1,359 Median monthly owner costs for units without a mortgage: $423
Residents with income below the poverty level in 2022:
This zip code:
16.0%
Whole state:
12.5%
Residents with income below 50% of the poverty level in 2022:
This zip code:
8.1%
Whole state:
6.0%
Median number of rooms in houses and condos:
Here:
5.4
State:
6.0
Median number of rooms in apartments:
Here:
3.6
State:
4.1
Notable locations in this zip code not listed on our city pages
Notable locations in zip code 85201: Mesa Grande Ruins (A), Mesa Golf and Country Club (B), University of Arizona Experimental Farm (C), Mesa Police Rifle Range (D), City of Mesa Northwest Water Reclamation Plant (E), Mesa Amphitheatre (F), Centennial Center (G), Mesa Municipal Court (H), Arizona Museum of Natural History (I), Arizona Museum for Youth (J), Mesa Library Main Branch (K), Lutheran Physician Hospital Organization (L), Mesa Fire Department Station 218 (M), Mesa Fire Department Station 203 (N), Mesa Fire Department Station 201 (O), Mesa Fire Department Administration Office (P), Mesa Police Department (Q), North Lewis Center (R). Display/hide their locations on the map
Shopping Centers: Tri-City Mall (1), Westwood Plaza Shopping Center (2), Main Street Marketplace Shopping Center (3). Display/hide their locations on the map
Churches in zip code 85201 include: Gateway Bible Church (A), First Evangelical Lutheran Church (B), First Christian Church of Mesa (C), Calvary Korean Community Church (D), The Church of Jesus Christ of Latter Day Saints (E), Rose of Sharon Church (F), Queen of Peace Catholic Church (G), Parkway Baptist Church (H), New Life Bible Church (I). Display/hide their locations on the map
Reservoirs: Mesa Meadows Subdivision Water Retention Basin (A), Old West Valley Subdivision Water Retention Basin (B). Display/hide their locations on the map
Parks in zip code 85201 include: Rendezvous Park (1), Fitch Park (2), Ho Ho Kam Park (3), Mesa Meadows Subdivision Mini Park (4), Old West Valley Subdivision Mini Park (5), Evergreen Park (6), Escobedo Park (7). Display/hide their locations on the map
Tourist attractions (not listed on the city page) : Enchanted Island Amusement Park (Amusement & Theme Parks; 1202 West Encanto Boulevard), Salt River Tubing Recreational & Shuttle Services - River Information (Amusement & Theme Parks; Bush Highway), Geoffrey Macke Dance Studios (1645 North Date 108), Canyon Lake Marina Canyon Lake - Dolly Steamboat Tours (Tours & Charters; Canyon Lake).
5,145 married couples with children.
5,042 single-parent households (1,178 men, 3,864 women).
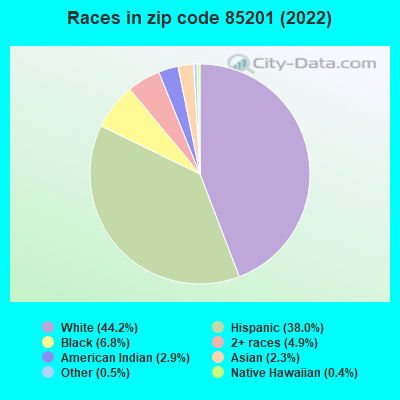
69.2% of residents of 85201 zip code speak English at home.
25.1% of residents speak Spanish at home (66% very well, 15% well, 13% not well, 6% not at all).
1.0% of residents speak other Indo-European language at home (90% very well, 8% well, 2% not at all).
3.2% of residents speak Asian or Pacific Island language at home (78% very well, 12% well, 10% not well, 1% not at all).
1.3% of residents speak other language at home (72% very well, 23% well, 4% not well).
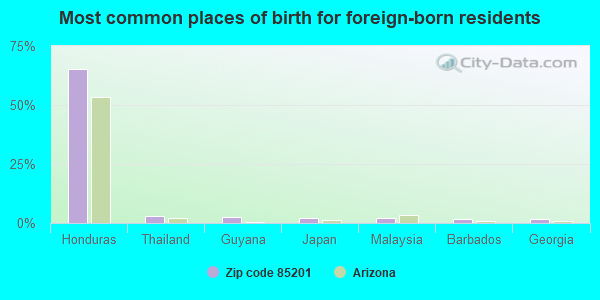
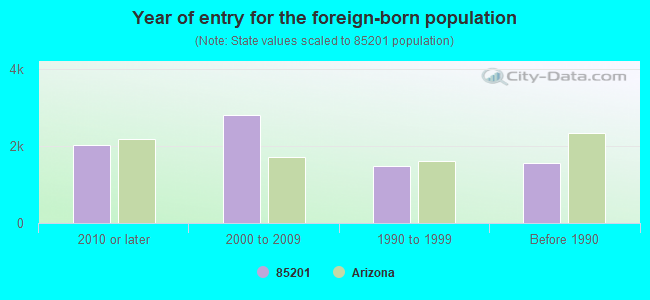
Foreign born population: 7,286 (13.7%) (37.4% of them are naturalized citizens)
Major facilities with environmental interests located in this zip code:
HENRY BROWN BUICK PONTIAC GMC (1600 W MAIN in MESA, AZ)
STATE MASTER (Arizona's Tracking Of The Environment) - AZURITE-5586, PESTICIDES PROGRAM, UNDERGROUND STORAGE TANK PROGRAM, AIR PROGRAM (Resource Conservation and Recovery Act (tracking hazardous waste)) Organizations: SUN PONTIAC INC (CONTACT/GENERAL)
, SCOTTSDALE, CITY OF - FLEET MAINTENANCE DIVISION (CONTACT/GENERAL)
, PICCINATI PROPERTIES (CONTACT/OWNER)
Alternative names: SUN PONTIAC
WESTWOOD HIGH SCHOOL (945 W 8TH STREET in MESA, AZ)
(Geographic Names Information System) (National Center for Education Statistics) - STATE ID-272 Conditionally Exempt Small Quantity Generators, less than 100 kg/month of hazardous waste (Resource Conservation and Recovery Act (tracking hazardous waste)) Organizations: MESA UNIFIED SCHOOL DISTRICT #4 (CONTACT/OWNER)
, MESA UNIFIED DISTRICT (SCHOOL DISTRICT)
Alternative names: MUSD 4 PUR OPER WESTWOOD HIGH
ARCO #5439 (25 W MCKELLIPS RD in MESA, AZ)
STATE MASTER (Arizona's Tracking Of The Environment) - AZURITE-1934, LEAKING STORAGE TANK, WASTE, UNDERGROUND STORAGE TANK PROGRAM Small Quantity Generators, between 100 kg and 1000 kg of hazardous waste/month (Resource Conservation and Recovery Act (tracking hazardous waste)) - notification Organizations: BP WEST COAST PRODUCTS LLC (CONTACT/GENERAL)
, ARCO PRODUCTS COMPANY (CONTACT/GENERAL)
Alternative names: ARCO FACILITY NO 5439, ARCO NO 5439
NORTHWEST WATER RECLAMATION PLANT (960 NORTH RIVERVIEW in MESA, AZ)
AIR SYNTHETIC MINOR (AIRS/AFS) National Pollutant Discharge Elimination System MAJOR (Tracking pollutant discharge elimination systems) - permit National Pollutant Discharge Elimination System NON-MAJOR (Tracking pollutant discharge elimination systems) - permit Conditionally Exempt Small Quantity Generators, less than 100 kg/month of hazardous waste (Resource Conservation and Recovery Act (tracking hazardous waste)) - notification Business SIC classification: SEWERAGE SYSTEMS Organizations: CITY OF MESA (CONTACT/OWNER)
, MESA, CITY OF (CONTACT/OWNER)
Alternative names: MESA CITY NORTHWEST WATER RECLAMATION PLANT, MESA, CITY OF, MESA CITY OF WATER RECLAMATION PLANT, MESA CITY OF WWATER RECLAMATION, MESA NORTHWEST WRP
EISENHOWER ELEMENTARY SCHOOL (848 NORTH MESA DR in MESA, AZ)
(Geographic Names Information System) (National Center for Education Statistics) - STATE ID-120 Organizations: MESA UNIFIED DISTRICT (SCHOOL DISTRICT)
CARSON JUNIOR HIGH SCHOOL (525 N WESTWOOD in MESA, AZ)
(Geographic Names Information System) (National Center for Education Statistics) - STATE ID-252 Organizations: MESA UNIFIED DISTRICT (SCHOOL DISTRICT)
EAST VALLEY MIDDLE SCHOOL (122 N COUNTRY CLUB DR. in MESA, AZ)
(National Center for Education Statistics) - STATE ID-004 Organizations: MARICOPA COUNTY REGIONAL DISTRICT (SCHOOL DISTRICT)
GEM CHARTER SCHOOL (1704 NORTH CENTER STREET in MESA, AZ)
(National Center for Education Statistics) - STATE ID-001 Organizations: GEM CHARTER SCHOOL, INC. (SCHOOL DISTRICT)
EAST VALLEY INSTITUTE OF TECHN (1601 WEST MAIN STREET in MESA, AZ)
(National Center for Education Statistics) - STATE ID-001 Organizations: EAST VALLEY INSTITUTE OF TECHNOLOGY (SCHOOL DISTRICT)
EMERSON ELEMENTARY SCHOOL (415 NORTH WESTWOOD ROAD in MESA, AZ)
(National Center for Education Statistics) - STATE ID-104 Organizations: MESA UNIFIED DISTRICT (SCHOOL DISTRICT)
WEST MIDDLE SCHOOL (122 NORTH COUNTRY CLUB DR. in MESA, AZ)
(National Center for Education Statistics) - STATE ID-191 Organizations: MESA UNIFIED DISTRICT (SCHOOL DISTRICT)
BANNER MESA MEDICAL CENTER (1010 N. COUNTRY CLUB DR. in MESA, AZ)
HAZARDOUS WASTE BIENNIAL REPORTER (Resource Conservation and Recovery Act (tracking hazardous waste)) Large Quantity Generators, more that 1000 kg of hazardous waste/month (Resource Conservation and Recovery Act (tracking hazardous waste)) Organizations: BECKY KUHN (CONTACT/OPERATOR)
, BANNER HEALTH (CONTACT/OWNER)
Alternative names: MESA LUTHERAN HOSPITAL, MESA LUTHERN HOSPITAL
VULCAN MATERIALS CO (1900 NORTH LONGMORE ROAD in MESA, AZ) . Tribal Land
CRITERIA AND HAZARDOUS AIR POLLUTANT INVENTORY (Inventory of air pollution sources) Conditionally Exempt Small Quantity Generators, less than 100 kg/month of hazardous waste (Resource Conservation and Recovery Act (tracking hazardous waste)) - notification TRI REPORTER (Tracking of toxic chemicals releasing facilities) Business SIC classification: ASPHALT PAVING MIXTURES AND BLOCKS Business NAICS classification: ASPHALT PAVING MIXTURE AND BLOCK MANUFACTURING.; ASPHALT PAVING MIXTURE AND BLOCK MANUFACTURING. Organizations: INDUSTRIA ASPHALT/CALMAT (CONTACT/OWNER)
Alternative names: CALMAT COMPANIES THE, VULCAN MATERIALS CO. MESA
Housing units lacking complete plumbing facilities: 0.4% Housing units lacking complete kitchen facilities: 1.1%
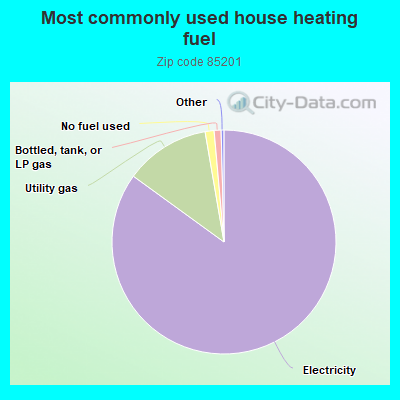
85.0%Electricity
12.3%Utility gas
1.3%No fuel used
1.0%Bottled, tank, or LP gas
Population in 1990: 40,017. Population change in the 1990s: +9,997 (+25.0%).
Place of birth for U.S.-born residents:
This state: 23,569
Northeast: 2,465
Midwest: 6,716
South: 3,057
West: 9,581
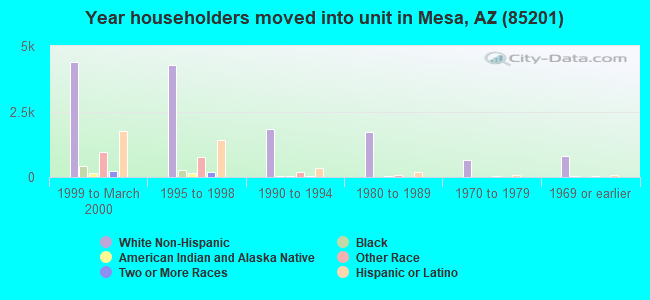
36% of the 85201 zip code residents lived in the same house 5 years ago. Out of people who lived in different houses, 67% lived in this county. Out of people who lived in different counties, 50% lived in Arizona.
78% of the 85201 zip code residents lived in the same house 1 year ago. Out of people who lived in different houses, 68% moved from this county. Out of people who lived in different houses, 7% moved from different county within same state. Out of people who lived in different houses, 16% moved from different state. Out of people who lived in different houses, 1% moved from abroad.
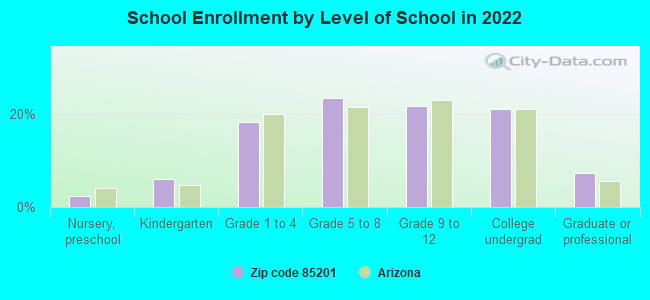
Private vs. public school enrollment:
Students in private schools in grades 1 to 8 (elementary and middle school): 449
Here:
8.4%
Arizona:
10.4%
Students in private schools in grades 9 to 12 (high school): 98
Here:
3.6%
Arizona:
8.8%
Students in private undergraduate colleges: 430
Here:
15.9%
Arizona:
13.1%
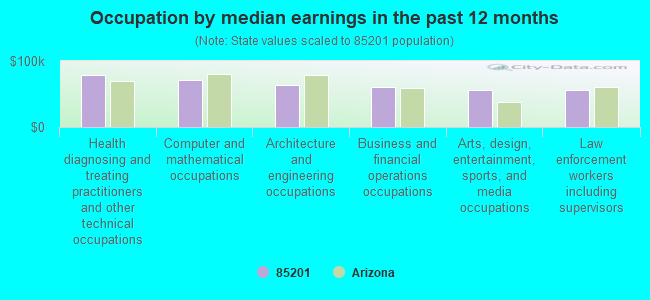
Occupation by median earnings in the past 12 months ($)
78,507Health diagnosing and treating practitioners and other technical occupations
70,834Computer and mathematical occupations
63,916Architecture and engineering occupations
60,653Business and financial operations occupations
56,191Arts, design, entertainment, sports, and media occupations
56,100Law enforcement workers including supervisors
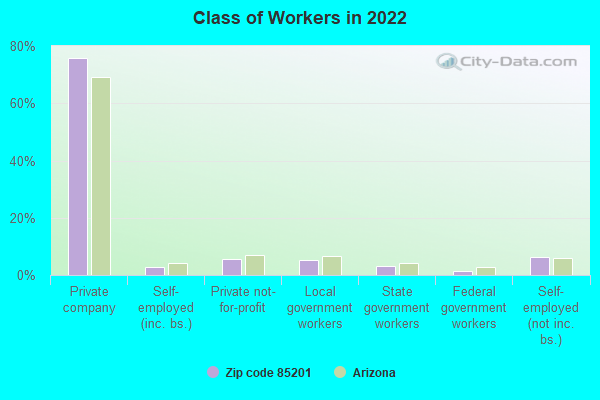
Companies with federal contracts located in this zip code:
BEST WESTERN MEZONA INN (250 W MAIN ST in MESA, AZ; small business)
$7,565 with Army for Lodging - Hotel/Motel. Signed on 2005-07-25. Completion date: 2005-08-26.
Top industries in this zip code by the number of employees in 2005:
Health Care and Social Assistance: General Medical and Surgical Hospitals (over 1000 employees: 1 establishment, 250-499 employees: 1 establishment)
2005 - 2018 National Fire Incident Reporting System (NFIRS) incidents
Based on the data from the years 2005 - 2018 the average number of fires per year is 1031. The highest number of reported fire incidents - 1,521 took place in 2006, and the least - 172 in 2017. The data has a dropping trend.
When looking into fire subcategories, the most incidents belonged to: Outside Fires (45.5%), and Structure Fires (34.7%).
Fire incident types reported to NFIRS in Zip Code 85201


+$1,214
-$7,013
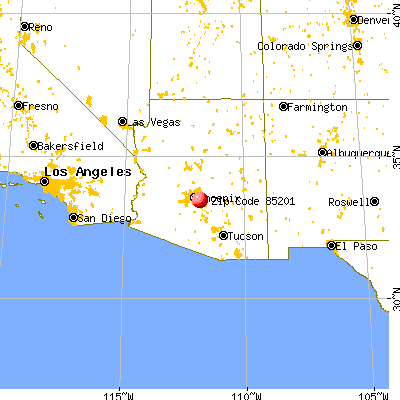
 Nearest zip codes: 85210, 85203, 85202, 85256, 85257, 85204.


 Based on the data from the years 2005 - 2018 the average number of fires per year is 1031. The highest number of reported fire incidents - 1,521 took place in 2006, and the least - 172 in 2017. The data has a dropping trend.
 When looking into fire subcategories, the most incidents belonged to: Outside Fires (45.5%), and Structure Fires (34.7%).