Estimated zip code population in 2022: 45,156 Zip code population in 2010: 39,858 Zip code population in 2000: 40,914
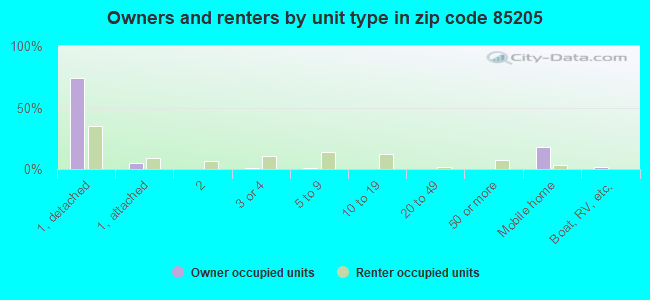
Houses and condos: 24,022 Renter-occupied apartments: 5,727
% of renters here:
28%
State:
33%
March 2022 cost of living index in zip code 85205: 99.7 (near average, U.S. average is 100)
Land area: 9.8 sq. mi. Water area: 0.0 sq. mi.
Population density: 4,615 people per square mile
(average).
OSM Map
General Map
Google Map
MSN Map
OSM Map
General Map
Google Map
MSN Map
OSM Map
General Map
Google Map
MSN Map
OSM Map
General Map
Google Map
MSN Map
Please wait while loading the map...
Real estate property taxes paid for housing units in 2022:
This zip code:
0.4% ($1,299)
Arizona:
0.4% ($1,786)
Median real estate property taxes paid for housing units with mortgages in 2022: $1,506 (0.4%) Median real estate property taxes paid for housing units with no mortgage in 2022: $914 (0.4%)
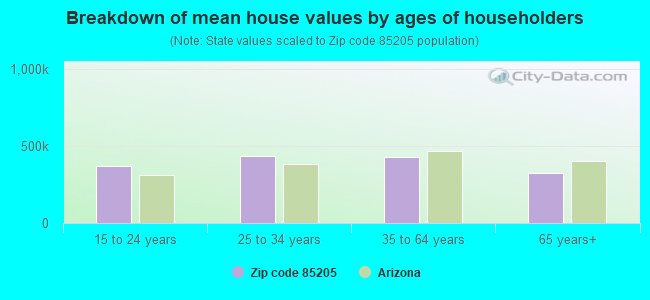
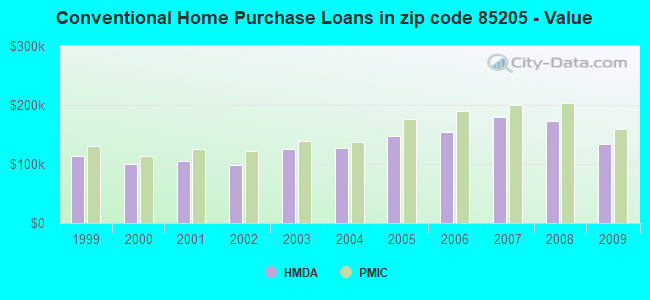
Estimated median house/condo value in 2022: $353,547
85205:
$353,547
Arizona:
$402,800
According to our research of Arizona and other state lists, there were 56 registered sex offenders living in 85205 zip code as of April 27, 2024. The ratio of all residents to sex offenders in zip code 85205 is 749 to 1. The ratio of registered sex offenders to all residents in this zip code is near the state average.
Median resident age:
This zip code:
50.1 years
Arizona median age:
38.8 years
Average household size:
This zip code:
2.2 people
Arizona:
2.5 people
Averages for the 2020 tax year for zip code 85205, filed in 2021:
Average Adjusted Gross Income (AGI) in 2020: $74,416 (Individual Income Tax Returns)
Here:
$74,416
State:
$73,499
Salary/wage: $58,558 (reported on 77.2% of returns)
Here:
$58,558
State:
$59,499
(% of AGI for various income ranges: 1102.0% for AGIs below $25k, 3736.8% for AGIs $25k-50k, 6774.7% for AGIs $50k-75k, 10180.1% for AGIs $75k-100k, 18800.0% for AGIs $100k-200k, 71811.9% for AGIs over 200k)
Taxable interest for individuals: $1,924 (reported on 27.0% of returns)
This zip code:
$1,924
Arizona:
$2,325
(% of AGI for various income ranges: 21.2% for AGIs below $25k, 18.7% for AGIs $25k-50k, 37.8% for AGIs $50k-75k, 64.8% for AGIs $75k-100k, 171.4% for AGIs $100k-200k, 1817.0% for AGIs over 200k)
Ordinary dividends: $5,758 (reported on 17.4% of returns)
Here:
$5,758
State:
$8,711
(% of AGI for various income ranges: 32.1% for AGIs below $25k, 39.2% for AGIs $25k-50k, 85.9% for AGIs $50k-75k, 150.9% for AGIs $75k-100k, 292.4% for AGIs $100k-200k, 3581.5% for AGIs over 200k)
Net capital gain/loss in AGI: +$31,706 (reported on 16.5% of returns)
Here:
+$31,706
State:
+$31,332
(% of AGI for various income ranges: 12.4% for AGIs below $25k, 24.1% for AGIs $25k-50k, 94.8% for AGIs $50k-75k, 180.6% for AGIs $75k-100k, 772.6% for AGIs $100k-200k, 33432.6% for AGIs over 200k)
Profit/loss from business: +$11,045 (reported on 14.5% of returns)
Here:
+$11,045
State:
+$13,214
(% of AGI for various income ranges: 110.9% for AGIs below $25k, 127.3% for AGIs $25k-50k, 242.6% for AGIs $50k-75k, 248.7% for AGIs $75k-100k, 589.4% for AGIs $100k-200k, 2284.4% for AGIs over 200k)
Taxable individual retirement arrangement distribution: $17,704 (reported on 10.9% of returns)
85205:
$17,704
Arizona:
$23,364
(% of AGI for various income ranges: 86.1% for AGIs below $25k, 121.3% for AGIs $25k-50k, 243.8% for AGIs $50k-75k, 469.0% for AGIs $75k-100k, 940.7% for AGIs $100k-200k, 2405.6% for AGIs over 200k)
Self-employed (Keogh) retirement plans: $17,450 (reported on 0.2% of returns)
85205:
$17,450
Arizona:
$26,938
(% of AGI for various income ranges: 49.9% for AGIs $100k-200k)
Total itemized deductions: $39,337 (reported on 9.4% of returns)
Here:
$39,337
State:
$36,308
(% of AGI for various income ranges: 74.8% for AGIs below $25k, 111.2% for AGIs $25k-50k, 350.7% for AGIs $50k-75k, 528.9% for AGIs $75k-100k, 1333.2% for AGIs $100k-200k, 13016.7% for AGIs over 200k)
Charity contributions: $18,441 (reported on 7.9% of returns)
Here:
$18,441
State:
$11,955
(% of AGI for various income ranges: 6.7% for AGIs below $25k, 22.4% for AGIs $25k-50k, 71.9% for AGIs $50k-75k, 111.6% for AGIs $75k-100k, 413.5% for AGIs $100k-200k, 7337.8% for AGIs over 200k)
Taxes paid: $6,179 (reported on 9.4% of returns)
85205:
$6,179
State:
$6,820
(% of AGI for various income ranges: 8.3% for AGIs below $25k, 18.1% for AGIs $25k-50k, 60.4% for AGIs $50k-75k, 101.8% for AGIs $75k-100k, 295.1% for AGIs $100k-200k, 1519.6% for AGIs over 200k)
Earned income credit: $2,028 (reported on 12.4% of returns)
Here:
$2,028
State:
$2,383
(% of AGI for various income ranges: 66.8% for AGIs below $25k, 54.4% for AGIs $25k-50k, 1.1% for AGIs $50k-75k)
Percentage of individuals using paid preparers for their 2020 taxes: 92.4%
Here:
92%
State:
93%
(% for various income ranges: 90.9% for AGIs below $25k, 92.8% for AGIs $25k-50k, 93.0% for AGIs $50k-75k, 92.7% for AGIs $75k-100k, 93.4% for AGIs $100k-200k, 95.1% for AGIs over 200k)
Averages for the 2012 tax year for zip code 85205, filed in 2013:
Average Adjusted Gross Income (AGI) in 2012: $57,308 (Individual Income Tax Returns)
Here:
$57,308
State:
$57,644
Salary/wage: $48,281 (reported on 78.2% of returns)
Here:
$48,281
State:
$47,932
(% of AGI for various income ranges: 66.3% for AGIs below $25k, 75.5% for AGIs $25k-50k, 72.8% for AGIs $50k-75k, 74.6% for AGIs $75k-100k, 74.8% for AGIs $100k-200k, 42.6% for AGIs over 200k)
Taxable interest for individuals: $1,877 (reported on 32.7% of returns)
This zip code:
$1,877
Arizona:
$2,064
(% of AGI for various income ranges: 1.4% for AGIs below $25k, 0.9% for AGIs $25k-50k, 0.6% for AGIs $50k-75k, 0.6% for AGIs $75k-100k, 0.8% for AGIs $100k-200k, 1.8% for AGIs over 200k)
Ordinary dividends: $3,943 (reported on 19.1% of returns)
Here:
$3,943
State:
$7,268
(% of AGI for various income ranges: 2.0% for AGIs below $25k, 1.2% for AGIs $25k-50k, 1.3% for AGIs $50k-75k, 1.0% for AGIs $75k-100k, 1.1% for AGIs $100k-200k, 1.5% for AGIs over 200k)
Net capital gain/loss in AGI: +$12,384 (reported on 15.6% of returns)
Here:
+$12,384
State:
+$15,530
(% of AGI for various income ranges: 0.2% for AGIs $25k-50k, 0.5% for AGIs $50k-75k, 0.7% for AGIs $75k-100k, 1.4% for AGIs $100k-200k, 11.5% for AGIs over 200k)
Profit/loss from business: +$11,449 (reported on 13.6% of returns)
Here:
+$11,449
State:
+$12,323
(% of AGI for various income ranges: 6.5% for AGIs below $25k, 2.4% for AGIs $25k-50k, 2.3% for AGIs $50k-75k, 1.8% for AGIs $75k-100k, 2.6% for AGIs $100k-200k, 2.4% for AGIs over 200k)
Taxable individual retirement arrangement distribution: $13,078 (reported on 12.9% of returns)
85205:
$13,078
Arizona:
$18,280
(% of AGI for various income ranges: 4.9% for AGIs below $25k, 3.2% for AGIs $25k-50k, 3.0% for AGIs $50k-75k, 3.4% for AGIs $75k-100k, 3.4% for AGIs $100k-200k, 1.4% for AGIs over 200k)
Self-employment retirement plans: $19,550 (reported on 0.4% of returns)
85205:
$19,550
Arizona:
$22,154
Total itemized deductions: $22,688 (21% of AGI, reported on 33.7% of returns)
Here:
$22,688
State:
$23,651
Here:
21.0% of AGI
State:
20.6% of AGI
(% of AGI for various income ranges: 12.3% for AGIs below $25k, 11.2% for AGIs $25k-50k, 14.0% for AGIs $50k-75k, 14.1% for AGIs $75k-100k, 15.0% for AGIs $100k-200k, 12.8% for AGIs over 200k)
Charity contributions: $5,871 (reported on 28.8% of returns)
Here:
$5,871
State:
$4,114
(% of AGI for various income ranges: 1.3% for AGIs below $25k, 1.5% for AGIs $25k-50k, 2.4% for AGIs $50k-75k, 2.5% for AGIs $75k-100k, 3.2% for AGIs $100k-200k, 4.8% for AGIs over 200k)
Taxes paid: $5,416 (reported on 33.5% of returns)
85205:
$5,416
State:
$6,509
(% of AGI for various income ranges: 1.9% for AGIs below $25k, 1.9% for AGIs $25k-50k, 2.7% for AGIs $50k-75k, 3.2% for AGIs $75k-100k, 3.9% for AGIs $100k-200k, 4.0% for AGIs over 200k)
Earned income credit: $2,098 (reported on 15.6% of returns)
Here:
$2,098
State:
$2,432
(% of AGI for various income ranges: 4.8% for AGIs below $25k, 0.9% for AGIs $25k-50k)
Percentage of individuals using paid preparers for their 2012 taxes: 48.4%
Here:
48%
State:
52%
(% for various income ranges: 44.7% for AGIs below $25k, 46.3% for AGIs $25k-50k, 50.9% for AGIs $50k-75k, 52.9% for AGIs $75k-100k, 55.2% for AGIs $100k-200k, 73.2% for AGIs over 200k)
Averages for the 2004 tax year for zip code 85205, filed in 2005:
Average Adjusted Gross Income (AGI) in 2004: $54,292 (Individual Income Tax Returns)
Here:
$54,292
State:
$50,097
Salary/wage: $44,000 (reported on 79.2% of returns)
Here:
$44,000
State:
$42,146
(% of AGI for various income ranges: 120.0% for AGIs below $10k, 66.2% for AGIs $10k-25k, 75.5% for AGIs $25k-50k, 78.6% for AGIs $50k-75k, 81.2% for AGIs $75k-100k, 47.5% for AGIs over 100k)
Taxable interest for individuals: $2,422 (reported on 46.7% of returns)
This zip code:
$2,422
Arizona:
$2,374
(% of AGI for various income ranges: 12.2% for AGIs below $10k, 3.4% for AGIs $10k-25k, 1.7% for AGIs $25k-50k, 1.5% for AGIs $50k-75k, 1.2% for AGIs $75k-100k, 2.3% for AGIs over 100k)
Taxable dividends: $2,665 (reported on 25.8% of returns)
Here:
$2,665
State:
$3,888
(% of AGI for various income ranges: 8.6% for AGIs below $10k, 2.3% for AGIs $10k-25k, 1.2% for AGIs $25k-50k, 1.2% for AGIs $50k-75k, 0.8% for AGIs $75k-100k, 1.1% for AGIs over 100k)
Net capital gain/loss: +$28,690 (reported on 22.1% of returns)
Here:
+$28,690
State:
+$17,569
(% of AGI for various income ranges: -1.5% for AGIs below $10k, 0.2% for AGIs $10k-25k, 0.7% for AGIs $25k-50k, 0.9% for AGIs $50k-75k, 1.4% for AGIs $75k-100k, 25.6% for AGIs over 100k)
Profit/loss from business: +$10,104 (reported on 13.4% of returns)
Here:
+$10,104
State:
+$11,088
(% of AGI for various income ranges: 7.2% for AGIs below $10k, 4.1% for AGIs $10k-25k, 2.4% for AGIs $25k-50k, 1.9% for AGIs $50k-75k, 2.2% for AGIs $75k-100k, 2.4% for AGIs over 100k)
IRA payment deduction: $2,896 (reported on 2.4% of returns)
85205:
$2,896
Arizona:
$3,023
(% of AGI for various income ranges: 0.4% for AGIs below $10k, 0.2% for AGIs $10k-25k, 0.2% for AGIs $25k-50k, 0.2% for AGIs $50k-75k, 0.1% for AGIs $75k-100k, 0.1% for AGIs over 100k)
Self-employed pension: $19,593 (reported on 0.5% of returns)
Here:
$19,593
Arizona:
$15,785
Total itemized deductions: $20,598 (22% of AGI, reported on 42.5% of returns)
Here:
$20,598
State:
$19,781
Here:
22.0% of AGI
State:
21.8% of AGI
(% of AGI for various income ranges: 29.3% for AGIs below $10k, 13.2% for AGIs $10k-25k, 16.3% for AGIs $25k-50k, 17.1% for AGIs $50k-75k, 18.4% for AGIs $75k-100k, 15.2% for AGIs over 100k)
Charity contributions deductions: $5,729 (6% of AGI, reported on 38.3% of returns)
Here:
$5,729
State:
$3,389
Here:
5.8% of AGI
State:
3.5% of AGI
(% of AGI for various income ranges: 2.0% for AGIs below $10k, 1.7% for AGIs $10k-25k, 2.2% for AGIs $25k-50k, 2.9% for AGIs $50k-75k, 3.2% for AGIs $75k-100k, 5.9% for AGIs over 100k)
Total tax: $8,566 (reported on 77.5% of returns)
85205:
$8,566
State:
$8,323
(% of AGI for various income ranges: 4.0% for AGIs below $10k, 3.9% for AGIs $10k-25k, 6.8% for AGIs $25k-50k, 8.6% for AGIs $50k-75k, 10.1% for AGIs $75k-100k, 18.1% for AGIs over 100k)
Earned income credit: $1,555 (reported on 10.6% of returns)
Here:
$1,555
State:
$1,786
Percentage of individuals using paid preparers for their 2004 taxes: 56.9%
Here:
57%
State:
60%
(% for various income ranges: 50.0% for AGIs below $10k, 58.9% for AGIs $10k-25k, 56.6% for AGIs $25k-50k, 57.6% for AGIs $50k-75k, 55.9% for AGIs $75k-100k, 65.0% for AGIs over 100k)
Likely homosexual households (counted as self-reported same-sex unmarried-partner households)
Lesbian couples: 0.0% of all households
Gay men: 0.0% of all households
Household received Food Stamps/SNAP in the past 12 months: 1,450 Household did not receive Food Stamps/SNAP in the past 12 months: 18,602
Women who had a birth in the past 12 months: 528 (310 now married, 215 unmarried) Women who did not have a birth in the past 12 months: 7,544 (3,424 now married, 4,103 unmarried)
Housing units in zip code 85205 with a mortgage: 8,075 (535 second mortgage, 6 home equity loan, 404 both second mortgage and home equity loan) Houses without a mortgage: 38
Median monthly owner costs for units with a mortgage: $1,505 Median monthly owner costs for units without a mortgage: $487
Residents with income below the poverty level in 2022:
This zip code:
9.5%
Whole state:
12.5%
Residents with income below 50% of the poverty level in 2022:
This zip code:
4.7%
Whole state:
6.0%
Median number of rooms in houses and condos:
Here:
5.5
State:
6.0
Median number of rooms in apartments:
Here:
4.1
State:
4.1
Notable locations in this zip code not listed on our city pages
Notable locations in zip code 85205: Arizona Girls Ranch (A), Sun Life Travel Trailer Park (B), Dreamland Villa Golf Course (C). Display/hide their locations on the map
Shopping Centers: Buckhorn Shopping Center (1), Velda Rose Shopping Center (2), Buckhorn Center Shopping Center (3). Display/hide their locations on the map
Churches in zip code 85205 include: First Baptist Church of Mesa (A), East University Church of God (B), Community of Christ (C), Church of the Master (D), Calvary Baptist Church (E), Brown Road Baptist Church (F), All Saints Catholic Church (G), The Church of Jesus Christ of Latter Day Saints (H), Saguaro Hills Baptist Church (I). Display/hide their locations on the map
4,972 married couples with children.
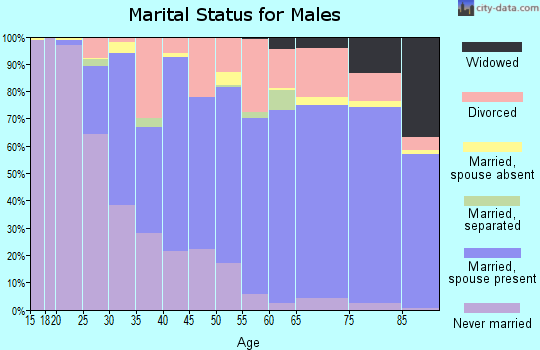
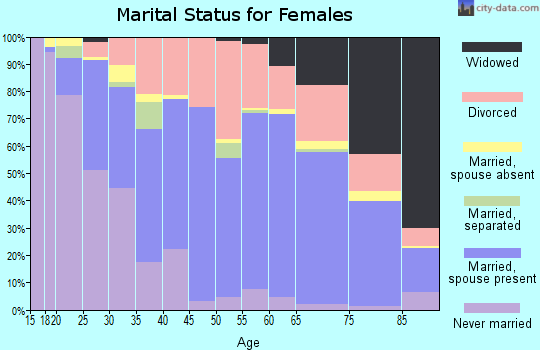
2,194 single-parent households (378 men, 1,816 women).
91.0% of residents of 85205 zip code speak English at home.
7.2% of residents speak Spanish at home (70% very well, 14% well, 5% not well, 11% not at all).
1.5% of residents speak other Indo-European language at home (84% very well, 13% well, 3% not well).
1.0% of residents speak Asian or Pacific Island language at home (64% very well, 17% well, 19% not well).
0.1% of residents speak other language at home (76% very well, 24% well).
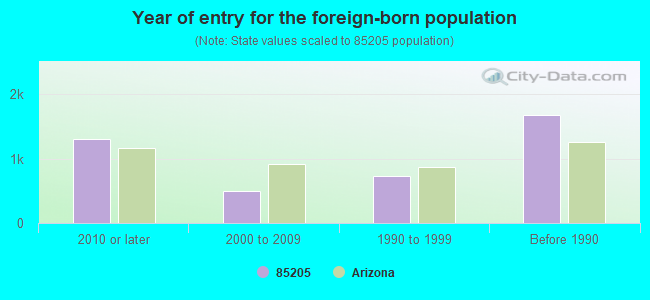
Foreign born population: 3,448 (7.6%) (54.9% of them are naturalized citizens)
Major facilities with environmental interests located in this zip code:
BARBARA BUSH ELEMENTARY SCHOOL (4925 E INGRAM in MESA, AZ)
(National Center for Education Statistics) - STATE ID-149 Conditionally Exempt Small Quantity Generators, less than 100 kg/month of hazardous waste (Resource Conservation and Recovery Act (tracking hazardous waste)) - notification Organizations: MESA UNIFIED SCHOOL DIST 4 (CONTACT/OWNER)
, MESA UNIFIED DISTRICT (SCHOOL DISTRICT)
Alternative names: MUSD 4 PUR OPER (BARBARA BUSH ELEM), MUSD 4 PUR OPER BARBARA BUSH ELEMENTARY
EDIES NU WASH (3820 EAST MAIN STREET in MESA, AZ)
(Resource Conservation and Recovery Act (tracking hazardous waste)) Business NAICS classification: ALL OTHER MISCELLANEOUS STORE RETAILERS (EXCEPT TOBACCO STORES). Organizations: AZTEC ELECTRONICS (CONTACT/OWNER)
, DUANE E NELSON OWNER (CONTACT/OWNER)
CAMBRIDGE ACADEMY EAST (1201 N. 66TH ST. in MESA, AZ)
(National Center for Education Statistics) - STATE ID-101 Organizations: CAMBRIDGE ACADEMY EAST, INC (SCHOOL DISTRICT)
ALL WESTERN OILS SALES AND SALES (2438 WOODHALL in MESA, AZ)
(Resource Conservation and Recovery Act (tracking hazardous waste)) Organizations: WALDEN J E (CONTACT/OWNER)
CARE MASTERS INC ALTA MESA CLNRS (1042 N HIGLEY RD STE101 in MESA, AZ)
(Resource Conservation and Recovery Act (tracking hazardous waste)) Organizations: CHARLES J FANNING (CONTACT/OWNER)
CONTINENTAL INDUSTRIES INC (5456 E MCDOWELL RD in MESA, AZ)
(Resource Conservation and Recovery Act (tracking hazardous waste)) Business NAICS classification: RELAY AND INDUSTRIAL CONTROL MANUFACTURING.
ECONO LUBE N TUNE 191 (4454 E UNIVERSITY DR in MESA, AZ)
(Resource Conservation and Recovery Act (tracking hazardous waste)) Business NAICS classification: ALL OTHER AUTOMOTIVE REPAIR AND MAINTENANCE. Organizations: DON ANZELMO (CONTACT/OWNER)
FAST 1 HOUR FOTO (1140 N HIGLEY RD BLDG 9 #103A in MESA, AZ)
(Resource Conservation and Recovery Act (tracking hazardous waste)) Organizations: FAST FOTO INC (CONTACT/OWNER)
(Resource Conservation and Recovery Act (tracking hazardous waste))
FRYS FOOD AND DRUG STORES (4440 EAST MAIN in MESA, AZ)
(Resource Conservation and Recovery Act (tracking hazardous waste)) Organizations: KROGER CO (CONTACT/OWNER)
Alternative names: FRED MEYER STORES INC, FRYES FOOD AND DRUG STORES
Housing units lacking complete plumbing facilities: 0.3% Housing units lacking complete kitchen facilities: 0.6%
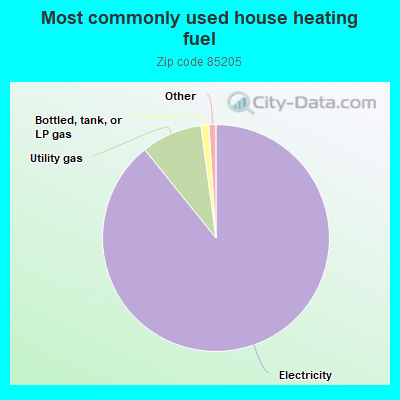
89.2%Electricity
8.7%Utility gas
1.1%Bottled, tank, or LP gas
Population in 1990: 35,676. Population change in the 1990s: +5,238 (+14.7%).
Place of birth for U.S.-born residents:
This state: 16,139
Northeast: 2,836
Midwest: 10,110
South: 3,521
West: 8,262
50% of the 85205 zip code residents lived in the same house 5 years ago. Out of people who lived in different houses, 55% lived in this county. Out of people who lived in different counties, 50% lived in Arizona.
89% of the 85205 zip code residents lived in the same house 1 year ago. Out of people who lived in different houses, 58% moved from this county. Out of people who lived in different houses, 8% moved from different county within same state. Out of people who lived in different houses, 26% moved from different state. Out of people who lived in different houses, 9% moved from abroad.
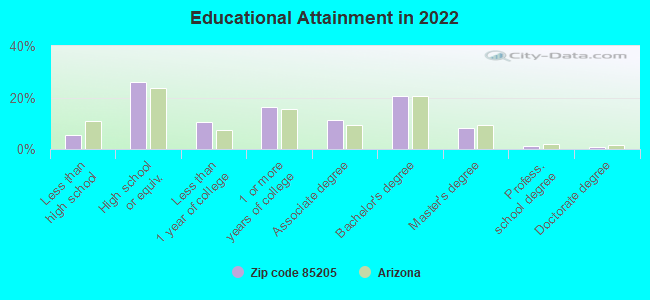
Private vs. public school enrollment:
Students in private schools in grades 1 to 8 (elementary and middle school): 289
Here:
8.9%
Arizona:
10.4%
Students in private schools in grades 9 to 12 (high school): 34
Here:
1.7%
Arizona:
8.8%
Students in private undergraduate colleges: 379
Here:
21.5%
Arizona:
13.1%
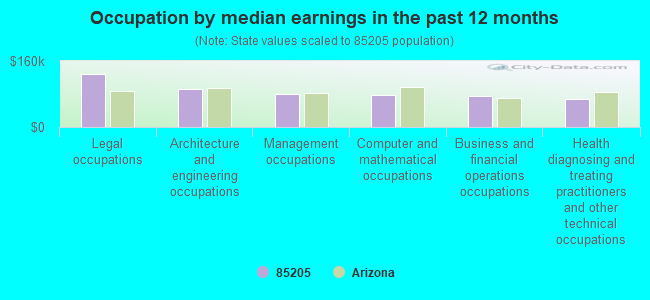
Occupation by median earnings in the past 12 months ($)
128,564Legal occupations
91,702Architecture and engineering occupations
79,621Management occupations
77,507Computer and mathematical occupations
74,186Business and financial operations occupations
67,425Health diagnosing and treating practitioners and other technical occupations
Companies with federal contracts located in this zip code (MESA, AZ):
CUBEN FIBER CORPORATION (4511 E IVY ST; small business) : $199,924 in 2 contractsfrom 2004 to 2005
$100,000 with Army for Textile Fabrics. Signed on 2004-01-12. Completion date: 2005-01-07.
$99,924 with Missile Defense Agency for Defense Missile and Space Systems -- Basic Research (R&D). Signed on 2005-03-31. Completion date: 2005-09-30.
INTERIOR RESOLUTIONS (5345 E MCLELLAN RD 65; small business) : $167,711 in 6 contractsfrom 2000 to 2003
Contracts for Office Furniture by Army Signed by year:2000: $33,642; 2001: $45,806; 2002: $70,300; 2003: $17,963; 2004: $0; 2005: $0; 2006: $0.
Biggest contracts:
$45,806 with Army for Office Furniture. Signed on 2001-09-21. Completion date: 2001-10-15.
$36,928, same as above.Signed on 2002-09-28. Completion date: 2002-09-30.
$33,642, same as above.Signed on 2000-04-28. Completion date: 2000-05-26.
$33,372, same as above.Signed on 2002-09-28. Completion date: 2002-10-31.
GECO INC (1754 N 48TH ST; small business)
$99,767 with U.S. Special Operations Command for Other Research and Development -- Advanced Development (R&D). Signed on 2005-11-08. Completion date: 2006-05-08.
SANAIR PRODUCTS (4840 E JASMINE ST , SUITE; small business) : $37,787 in 3 contractsfrom 2001 to 2003
$34,953 with Army for Bolts. Signed on 2001-09-29. Completion date: 2002-08-13.
$1,749 with Army for Hardware, Commercial. Signed on 2003-05-30. Completion date: 2004-04-08.
$1,085 with Army for Bushings, Rings, Shims, and Spacers. Signed on 2003-07-03. Completion date: 2004-01-02.
DENART ENTERPRISES (1805 N 66TH ST; small business)
$16,740 with Defense Logistics Agency for Miscellaneous Electric Power and Distribution Equipment. Signed on 2005-12-21. Completion date: 2006-05-30.
RACHAL, SHARON (6724 E ALBANY; small business)
$4,000 with Army for Recreation Site Maintenance Services (non-construction). Taking place in TX. Signed on 2004-03-29. Completion date: 2004-04-01.
Top industries in this zip code by the number of employees in 2005:
2003 - 2018 National Fire Incident Reporting System (NFIRS) incidents
Based on the data from the years 2003 - 2018 the average number of fires per year is 8. The highest number of reported fire incidents - 70 took place in 2018, and the least - 0 in 2005. The data has a growing trend.
When looking into fire subcategories, the most incidents belonged to: Structure Fires (40.6%), and Outside Fires (34.6%).
Fire incident types reported to NFIRS in Zip Code 85205

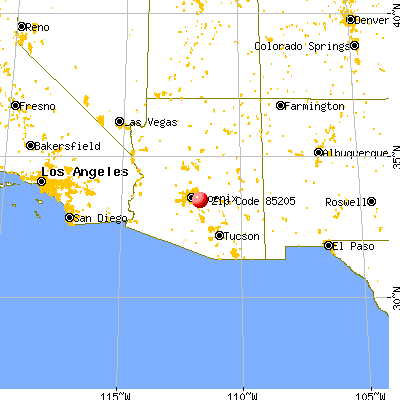


 Nearest zip codes: 85206, 85213, 85234, 85204, 85207, 85203.


 Based on the data from the years 2003 - 2018 the average number of fires per year is 8. The highest number of reported fire incidents - 70 took place in 2018, and the least - 0 in 2005. The data has a growing trend.
 When looking into fire subcategories, the most incidents belonged to: Structure Fires (40.6%), and Outside Fires (34.6%).