Estimated zip code population in 2022: 37,326 Zip code population in 2010: 33,154 Zip code population in 2000: 30,260
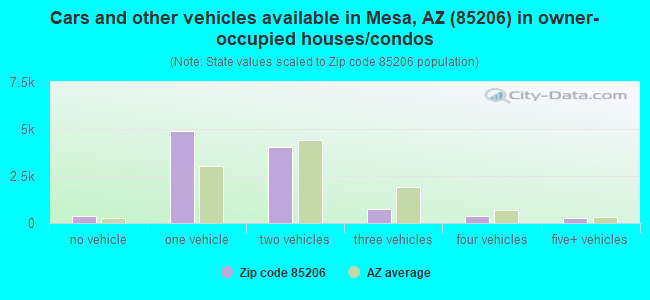
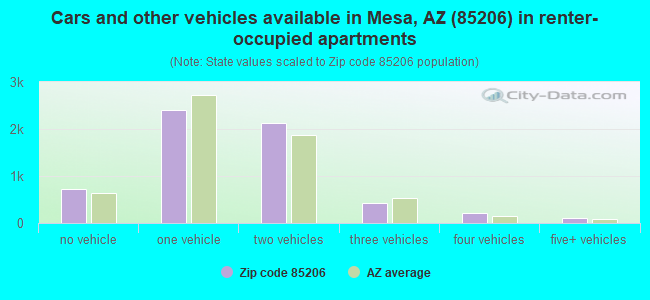
Houses and condos: 19,729 Renter-occupied apartments: 5,996
% of renters here:
36%
State:
33%
March 2022 cost of living index in zip code 85206: 101.1 (near average, U.S. average is 100)
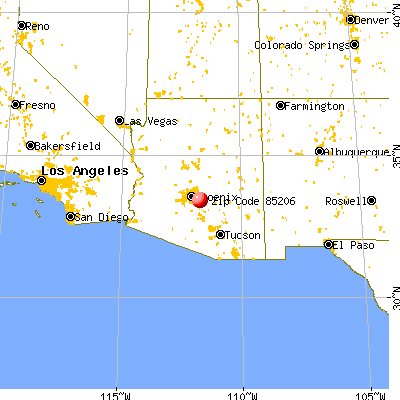
Land area: 9.6 sq. mi. Water area: 0.0 sq. mi.
Population density: 3,906 people per square mile
(average).
OSM Map
General Map
Google Map
MSN Map
OSM Map
General Map
Google Map
MSN Map
OSM Map
General Map
Google Map
MSN Map
OSM Map
General Map
Google Map
MSN Map
Please wait while loading the map...
Real estate property taxes paid for housing units in 2022:
This zip code:
0.4% ($1,412)
Arizona:
0.4% ($1,786)
Median real estate property taxes paid for housing units with mortgages in 2022: $1,464 (0.4%) Median real estate property taxes paid for housing units with no mortgage in 2022: $1,325 (0.4%)
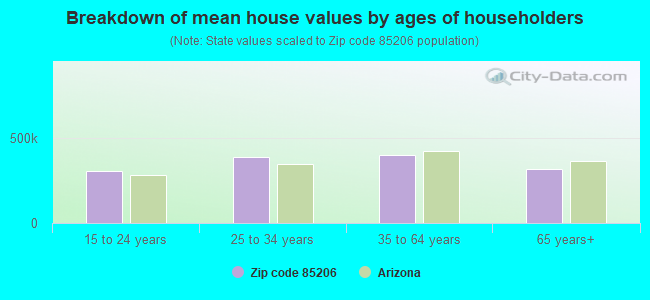
Estimated median house/condo value in 2022: $359,813
85206:
$359,813
Arizona:
$402,800
According to our research of Arizona and other state lists, there were 26 registered sex offenders living in 85206 zip code as of April 27, 2024. The ratio of all residents to sex offenders in zip code 85206 is 1,382 to 1. The ratio of registered sex offenders to all residents in this zip code is lower than the state average.
Median resident age:
This zip code:
46.8 years
Arizona median age:
38.8 years
Average household size:
This zip code:
2.2 people
Arizona:
2.5 people
Averages for the 2020 tax year for zip code 85206, filed in 2021:
Average Adjusted Gross Income (AGI) in 2020: $59,294 (Individual Income Tax Returns)
Here:
$59,294
State:
$73,499
Salary/wage: $49,614 (reported on 73.2% of returns)
Here:
$49,614
State:
$59,499
(% of AGI for various income ranges: 1059.0% for AGIs below $25k, 3639.1% for AGIs $25k-50k, 6472.6% for AGIs $50k-75k, 9776.3% for AGIs $75k-100k, 17540.8% for AGIs $100k-200k, 57162.2% for AGIs over 200k)
Taxable interest for individuals: $1,707 (reported on 28.4% of returns)
This zip code:
$1,707
Arizona:
$2,325
(% of AGI for various income ranges: 27.8% for AGIs below $25k, 25.6% for AGIs $25k-50k, 48.9% for AGIs $50k-75k, 110.7% for AGIs $75k-100k, 216.2% for AGIs $100k-200k, 2406.7% for AGIs over 200k)
Ordinary dividends: $5,643 (reported on 19.1% of returns)
Here:
$5,643
State:
$8,711
(% of AGI for various income ranges: 50.7% for AGIs below $25k, 53.5% for AGIs $25k-50k, 109.6% for AGIs $50k-75k, 210.8% for AGIs $75k-100k, 482.4% for AGIs $100k-200k, 6318.9% for AGIs over 200k)
Net capital gain/loss in AGI: +$17,874 (reported on 17.9% of returns)
Here:
+$17,874
State:
+$31,332
(% of AGI for various income ranges: 7.9% for AGIs below $25k, 37.0% for AGIs $25k-50k, 111.8% for AGIs $50k-75k, 246.8% for AGIs $75k-100k, 866.5% for AGIs $100k-200k, 44554.4% for AGIs over 200k)
Profit/loss from business: +$9,286 (reported on 13.9% of returns)
Here:
+$9,286
State:
+$13,214
(% of AGI for various income ranges: 110.1% for AGIs below $25k, 112.6% for AGIs $25k-50k, 187.9% for AGIs $50k-75k, 287.8% for AGIs $75k-100k, 619.8% for AGIs $100k-200k, 1368.9% for AGIs over 200k)
Taxable individual retirement arrangement distribution: $16,504 (reported on 13.2% of returns)
85206:
$16,504
Arizona:
$23,364
(% of AGI for various income ranges: 106.3% for AGIs below $25k, 147.8% for AGIs $25k-50k, 293.0% for AGIs $50k-75k, 587.2% for AGIs $75k-100k, 1100.3% for AGIs $100k-200k, 6124.4% for AGIs over 200k)
Self-employed (Keogh) retirement plans: $26,650 (reported on 0.1% of returns)
85206:
$26,650
Arizona:
$26,938
(% of AGI for various income ranges: 26.0% for AGIs $50k-75k)
Total itemized deductions: $32,186 (reported on 7.9% of returns)
Here:
$32,186
State:
$36,308
(% of AGI for various income ranges: 75.2% for AGIs below $25k, 125.8% for AGIs $25k-50k, 359.9% for AGIs $50k-75k, 588.1% for AGIs $75k-100k, 1282.3% for AGIs $100k-200k, 11631.1% for AGIs over 200k)
Charity contributions: $11,737 (reported on 6.5% of returns)
Here:
$11,737
State:
$11,955
(% of AGI for various income ranges: 6.8% for AGIs below $25k, 23.6% for AGIs $25k-50k, 60.5% for AGIs $50k-75k, 146.3% for AGIs $75k-100k, 403.7% for AGIs $100k-200k, 6034.4% for AGIs over 200k)
Taxes paid: $5,384 (reported on 7.8% of returns)
85206:
$5,384
State:
$6,820
(% of AGI for various income ranges: 8.4% for AGIs below $25k, 16.2% for AGIs $25k-50k, 50.5% for AGIs $50k-75k, 108.0% for AGIs $75k-100k, 280.2% for AGIs $100k-200k, 1662.2% for AGIs over 200k)
Earned income credit: $2,119 (reported on 11.7% of returns)
Here:
$2,119
State:
$2,383
(% of AGI for various income ranges: 66.5% for AGIs below $25k, 49.1% for AGIs $25k-50k, 0.8% for AGIs $50k-75k)
Percentage of individuals using paid preparers for their 2020 taxes: 92.8%
Here:
93%
State:
93%
(% for various income ranges: 91.5% for AGIs below $25k, 94.3% for AGIs $25k-50k, 92.6% for AGIs $50k-75k, 93.9% for AGIs $75k-100k, 92.3% for AGIs $100k-200k, 91.9% for AGIs over 200k)
Averages for the 2012 tax year for zip code 85206, filed in 2013:
Average Adjusted Gross Income (AGI) in 2012: $47,801 (Individual Income Tax Returns)
Here:
$47,801
State:
$57,644
Salary/wage: $41,642 (reported on 72.5% of returns)
Here:
$41,642
State:
$47,932
(% of AGI for various income ranges: 63.9% for AGIs below $25k, 72.1% for AGIs $25k-50k, 67.4% for AGIs $50k-75k, 66.1% for AGIs $75k-100k, 63.4% for AGIs $100k-200k, 31.4% for AGIs over 200k)
Taxable interest for individuals: $1,653 (reported on 34.9% of returns)
This zip code:
$1,653
Arizona:
$2,064
(% of AGI for various income ranges: 2.1% for AGIs below $25k, 1.0% for AGIs $25k-50k, 1.0% for AGIs $50k-75k, 1.0% for AGIs $75k-100k, 1.0% for AGIs $100k-200k, 1.7% for AGIs over 200k)
Ordinary dividends: $5,281 (reported on 21.6% of returns)
Here:
$5,281
State:
$7,268
(% of AGI for various income ranges: 3.2% for AGIs below $25k, 1.6% for AGIs $25k-50k, 2.0% for AGIs $50k-75k, 1.9% for AGIs $75k-100k, 2.5% for AGIs $100k-200k, 4.5% for AGIs over 200k)
Net capital gain/loss in AGI: +$5,662 (reported on 18.5% of returns)
Here:
+$5,662
State:
+$15,530
(% of AGI for various income ranges: 0.2% for AGIs $25k-50k, 0.5% for AGIs $50k-75k, 1.3% for AGIs $75k-100k, 2.4% for AGIs $100k-200k, 13.0% for AGIs over 200k)
Profit/loss from business: +$9,303 (reported on 12.3% of returns)
Here:
+$9,303
State:
+$12,323
(% of AGI for various income ranges: 5.8% for AGIs below $25k, 2.6% for AGIs $25k-50k, 1.6% for AGIs $50k-75k, 1.1% for AGIs $75k-100k, 2.4% for AGIs $100k-200k, 2.0% for AGIs over 200k)
Taxable individual retirement arrangement distribution: $12,602 (reported on 16.4% of returns)
85206:
$12,602
Arizona:
$18,280
(% of AGI for various income ranges: 5.9% for AGIs below $25k, 3.7% for AGIs $25k-50k, 3.9% for AGIs $50k-75k, 4.6% for AGIs $75k-100k, 4.5% for AGIs $100k-200k, 4.0% for AGIs over 200k)
Self-employment retirement plans: $15,725 (reported on 0.3% of returns)
85206:
$15,725
Arizona:
$22,154
Total itemized deductions: $20,278 (26% of AGI, reported on 31.1% of returns)
Here:
$20,278
State:
$23,651
Here:
25.7% of AGI
State:
20.6% of AGI
(% of AGI for various income ranges: 12.9% for AGIs below $25k, 11.0% for AGIs $25k-50k, 12.4% for AGIs $50k-75k, 13.4% for AGIs $75k-100k, 14.0% for AGIs $100k-200k, 17.7% for AGIs over 200k)
Charity contributions: $4,601 (reported on 26.6% of returns)
Here:
$4,601
State:
$4,114
(% of AGI for various income ranges: 1.4% for AGIs below $25k, 1.6% for AGIs $25k-50k, 2.4% for AGIs $50k-75k, 2.8% for AGIs $75k-100k, 3.1% for AGIs $100k-200k, 4.4% for AGIs over 200k)
Taxes paid: $4,126 (reported on 31.1% of returns)
85206:
$4,126
State:
$6,509
(% of AGI for various income ranges: 1.9% for AGIs below $25k, 1.8% for AGIs $25k-50k, 2.4% for AGIs $50k-75k, 2.9% for AGIs $75k-100k, 3.6% for AGIs $100k-200k, 3.5% for AGIs over 200k)
Earned income credit: $2,163 (reported on 14.1% of returns)
Here:
$2,163
State:
$2,432
(% of AGI for various income ranges: 4.5% for AGIs below $25k, 0.8% for AGIs $25k-50k)
Percentage of individuals using paid preparers for their 2012 taxes: 49.0%
Here:
49%
State:
52%
(% for various income ranges: 44.8% for AGIs below $25k, 48.2% for AGIs $25k-50k, 51.9% for AGIs $50k-75k, 52.8% for AGIs $75k-100k, 58.5% for AGIs $100k-200k, 73.7% for AGIs over 200k)
Averages for the 2004 tax year for zip code 85206, filed in 2005:
Average Adjusted Gross Income (AGI) in 2004: $47,763 (Individual Income Tax Returns)
Here:
$47,763
State:
$50,097
Salary/wage: $42,630 (reported on 71.5% of returns)
Here:
$42,630
State:
$42,146
(% of AGI for various income ranges: 121.7% for AGIs below $10k, 57.6% for AGIs $10k-25k, 69.0% for AGIs $25k-50k, 68.4% for AGIs $50k-75k, 70.0% for AGIs $75k-100k, 52.8% for AGIs over 100k)
Taxable interest for individuals: $2,670 (reported on 52.7% of returns)
This zip code:
$2,670
Arizona:
$2,374
(% of AGI for various income ranges: 47.0% for AGIs below $10k, 5.2% for AGIs $10k-25k, 3.0% for AGIs $25k-50k, 2.6% for AGIs $50k-75k, 2.2% for AGIs $75k-100k, 2.7% for AGIs over 100k)
Taxable dividends: $3,940 (reported on 31.0% of returns)
Here:
$3,940
State:
$3,888
(% of AGI for various income ranges: 43.5% for AGIs below $10k, 3.9% for AGIs $10k-25k, 2.5% for AGIs $25k-50k, 2.2% for AGIs $50k-75k, 1.9% for AGIs $75k-100k, 2.7% for AGIs over 100k)
Net capital gain/loss: +$7,030 (reported on 26.8% of returns)
Here:
+$7,030
State:
+$17,569
(% of AGI for various income ranges: -77.4% for AGIs below $10k, 0.4% for AGIs $10k-25k, 0.8% for AGIs $25k-50k, 1.2% for AGIs $50k-75k, 1.9% for AGIs $75k-100k, 12.7% for AGIs over 100k)
Profit/loss from business: +$9,202 (reported on 12.0% of returns)
Here:
+$9,202
State:
+$11,088
(% of AGI for various income ranges: -19.1% for AGIs below $10k, 3.3% for AGIs $10k-25k, 1.6% for AGIs $25k-50k, 1.8% for AGIs $50k-75k, 1.7% for AGIs $75k-100k, 3.4% for AGIs over 100k)
IRA payment deduction: $2,825 (reported on 2.3% of returns)
85206:
$2,825
Arizona:
$3,023
(% of AGI for various income ranges: 0.1% for AGIs $10k-25k, 0.2% for AGIs $25k-50k, 0.1% for AGIs $50k-75k, 0.1% for AGIs $75k-100k, 0.1% for AGIs over 100k)
Self-employed pension: $12,154 (reported on 0.3% of returns)
Here:
$12,154
Arizona:
$15,785
Total itemized deductions: $17,582 (26% of AGI, reported on 44.4% of returns)
Here:
$17,582
State:
$19,781
Here:
26.4% of AGI
State:
21.8% of AGI
(% of AGI for various income ranges: 293.0% for AGIs below $10k, 16.4% for AGIs $10k-25k, 14.8% for AGIs $25k-50k, 16.7% for AGIs $50k-75k, 17.0% for AGIs $75k-100k, 17.0% for AGIs over 100k)
Charity contributions deductions: $4,209 (6% of AGI, reported on 39.4% of returns)
Here:
$4,209
State:
$3,389
Here:
6.3% of AGI
State:
3.5% of AGI
(% of AGI for various income ranges: 1.7% for AGIs below $10k, 2.3% for AGIs $10k-25k, 2.3% for AGIs $25k-50k, 3.0% for AGIs $50k-75k, 3.1% for AGIs $75k-100k, 5.8% for AGIs over 100k)
Total tax: $5,502 (reported on 85.2% of returns)
85206:
$5,502
State:
$8,323
(% of AGI for various income ranges: 3.5% for AGIs below $10k, 3.7% for AGIs $10k-25k, 6.9% for AGIs $25k-50k, 8.7% for AGIs $50k-75k, 10.0% for AGIs $75k-100k, 16.5% for AGIs over 100k)
Earned income credit: $1,703 (reported on 7.4% of returns)
Here:
$1,703
State:
$1,786
Percentage of individuals using paid preparers for their 2004 taxes: 58.8%
Here:
59%
State:
60%
(% for various income ranges: 43.2% for AGIs below $10k, 58.7% for AGIs $10k-25k, 57.7% for AGIs $25k-50k, 60.2% for AGIs $50k-75k, 58.4% for AGIs $75k-100k, 66.4% for AGIs over 100k)
Likely homosexual households (counted as self-reported same-sex unmarried-partner households)
Lesbian couples: 0.0% of all households
Gay men: 0.0% of all households
Household received Food Stamps/SNAP in the past 12 months: 1,044 Household did not receive Food Stamps/SNAP in the past 12 months: 15,603
Women who had a birth in the past 12 months: 385 (270 now married, 116 unmarried) Women who did not have a birth in the past 12 months: 6,828 (2,648 now married, 4,183 unmarried)
Housing units in zip code 85206 with a mortgage: 5,446 (295 second mortgage, 278 both second mortgage and home equity loan) Houses without a mortgage: 39
Median monthly owner costs for units with a mortgage: $1,483 Median monthly owner costs for units without a mortgage: $480
Residents with income below the poverty level in 2022:
This zip code:
8.9%
Whole state:
12.5%
Residents with income below 50% of the poverty level in 2022:
This zip code:
4.6%
Whole state:
6.0%
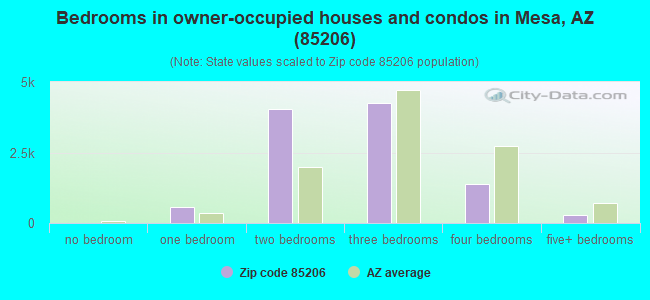
Median number of rooms in houses and condos:
Here:
5.4
State:
6.0
Median number of rooms in apartments:
Here:
3.9
State:
4.1
Notable locations in this zip code not listed on our city pages
Notable locations in zip code 85206: Apache Substation (A), Sunland Village Golf Course (B), City of Mesa Southeast Water Reclamation Plant (C), Rural / Metro Fire Department Station 857 (D), Mesa Fire Department Station 205 (E). Display/hide their locations on the map
Shopping Centers: Apache Plaza Shopping Center (1), Cooper Village Shopping Center (2), Mesa Pavillions Shopping Center (3), Superstition Springs Center Shopping Center (4), Superstition Springs Power Center Shopping Center (5). Display/hide their locations on the map
Churches in zip code 85206 include: East Mesa Christian Church (A), Cornerstone Church (B), Community Church of New Thought (C), The Church of Jesus Christ of Latter Day Saints (D), Newlife Foursquare Church Greenfield (E), New Vision Christian Fellowship Church (F), Holy Cross Catholic Church (G). Display/hide their locations on the map
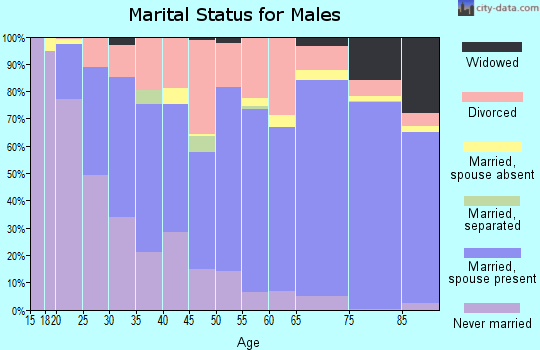
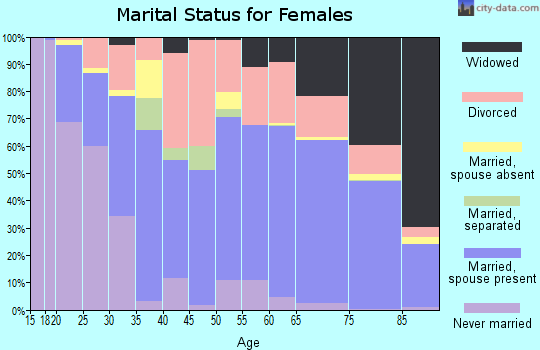
3,650 married couples with children.
2,003 single-parent households (449 men, 1,554 women).
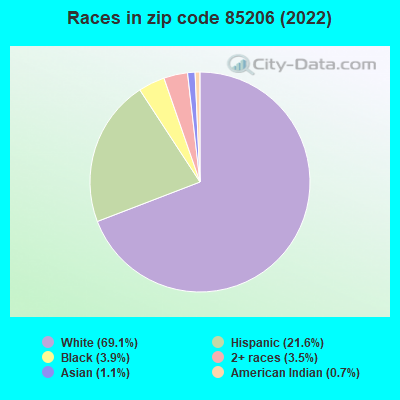
86.5% of residents of 85206 zip code speak English at home.
11.1% of residents speak Spanish at home (72% very well, 13% well, 7% not well, 7% not at all).
1.7% of residents speak other Indo-European language at home (83% very well, 13% well, 4% not well).
0.6% of residents speak Asian or Pacific Island language at home (59% very well, 35% well, 6% not well).
0.6% of residents speak other language at home (87% very well, 7% not well, 6% not at all).
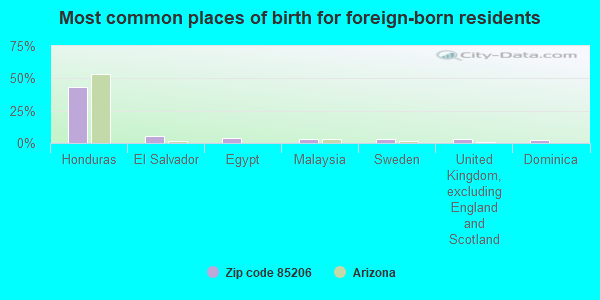
Foreign born population: 3,188 (8.5%) (49.7% of them are naturalized citizens)
Major facilities with environmental interests located in this zip code:
COURY BUICK-PONTIAC-GMC (6315 E AUTO PARK DR in MESA, AZ)
STATE MASTER (Arizona's Tracking Of The Environment) - AZURITE-6579, AIR PROGRAM Conditionally Exempt Small Quantity Generators, less than 100 kg/month of hazardous waste (Resource Conservation and Recovery Act (tracking hazardous waste)) - notification Organizations: COURY BUICK PONTIAC GMC LLC (CONTACT/GENERAL)
Alternative names: COURY BUICK PONTIAC GMC LLC
VALLEY LUTHERN HOSPITAL (6644 BAYWOOD AVENUE in MESA, AZ)
HAZARDOUS WASTE BIENNIAL REPORTER (Resource Conservation and Recovery Act (tracking hazardous waste)) Large Quantity Generators, more that 1000 kg of hazardous waste/month (Resource Conservation and Recovery Act (tracking hazardous waste)) - notification (Resource Conservation and Recovery Act (tracking hazardous waste)) Organizations: DON EVANS (CONTACT/OPERATOR)
, BANNER HEALTH (CONTACT/OWNER)
Alternative names: VALLEY LUTHERAN HOSP
AZTEC ACADEMY (4710 E. BASELINE ROAD in MESA, AZ)
(National Center for Education Statistics) - STATE ID-831 Organizations: PEACH SPRINGS UNIFIED DISTRICT (SCHOOL DISTRICT)
EXCALIBUR CHARTER SCHOOL-CAMELOT (3707 EAST SOUTHERN AVENUE in MESA, AZ)
(National Center for Education Statistics) - STATE ID-002 Organizations: EXCALIBUR CHARTER SCHOOL INC (SCHOOL DISTRICT)
FRANKLIN SOUTH (5005 E SOUTHERN in MESA, AZ)
(National Center for Education Statistics) - STATE ID-154 Organizations: MESA UNIFIED DISTRICT (SCHOOL DISTRICT)
GOLDFIELD ACADEMY (4710 E. BASELINE in MESA, AZ)
(National Center for Education Statistics) - STATE ID-822 Organizations: PEACH SPRINGS UNIFIED DISTRICT (SCHOOL DISTRICT)
WILLIAMS AIR FORCE BASE (6001 S POWER BLDG 1 in MESA, AZ) . Federal Facility. U.S. AIR FORCE
SUPERFUND NPL (Superfund database) COMPLIANCE ACTIVITY (Tracking inspections of insecticide, fungicide, and rodenticide, and toxic substances) RAD NPL (Radiation and radioactivity tracking) Conditionally Exempt Small Quantity Generators, less than 100 kg/month of hazardous waste (Resource Conservation and Recovery Act (tracking hazardous waste)) TSD (Resource Conservation and Recovery Act (tracking hazardous waste)) - notification Organizations: HQAF BASE DISPOSAL AGENCY (CONTACT/OWNER)
Alternative names: U S A F WILLIAMS AFB, U S A F WILLIAMS AFB AFCEE/ ERB, U S A F WILLIAMS AIR FORCE BASE, USAF WILLIAMS, USAF WILLIAMS AFB
BOEING AEROSPACE SUPPORT COMPANY (6250 SOUTH TAXIWAY CIRCLE in MESA, AZ) . Federal Facility. U.S. AIR FORCE
Large Quantity Generators, more that 1000 kg of hazardous waste/month (Resource Conservation and Recovery Act (tracking hazardous waste)) Business NAICS classification: AIRCRAFT MANUFACTURING.; OTHER AIRCRAFT PARTS AND AUXILIARY EQUIPMENT MANUFACTURING. Organizations: BOEING AEROPSACE SUPPORT CTR (CONTACT/OPERATOR)
, WILLIAMS GATEWAY AIRPORT (CONTACT/OWNER)
Alternative names: BOEING CO MDASCO DIV F18 DEDICATED REPA, BOEING COMPANY MDASCO DIVISION F18 DEDICATED REPAIR
ADOT MESA MAINTENANCE YARD (1540 S RECKER RD in MESA, AZ)
COUNTRY CLUB CLEANERS (840 WEST SOUTHERN AVENUE in MESA, AZ)
Conditionally Exempt Small Quantity Generators, less than 100 kg/month of hazardous waste (Resource Conservation and Recovery Act (tracking hazardous waste)) Organizations: JAYESH PATEL (CONTACT/OPERATOR)
, MEHBOOB PATHARI (CONTACT/OWNER)
, JAYESH B PATEL (CONTACT/OWNER)
Alternative names: COUNTY CLUB CLEANERS
D AND R ENTERPRISES INC (6001 S POWER BLDG 1090 in MESA, AZ)
(Resource Conservation and Recovery Act (tracking hazardous waste)) Organizations: CHRISTOPHER J ROBINSON (CONTACT/OWNER)
ECONO LUBE N TUNE 264 (6757 E SOUTHERN AVE in MESA, AZ)
(Resource Conservation and Recovery Act (tracking hazardous waste)) Business NAICS classification: ALL OTHER AUTOMOTIVE REPAIR AND MAINTENANCE. Organizations: WON J KANG (CONTACT/OWNER)
Housing units lacking complete plumbing facilities: 0.2% Housing units lacking complete kitchen facilities: 1.1%
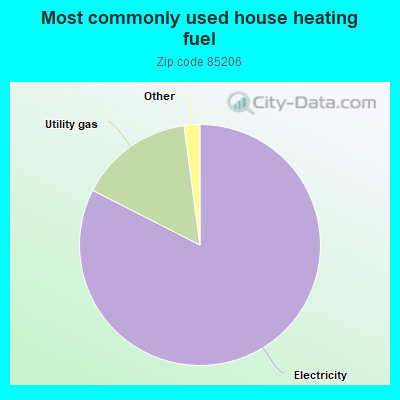
82.5%Electricity
15.4%Utility gas
0.8%No fuel used
0.6%Bottled, tank, or LP gas
Population in 1990: 21,274. Population change in the 1990s: +8,986 (+42.2%).
Place of birth for U.S.-born residents:
This state: 13,193
Northeast: 2,587
Midwest: 8,516
South: 2,716
West: 6,774
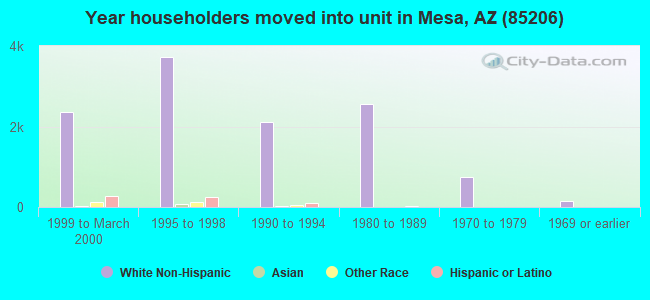
47% of the 85206 zip code residents lived in the same house 5 years ago. Out of people who lived in different houses, 60% lived in this county. Out of people who lived in different counties, 50% lived in Arizona.
84% of the 85206 zip code residents lived in the same house 1 year ago. Out of people who lived in different houses, 47% moved from this county. Out of people who lived in different houses, 11% moved from different county within same state. Out of people who lived in different houses, 37% moved from different state. Out of people who lived in different houses, 4% moved from abroad.
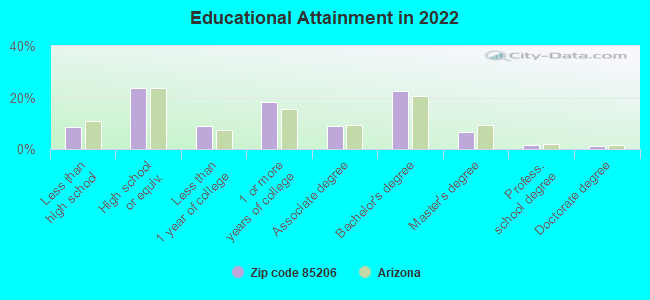
Private vs. public school enrollment:
Students in private schools in grades 1 to 8 (elementary and middle school): 155
Here:
5.9%
Arizona:
10.4%
Students in private schools in grades 9 to 12 (high school): 71
Here:
5.3%
Arizona:
8.8%
Students in private undergraduate colleges: 250
Here:
16.2%
Arizona:
13.1%
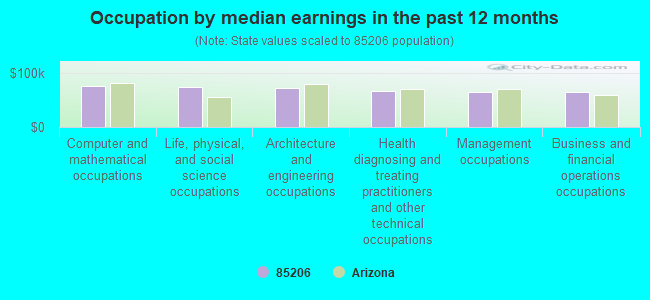
Occupation by median earnings in the past 12 months ($)
76,008Computer and mathematical occupations
75,131Life, physical, and social science occupations
72,477Architecture and engineering occupations
66,373Health diagnosing and treating practitioners and other technical occupations
65,157Management occupations
64,455Business and financial operations occupations
Companies with federal contracts located in this zip code (MESA, AZ):
DIAMONDWARE LTD (4856 E BASELINE RD STE 101; small business) : $3,205,466 in 5 contractsfrom 2003 to 2005
Contracts for ADP Software by Navy Signed by year:2000: $0; 2001: $0; 2002: $0; 2003: $208,030; 2004: $2,109,418; 2005: $888,018; 2006: $0.
Biggest contracts:
$888,018 with Navy for ADP Software. Taking place in MD. Signed on 2005-08-24. Completion date: 2005-09-01.
$804,658, same as above.Signed on 2004-11-04. Completion date: 2004-08-13.
$704,580, same as above.Signed on 2004-01-22. Completion date: 2004-02-17.
$600,180, same as above.Signed on 2004-07-15. Completion date: 2004-08-13.
RISE INC (4542 E INVERNESS AVE) : $281,276 in 5 contractsfrom 2001 to 2002
Contracts for Custodial Janitorial Services by Army Signed by year:2000: $0; 2001: $144,996; 2002: $136,280; 2003: $0; 2004: $0; 2005: $0; 2006: $0.
Biggest contracts:
$144,996 with Army for Custodial Janitorial Services. Taking place in OR. Signed on 2001-02-01. Completion date: 2002-01-31.
$87,948, same as above.Signed on 2002-09-26. Completion date: 2004-09-29.
$24,166, same as above.Signed on 2002-03-12. Completion date: 2002-03-31.
$12,083, same as above.Signed on 2002-07-22. Completion date: 2002-07-31.
THE ARIZONA GOLF RESORT & CONF (425 S POWER RD) : $149,417 in 4 contractsfrom 2004 to 2006
$75,242 with Army for Civilian Personnel Recruitment. Signed on 2006-04-14. Completion date: 2006-06-01.
$48,620 with Army for Lodging - Hotel/Motel. Signed on 2004-04-21. Completion date: 2004-04-15.
$17,500, same as above.Signed on 2006-02-01. Completion date: 2006-04-28.
$8,055 with Army for Other Education and Training Services. Taking place in AL. Signed on 2005-02-18. Completion date: 2005-06-30.
CABLE AMERICA CORPORATION (MO) (4120 E VALLEY AUTO DRIVE; small business) : $141,226 in 13 contractsfrom 1999 to 2006
Contracts for Installation of Equipment -- Fiber Optics Materials, Components, Assemblies, and Accessories, Communications Services, Electric Services by Army, Department of Veterans Affairs Signed by year:2000: $0; 2001: $0; 2002: $0; 2003: $14,255; 2004: $20,855; 2005: $66,228; 2006: $9,000.
Biggest contracts:
$56,620 with Army for Installation of Equipment -- Fiber Optics Materials, Components, Assemblies, and Accessories. Taking place in MO. Signed on 2005-10-27. Completion date: 2005-09-30.
$30,888 with Army for Communications Services. Taking place in MO. Signed on 1999-11-08. Completion date: 1999-11-08.
$15,355 with Army for Installation of Equipment -- Fiber Optics Materials, Components, Assemblies, and Accessories. Taking place in MO. Signed on 2004-09-24. Completion date: 2004-10-08.
$9,255 with Department of Veterans Affairs for Electric Services. Taking place in CA. Signed on 2003-10-01. Completion date: 2004-09-30.
LA QUINTA INNS INC (6530 E SUPERSTITION SPRING) : $124,912 in 4 contractsin 2004
$96,444 with Army for Lodging - Hotel/Motel. Signed on 2004-06-14. Completion date: 2004-09-30.
$14,527, same as above.Signed on 2004-04-21. Completion date: 2004-04-27.
$9,023 with Army for Lodging - Hotel/Motel. Taking place in CA. Signed on 2004-05-17. Completion date: 2004-05-17.
$4,918 with Army for Lodging - Hotel/Motel. Signed on 2004-05-25. Completion date: 2004-04-27.
SUITES OF ARIZONA DBA COUNTRY (6650 E SUPERSTITION SPRING; small business) : $44,275 in 6 contractsin 2004
Contracts for Lodging - Hotel/Motel by Army Signed by year:2000: $0; 2001: $0; 2002: $0; 2003: $0; 2004: $44,275; 2005: $0; 2006: $0.
Biggest contracts:
$28,204 with Army for Lodging - Hotel/Motel. Signed on 2004-11-02. Completion date: 2004-10-18.
$6,952, same as above.Signed on 2004-04-20. Completion date: 2004-04-27.
$5,402, same as above.Signed on 2004-09-14. Completion date: 2004-09-19.
$3,950, same as above.Signed on 2004-05-13. Completion date: 2004-04-27.
C H A MESA LLC (6347 E SOUTHERN AVE; small business) : $8,713 in 2 contractsin 2003
$6,777 with Army for Lodging - Hotel/Motel. Signed on 2003-01-21. Completion date: 2003-01-20.
$1,936 with Army for Lodging - Hotel/Motel. Taking place in CA. Signed on 2003-01-23. Completion date: 2003-01-23.
Top industries in this zip code by the number of employees in 2005:
Health Care and Social Assistance: General Medical and Surgical Hospitals (over 1000 employees: 1 establishment)
2003 - 2018 National Fire Incident Reporting System (NFIRS) incidents
Based on the data from the years 2003 - 2018 the average number of fires per year is 10. The highest number of reported fire incidents - 73 took place in 2018, and the least - 0 in 2011. The data has a growing trend.
When looking into fire subcategories, the most incidents belonged to: Structure Fires (44.6%), and Mobile Property/Vehicle Fires (30.1%).
Fire incident types reported to NFIRS in Zip Code 85206


 Nearest zip codes: 85205, 85234, 85296, 85204, 85213, 85209.
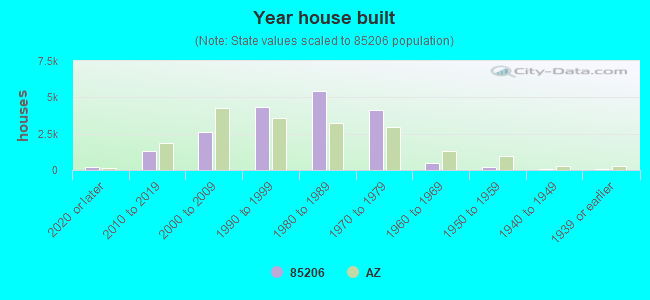


 Based on the data from the years 2003 - 2018 the average number of fires per year is 10. The highest number of reported fire incidents - 73 took place in 2018, and the least - 0 in 2011. The data has a growing trend.
 When looking into fire subcategories, the most incidents belonged to: Structure Fires (44.6%), and Mobile Property/Vehicle Fires (30.1%).