Estimated zip code population in 2022: 38,501
Zip code population in 2010: 34,762
Zip code population in 2000: 42,055
Houses and condos: 19,181
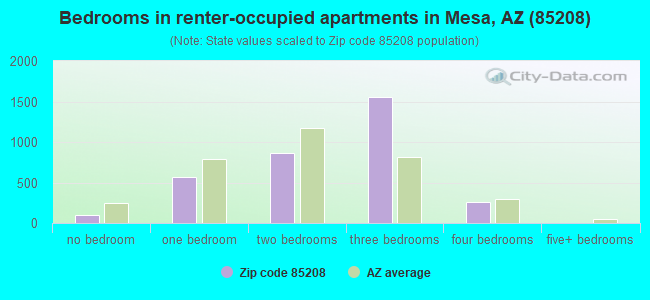
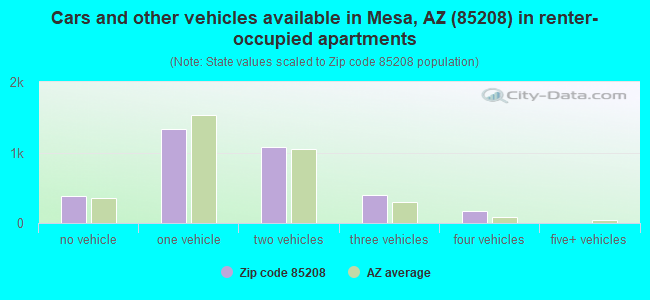
Renter-occupied apartments: 3,368
% of renters here:
21%State:
33%
March 2022 cost of living index in zip code 85208: 99.3
(near average, U.S. average is 100)
Land area: 9.0
sq. mi.
Water area: 0.1
sq. mi.
Population density: 4,286 people per square mile (average).
OSM Map
General Map
Google Map
MSN Map
OSM Map
General Map
Google Map
MSN Map
OSM Map
General Map
Google Map
MSN Map
OSM Map
General Map
Google Map
MSN Map
Please wait while loading the map...
Real estate property taxes paid for housing units in 2022:
This zip code:
0.4% ($1,056)Arizona:
0.4% ($1,786)
Median real estate property taxes paid for housing units with mortgages in 2022: $1,252 (0.4%)
Median real estate property taxes paid for housing units with no mortgage in 2022: $806 (0.5%)
Profiles of local businesses
Business Search - 14 Million verified businesses
Males: 18,533 Females: 19,969
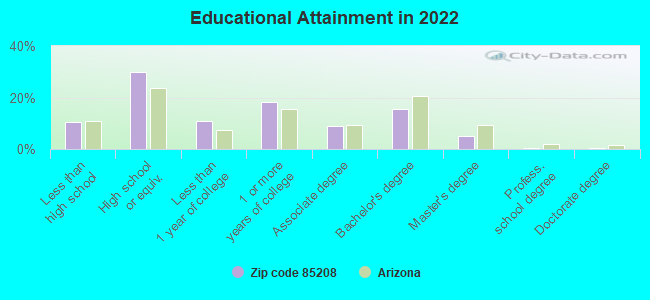
For population 25 years and over in 85208:
High school or higher: 88.9%Bachelor's degree or higher: 21.4%Graduate or professional degree: 6.0%Unemployed: 5.2%Mean travel time to work (commute): 23.9 minutes
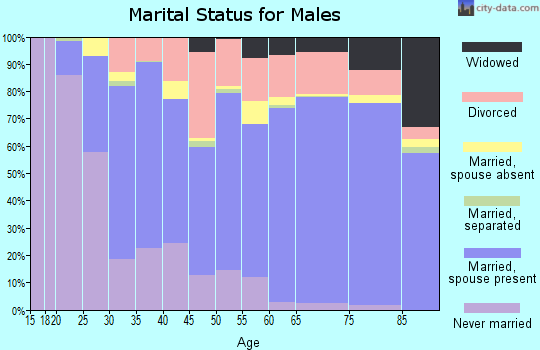
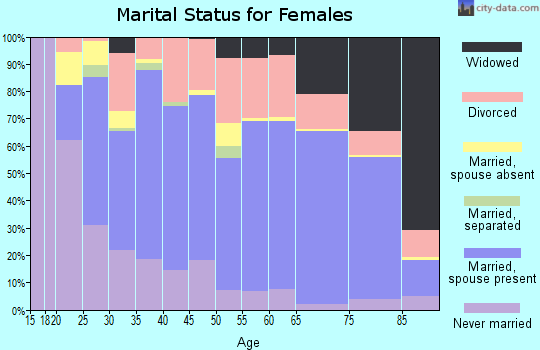
For population 15 years and over in 85208:
Never married: 26.6%Now married: 48.8%Separated: 1.9%Widowed: 8.2%Divorced: 14.4%
Zip code 85208 compared to state average:
Black race population percentage below state average. Median age above state average. Renting percentage below state average. Length of stay since moving in significantly above state average. 25,472 66.2% White 9,085 23.6% Hispanic or Latino 1,812 4.7% Two or more races 952 2.5% Black 749 1.9% Asian 377 1.0% American Indian 42 0.1% Native Hawaiian and Other 10 0.03% Some other race
Data:
Median household income ($)
Median household income (% change since 2000)
Household income diversity
Ratio of average income to average house value (%)
Ratio of average income to average rent
Median household income ($) - White
Median household income ($) - Black or African American
Median household income ($) - Asian
Median household income ($) - Hispanic or Latino
Median household income ($) - American Indian and Alaska Native
Median household income ($) - Multirace
Median household income ($) - Other Race
Median household income for houses/condos with a mortgage ($)
Median household income for apartments without a mortgage ($)
Races - White alone (%)
Races - White alone (% change since 2000)
Races - Black alone (%)
Races - Black alone (% change since 2000)
Races - American Indian alone (%)
Races - American Indian alone (% change since 2000)
Races - Asian alone (%)
Races - Asian alone (% change since 2000)
Races - Hispanic (%)
Races - Hispanic (% change since 2000)
Races - Native Hawaiian and Other Pacific Islander alone (%)
Races - Native Hawaiian and Other Pacific Islander alone (% change since 2000)
Races - Two or more races (%)
Races - Two or more races (% change since 2000)
Races - Other race alone (%)
Races - Other race alone (% change since 2000)
Racial diversity
Unemployment (%)
Unemployment (% change since 2000)
Unemployment (%) - White
Unemployment (%) - Black or African American
Unemployment (%) - Asian
Unemployment (%) - Hispanic or Latino
Unemployment (%) - American Indian and Alaska Native
Unemployment (%) - Multirace
Unemployment (%) - Other Race
Population density (people per square mile)
Population - Males (%)
Population - Females (%)
Population - Males (%) - White
Population - Males (%) - Black or African American
Population - Males (%) - Asian
Population - Males (%) - Hispanic or Latino
Population - Males (%) - American Indian and Alaska Native
Population - Males (%) - Multirace
Population - Males (%) - Other Race
Population - Females (%) - White
Population - Females (%) - Black or African American
Population - Females (%) - Asian
Population - Females (%) - Hispanic or Latino
Population - Females (%) - American Indian and Alaska Native
Population - Females (%) - Multirace
Population - Females (%) - Other Race
Coronavirus confirmed cases (Apr 27, 2024)
Deaths caused by coronavirus (Apr 27, 2024)
Coronavirus confirmed cases (per 100k population) (Apr 27, 2024)
Deaths caused by coronavirus (per 100k population) (Apr 27, 2024)
Daily increase in number of cases (Apr 27, 2024)
Weekly increase in number of cases (Apr 27, 2024)
Cases doubled (in days) (Apr 27, 2024)
Hospitalized patients (Apr 18, 2022)
Negative test results (Apr 18, 2022)
Total test results (Apr 18, 2022)
COVID Vaccine doses distributed (per 100k population) (Sep 19, 2023)
COVID Vaccine doses administered (per 100k population) (Sep 19, 2023)
COVID Vaccine doses distributed (Sep 19, 2023)
COVID Vaccine doses administered (Sep 19, 2023)
Likely homosexual households (%)
Likely homosexual households (% change since 2000)
Likely homosexual households - Lesbian couples (%)
Likely homosexual households - Lesbian couples (% change since 2000)
Likely homosexual households - Gay men (%)
Likely homosexual households - Gay men (% change since 2000)
Cost of living index
Median gross rent ($)
Median contract rent ($)
Median monthly housing costs ($)
Median house or condo value ($)
Median house or condo value ($ change since 2000)
Mean house or condo value by units in structure - 1, detached ($)
Mean house or condo value by units in structure - 1, attached ($)
Mean house or condo value by units in structure - 2 ($)
Mean house or condo value by units in structure by units in structure - 3 or 4 ($)
Mean house or condo value by units in structure - 5 or more ($)
Mean house or condo value by units in structure - Boat, RV, van, etc. ($)
Mean house or condo value by units in structure - Mobile home ($)
Median house or condo value ($) - White
Median house or condo value ($) - Black or African American
Median house or condo value ($) - Asian
Median house or condo value ($) - Hispanic or Latino
Median house or condo value ($) - American Indian and Alaska Native
Median house or condo value ($) - Multirace
Median house or condo value ($) - Other Race
Median resident age
Resident age diversity
Median resident age - Males
Median resident age - Females
Median resident age - White
Median resident age - Black or African American
Median resident age - Asian
Median resident age - Hispanic or Latino
Median resident age - American Indian and Alaska Native
Median resident age - Multirace
Median resident age - Other Race
Median resident age - Males - White
Median resident age - Males - Black or African American
Median resident age - Males - Asian
Median resident age - Males - Hispanic or Latino
Median resident age - Males - American Indian and Alaska Native
Median resident age - Males - Multirace
Median resident age - Males - Other Race
Median resident age - Females - White
Median resident age - Females - Black or African American
Median resident age - Females - Asian
Median resident age - Females - Hispanic or Latino
Median resident age - Females - American Indian and Alaska Native
Median resident age - Females - Multirace
Median resident age - Females - Other Race
Commute - mean travel time to work (minutes)
Travel time to work - Less than 5 minutes (%)
Travel time to work - Less than 5 minutes (% change since 2000)
Travel time to work - 5 to 9 minutes (%)
Travel time to work - 5 to 9 minutes (% change since 2000)
Travel time to work - 10 to 19 minutes (%)
Travel time to work - 10 to 19 minutes (% change since 2000)
Travel time to work - 20 to 29 minutes (%)
Travel time to work - 20 to 29 minutes (% change since 2000)
Travel time to work - 30 to 39 minutes (%)
Travel time to work - 30 to 39 minutes (% change since 2000)
Travel time to work - 40 to 59 minutes (%)
Travel time to work - 40 to 59 minutes (% change since 2000)
Travel time to work - 60 to 89 minutes (%)
Travel time to work - 60 to 89 minutes (% change since 2000)
Travel time to work - 90 or more minutes (%)
Travel time to work - 90 or more minutes (% change since 2000)
Marital status - Never married (%)
Marital status - Now married (%)
Marital status - Separated (%)
Marital status - Widowed (%)
Marital status - Divorced (%)
Median family income ($)
Median family income (% change since 2000)
Median non-family income ($)
Median non-family income (% change since 2000)
Median per capita income ($)
Median per capita income (% change since 2000)
Median family income ($) - White
Median family income ($) - Black or African American
Median family income ($) - Asian
Median family income ($) - Hispanic or Latino
Median family income ($) - American Indian and Alaska Native
Median family income ($) - Multirace
Median family income ($) - Other Race
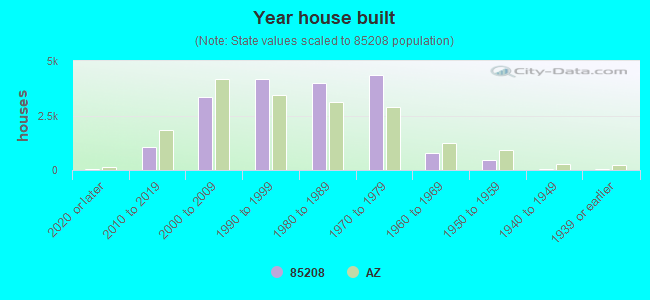
Median year house/condo built
Median year apartment built
Year house built - Built 2005 or later (%)
Year house built - Built 2000 to 2004 (%)
Year house built - Built 1990 to 1999 (%)
Year house built - Built 1980 to 1989 (%)
Year house built - Built 1970 to 1979 (%)
Year house built - Built 1960 to 1969 (%)
Year house built - Built 1950 to 1959 (%)
Year house built - Built 1940 to 1949 (%)
Year house built - Built 1939 or earlier (%)
Average household size
Household density (households per square mile)
Average household size - White
Average household size - Black or African American
Average household size - Asian
Average household size - Hispanic or Latino
Average household size - American Indian and Alaska Native
Average household size - Multirace
Average household size - Other Race
Occupied housing units (%)
Vacant housing units (%)
Owner occupied housing units (%)
Renter occupied housing units (%)
Vacancy status - For rent (%)
Vacancy status - For sale only (%)
Vacancy status - Rented or sold, not occupied (%)
Vacancy status - For seasonal, recreational, or occasional use (%)
Vacancy status - For migrant workers (%)
Vacancy status - Other vacant (%)
Residents with income below the poverty level (%)
Residents with income below 50% of the poverty level (%)
Children below poverty level (%)
Poor families by family type - Married-couple family (%)
Poor families by family type - Male, no wife present (%)
Poor families by family type - Female, no husband present (%)
Poverty status for native-born residents (%)
Poverty status for foreign-born residents (%)
Poverty among high school graduates not in families (%)
Poverty among people who did not graduate high school not in families (%)
Residents with income below the poverty level (%) - White
Residents with income below the poverty level (%) - Black or African American
Residents with income below the poverty level (%) - Asian
Residents with income below the poverty level (%) - Hispanic or Latino
Residents with income below the poverty level (%) - American Indian and Alaska Native
Residents with income below the poverty level (%) - Multirace
Residents with income below the poverty level (%) - Other Race
Air pollution - Air Quality Index (AQI)
Air pollution - CO
Air pollution - NO2
Air pollution - SO2
Air pollution - Ozone
Air pollution - PM10
Air pollution - PM25
Air pollution - Pb
Crime - Murders per 100,000 population
Crime - Rapes per 100,000 population
Crime - Robberies per 100,000 population
Crime - Assaults per 100,000 population
Crime - Burglaries per 100,000 population
Crime - Thefts per 100,000 population
Crime - Auto thefts per 100,000 population
Crime - Arson per 100,000 population
Crime - City-data.com crime index
Crime - Violent crime index
Crime - Property crime index
Crime - Murders per 100,000 population (5 year average)
Crime - Rapes per 100,000 population (5 year average)
Crime - Robberies per 100,000 population (5 year average)
Crime - Assaults per 100,000 population (5 year average)
Crime - Burglaries per 100,000 population (5 year average)
Crime - Thefts per 100,000 population (5 year average)
Crime - Auto thefts per 100,000 population (5 year average)
Crime - Arson per 100,000 population (5 year average)
Crime - City-data.com crime index (5 year average)
Crime - Violent crime index (5 year average)
Crime - Property crime index (5 year average)
1996 Presidential Elections Results (%) - Democratic Party (Clinton)
1996 Presidential Elections Results (%) - Republican Party (Dole)
1996 Presidential Elections Results (%) - Other
2000 Presidential Elections Results (%) - Democratic Party (Gore)
2000 Presidential Elections Results (%) - Republican Party (Bush)
2000 Presidential Elections Results (%) - Other
2004 Presidential Elections Results (%) - Democratic Party (Kerry)
2004 Presidential Elections Results (%) - Republican Party (Bush)
2004 Presidential Elections Results (%) - Other
2008 Presidential Elections Results (%) - Democratic Party (Obama)
2008 Presidential Elections Results (%) - Republican Party (McCain)
2008 Presidential Elections Results (%) - Other
2012 Presidential Elections Results (%) - Democratic Party (Obama)
2012 Presidential Elections Results (%) - Republican Party (Romney)
2012 Presidential Elections Results (%) - Other
2016 Presidential Elections Results (%) - Democratic Party (Clinton)
2016 Presidential Elections Results (%) - Republican Party (Trump)
2016 Presidential Elections Results (%) - Other
2020 Presidential Elections Results (%) - Democratic Party (Biden)
2020 Presidential Elections Results (%) - Republican Party (Trump)
2020 Presidential Elections Results (%) - Other
Ancestries Reported - Arab (%)
Ancestries Reported - Czech (%)
Ancestries Reported - Danish (%)
Ancestries Reported - Dutch (%)
Ancestries Reported - English (%)
Ancestries Reported - French (%)
Ancestries Reported - French Canadian (%)
Ancestries Reported - German (%)
Ancestries Reported - Greek (%)
Ancestries Reported - Hungarian (%)
Ancestries Reported - Irish (%)
Ancestries Reported - Italian (%)
Ancestries Reported - Lithuanian (%)
Ancestries Reported - Norwegian (%)
Ancestries Reported - Polish (%)
Ancestries Reported - Portuguese (%)
Ancestries Reported - Russian (%)
Ancestries Reported - Scotch-Irish (%)
Ancestries Reported - Scottish (%)
Ancestries Reported - Slovak (%)
Ancestries Reported - Subsaharan African (%)
Ancestries Reported - Swedish (%)
Ancestries Reported - Swiss (%)
Ancestries Reported - Ukrainian (%)
Ancestries Reported - United States (%)
Ancestries Reported - Welsh (%)
Ancestries Reported - West Indian (%)
Ancestries Reported - Other (%)
Educational Attainment - No schooling completed (%)
Educational Attainment - Less than high school (%)
Educational Attainment - High school or equivalent (%)
Educational Attainment - Less than 1 year of college (%)
Educational Attainment - 1 or more years of college (%)
Educational Attainment - Associate degree (%)
Educational Attainment - Bachelor's degree (%)
Educational Attainment - Master's degree (%)
Educational Attainment - Professional school degree (%)
Educational Attainment - Doctorate degree (%)
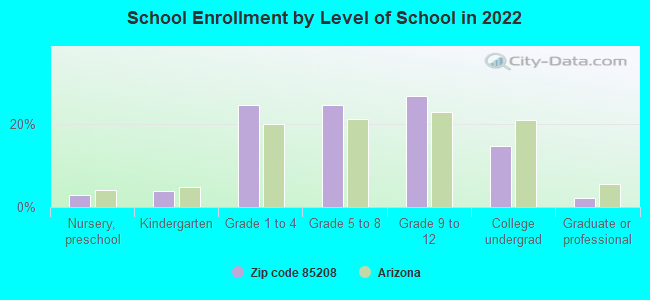
School Enrollment - Nursery, preschool (%)
School Enrollment - Kindergarten (%)
School Enrollment - Grade 1 to 4 (%)
School Enrollment - Grade 5 to 8 (%)
School Enrollment - Grade 9 to 12 (%)
School Enrollment - College undergrad (%)
School Enrollment - Graduate or professional (%)
School Enrollment - Not enrolled in school (%)
School enrollment - Public schools (%)
School enrollment - Private schools (%)
School enrollment - Not enrolled (%)
Median number of rooms in houses and condos
Median number of rooms in apartments
Housing units lacking complete plumbing facilities (%)
Housing units lacking complete kitchen facilities (%)
Density of houses
Urban houses (%)
Rural houses (%)
Households with people 60 years and over (%)
Households with people 65 years and over (%)
Households with people 75 years and over (%)
Households with one or more nonrelatives (%)
Households with no nonrelatives (%)
Population in households (%)
Family households (%)
Nonfamily households (%)
Population in families (%)
Family households with own children (%)
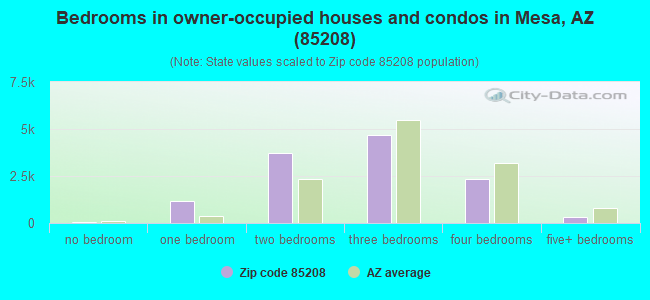
Median number of bedrooms in owner occupied houses
Mean number of bedrooms in owner occupied houses
Median number of bedrooms in renter occupied houses
Mean number of bedrooms in renter occupied houses
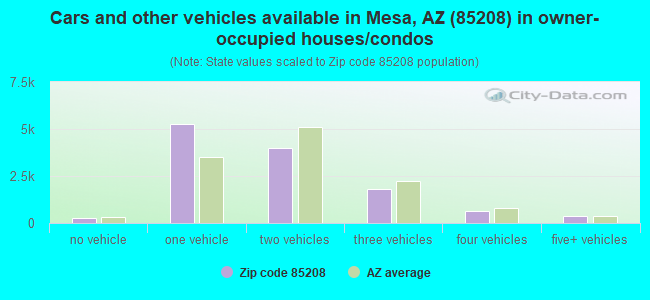
Median number of vehichles in owner occupied houses
Mean number of vehichles in owner occupied houses
Median number of vehichles in renter occupied houses
Mean number of vehichles in renter occupied houses
Mortgage status - with mortgage (%)
Mortgage status - with second mortgage (%)
Mortgage status - with home equity loan (%)
Mortgage status - with both second mortgage and home equity loan (%)
Mortgage status - without a mortgage (%)
Average family size
Average family size - White
Average family size - Black or African American
Average family size - Asian
Average family size - Hispanic or Latino
Average family size - American Indian and Alaska Native
Average family size - Multirace
Average family size - Other Race
Geographical mobility - Same house 1 year ago (%)
Geographical mobility - Moved within same county (%)
Geographical mobility - Moved from different county within same state (%)
Geographical mobility - Moved from different state (%)
Geographical mobility - Moved from abroad (%)
Place of birth - Born in state of residence (%)
Place of birth - Born in other state (%)
Place of birth - Native, outside of US (%)
Place of birth - Foreign born (%)
Housing units in structures - 1, detached (%)
Housing units in structures - 1, attached (%)
Housing units in structures - 2 (%)
Housing units in structures - 3 or 4 (%)
Housing units in structures - 5 to 9 (%)
Housing units in structures - 10 to 19 (%)
Housing units in structures - 20 to 49 (%)
Housing units in structures - 50 or more (%)
Housing units in structures - Mobile home (%)
Housing units in structures - Boat, RV, van, etc. (%)
House/condo owner moved in on average (years ago)
Renter moved in on average (years ago)
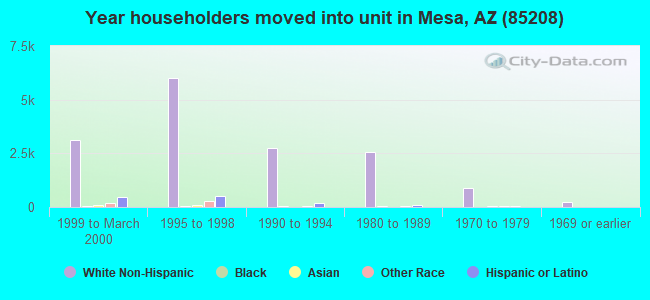
Year householder moved into unit - Moved in 1999 to March 2000 (%)
Year householder moved into unit - Moved in 1995 to 1998 (%)
Year householder moved into unit - Moved in 1990 to 1994 (%)
Year householder moved into unit - Moved in 1980 to 1989 (%)
Year householder moved into unit - Moved in 1970 to 1979 (%)
Year householder moved into unit - Moved in 1969 or earlier (%)
Means of transportation to work - Drove car alone (%)
Means of transportation to work - Carpooled (%)
Means of transportation to work - Public transportation (%)
Means of transportation to work - Bus or trolley bus (%)
Means of transportation to work - Streetcar or trolley car (%)
Means of transportation to work - Subway or elevated (%)
Means of transportation to work - Railroad (%)
Means of transportation to work - Ferryboat (%)
Means of transportation to work - Taxicab (%)
Means of transportation to work - Motorcycle (%)
Means of transportation to work - Bicycle (%)
Means of transportation to work - Walked (%)
Means of transportation to work - Other means (%)
Working at home (%)
Industry diversity
Most Common Industries - Agriculture, forestry, fishing and hunting, and mining (%)
Most Common Industries - Agriculture, forestry, fishing and hunting (%)
Most Common Industries - Mining, quarrying, and oil and gas extraction (%)
Most Common Industries - Construction (%)
Most Common Industries - Manufacturing (%)
Most Common Industries - Wholesale trade (%)
Most Common Industries - Retail trade (%)
Most Common Industries - Transportation and warehousing, and utilities (%)
Most Common Industries - Transportation and warehousing (%)
Most Common Industries - Utilities (%)
Most Common Industries - Information (%)
Most Common Industries - Finance and insurance, and real estate and rental and leasing (%)
Most Common Industries - Finance and insurance (%)
Most Common Industries - Real estate and rental and leasing (%)
Most Common Industries - Professional, scientific, and management, and administrative and waste management services (%)
Most Common Industries - Professional, scientific, and technical services (%)
Most Common Industries - Management of companies and enterprises (%)
Most Common Industries - Administrative and support and waste management services (%)
Most Common Industries - Educational services, and health care and social assistance (%)
Most Common Industries - Educational services (%)
Most Common Industries - Health care and social assistance (%)
Most Common Industries - Arts, entertainment, and recreation, and accommodation and food services (%)
Most Common Industries - Arts, entertainment, and recreation (%)
Most Common Industries - Accommodation and food services (%)
Most Common Industries - Other services, except public administration (%)
Most Common Industries - Public administration (%)
Occupation diversity
Most Common Occupations - Management, business, science, and arts occupations (%)
Most Common Occupations - Management, business, and financial occupations (%)
Most Common Occupations - Management occupations (%)
Most Common Occupations - Business and financial operations occupations (%)
Most Common Occupations - Computer, engineering, and science occupations (%)
Most Common Occupations - Computer and mathematical occupations (%)
Most Common Occupations - Architecture and engineering occupations (%)
Most Common Occupations - Life, physical, and social science occupations (%)
Most Common Occupations - Education, legal, community service, arts, and media occupations (%)
Most Common Occupations - Community and social service occupations (%)
Most Common Occupations - Legal occupations (%)
Most Common Occupations - Education, training, and library occupations (%)
Most Common Occupations - Arts, design, entertainment, sports, and media occupations (%)
Most Common Occupations - Healthcare practitioners and technical occupations (%)
Most Common Occupations - Health diagnosing and treating practitioners and other technical occupations (%)
Most Common Occupations - Health technologists and technicians (%)
Most Common Occupations - Service occupations (%)
Most Common Occupations - Healthcare support occupations (%)
Most Common Occupations - Protective service occupations (%)
Most Common Occupations - Fire fighting and prevention, and other protective service workers including supervisors (%)
Most Common Occupations - Law enforcement workers including supervisors (%)
Most Common Occupations - Food preparation and serving related occupations (%)
Most Common Occupations - Building and grounds cleaning and maintenance occupations (%)
Most Common Occupations - Personal care and service occupations (%)
Most Common Occupations - Sales and office occupations (%)
Most Common Occupations - Sales and related occupations (%)
Most Common Occupations - Office and administrative support occupations (%)
Most Common Occupations - Natural resources, construction, and maintenance occupations (%)
Most Common Occupations - Farming, fishing, and forestry occupations (%)
Most Common Occupations - Construction and extraction occupations (%)
Most Common Occupations - Installation, maintenance, and repair occupations (%)
Most Common Occupations - Production, transportation, and material moving occupations (%)
Most Common Occupations - Production occupations (%)
Most Common Occupations - Transportation occupations (%)
Most Common Occupations - Material moving occupations (%)
People in Group quarters - Institutionalized population (%)
People in Group quarters - Correctional institutions (%)
People in Group quarters - Federal prisons and detention centers (%)
People in Group quarters - Halfway houses (%)
People in Group quarters - Local jails and other confinement facilities (including police lockups) (%)
People in Group quarters - Military disciplinary barracks (%)
People in Group quarters - State prisons (%)
People in Group quarters - Other types of correctional institutions (%)
People in Group quarters - Nursing homes (%)
People in Group quarters - Hospitals/wards, hospices, and schools for the handicapped (%)
People in Group quarters - Hospitals/wards and hospices for chronically ill (%)
People in Group quarters - Hospices or homes for chronically ill (%)
People in Group quarters - Military hospitals or wards for chronically ill (%)
People in Group quarters - Other hospitals or wards for chronically ill (%)
People in Group quarters - Hospitals or wards for drug/alcohol abuse (%)
People in Group quarters - Mental (Psychiatric) hospitals or wards (%)
People in Group quarters - Schools, hospitals, or wards for the mentally retarded (%)
People in Group quarters - Schools, hospitals, or wards for the physically handicapped (%)
People in Group quarters - Institutions for the deaf (%)
People in Group quarters - Institutions for the blind (%)
People in Group quarters - Orthopedic wards and institutions for the physically handicapped (%)
People in Group quarters - Wards in general hospitals for patients who have no usual home elsewhere (%)
People in Group quarters - Wards in military hospitals for patients who have no usual home elsewhere (%)
People in Group quarters - Juvenile institutions (%)
People in Group quarters - Long-term care (%)
People in Group quarters - Homes for abused, dependent, and neglected children (%)
People in Group quarters - Residential treatment centers for emotionally disturbed children (%)
People in Group quarters - Training schools for juvenile delinquents (%)
People in Group quarters - Short-term care, detention or diagnostic centers for delinquent children (%)
People in Group quarters - Type of juvenile institution unknown (%)
People in Group quarters - Noninstitutionalized population (%)
People in Group quarters - College dormitories (includes college quarters off campus) (%)
People in Group quarters - Military quarters (%)
People in Group quarters - On base (%)
People in Group quarters - Barracks, unaccompanied personnel housing (UPH), (Enlisted/Officer), ;and similar group living quarters for military personnel (%)
People in Group quarters - Transient quarters for temporary residents (%)
People in Group quarters - Military ships (%)
People in Group quarters - Group homes (%)
People in Group quarters - Homes or halfway houses for drug/alcohol abuse (%)
People in Group quarters - Homes for the mentally ill (%)
People in Group quarters - Homes for the mentally retarded (%)
People in Group quarters - Homes for the physically handicapped (%)
People in Group quarters - Other group homes (%)
People in Group quarters - Religious group quarters (%)
People in Group quarters - Dormitories (%)
People in Group quarters - Agriculture workers' dormitories on farms (%)
People in Group quarters - Job Corps and vocational training facilities (%)
People in Group quarters - Other workers' dormitories (%)
People in Group quarters - Crews of maritime vessels (%)
People in Group quarters - Other nonhousehold living situations (%)
People in Group quarters - Other noninstitutional group quarters (%)
Residents speaking English at home (%)
Residents speaking English at home - Born in the United States (%)
Residents speaking English at home - Native, born elsewhere (%)
Residents speaking English at home - Foreign born (%)
Residents speaking Spanish at home (%)
Residents speaking Spanish at home - Born in the United States (%)
Residents speaking Spanish at home - Native, born elsewhere (%)
Residents speaking Spanish at home - Foreign born (%)
Residents speaking other language at home (%)
Residents speaking other language at home - Born in the United States (%)
Residents speaking other language at home - Native, born elsewhere (%)
Residents speaking other language at home - Foreign born (%)
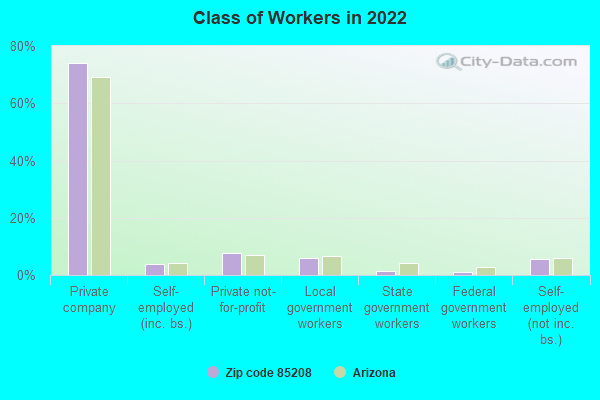
Class of Workers - Employee of private company (%)
Class of Workers - Self-employed in own incorporated business (%)
Class of Workers - Private not-for-profit wage and salary workers (%)
Class of Workers - Local government workers (%)
Class of Workers - State government workers (%)
Class of Workers - Federal government workers (%)
Class of Workers - Self-employed workers in own not incorporated business and Unpaid family workers (%)
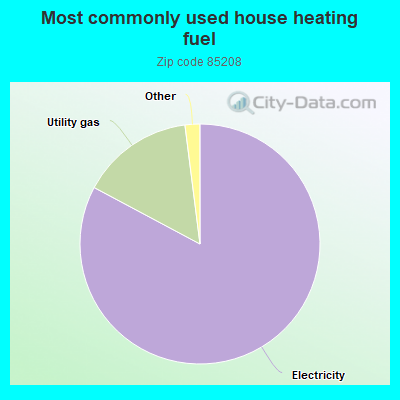
House heating fuel used in houses and condos - Utility gas (%)
House heating fuel used in houses and condos - Bottled, tank, or LP gas (%)
House heating fuel used in houses and condos - Electricity (%)
House heating fuel used in houses and condos - Fuel oil, kerosene, etc. (%)
House heating fuel used in houses and condos - Coal or coke (%)
House heating fuel used in houses and condos - Wood (%)
House heating fuel used in houses and condos - Solar energy (%)
House heating fuel used in houses and condos - Other fuel (%)
House heating fuel used in houses and condos - No fuel used (%)
House heating fuel used in apartments - Utility gas (%)
House heating fuel used in apartments - Bottled, tank, or LP gas (%)
House heating fuel used in apartments - Electricity (%)
House heating fuel used in apartments - Fuel oil, kerosene, etc. (%)
House heating fuel used in apartments - Coal or coke (%)
House heating fuel used in apartments - Wood (%)
House heating fuel used in apartments - Solar energy (%)
House heating fuel used in apartments - Other fuel (%)
House heating fuel used in apartments - No fuel used (%)
Armed forces status - In Armed Forces (%)
Armed forces status - Civilian (%)
Armed forces status - Civilian - Veteran (%)
Armed forces status - Civilian - Nonveteran (%)
Fatal accidents locations in years 2005-2021
Fatal accidents locations in 2005
Fatal accidents locations in 2006
Fatal accidents locations in 2007
Fatal accidents locations in 2008
Fatal accidents locations in 2009
Fatal accidents locations in 2010
Fatal accidents locations in 2011
Fatal accidents locations in 2012
Fatal accidents locations in 2013
Fatal accidents locations in 2014
Fatal accidents locations in 2015
Fatal accidents locations in 2016
Fatal accidents locations in 2017
Fatal accidents locations in 2018
Fatal accidents locations in 2019
Fatal accidents locations in 2020
Fatal accidents locations in 2021
Alcohol use - People drinking some alcohol every month (%)
Alcohol use - People not drinking at all (%)
Alcohol use - Average days/month drinking alcohol
Alcohol use - Average drinks/week
Alcohol use - Average days/year people drink much
Audiometry - Average condition of hearing (%)
Audiometry - People that can hear a whisper from across a quiet room (%)
Audiometry - People that can hear normal voice from across a quiet room (%)
Audiometry - Ears ringing, roaring, buzzing (%)
Audiometry - Had a job exposure to loud noise (%)
Audiometry - Had off-work exposure to loud noise (%)
Blood Pressure & Cholesterol - Has high blood pressure (%)
Blood Pressure & Cholesterol - Checking blood pressure at home (%)
Blood Pressure & Cholesterol - Frequently checking blood cholesterol (%)
Blood Pressure & Cholesterol - Has high cholesterol level (%)
Consumer Behavior - Money monthly spent on food at supermarket/grocery store
Consumer Behavior - Money monthly spent on food at other stores
Consumer Behavior - Money monthly spent on eating out
Consumer Behavior - Money monthly spent on carryout/delivered foods
Consumer Behavior - Income spent on food at supermarket/grocery store (%)
Consumer Behavior - Income spent on food at other stores (%)
Consumer Behavior - Income spent on eating out (%)
Consumer Behavior - Income spent on carryout/delivered foods (%)
Current Health Status - General health condition (%)
Current Health Status - Blood donors (%)
Current Health Status - Has blood ever tested for HIV virus (%)
Current Health Status - Left-handed people (%)
Dermatology - People using sunscreen (%)
Diabetes - Diabetics (%)
Diabetes - Had a blood test for high blood sugar (%)
Diabetes - People taking insulin (%)
Diet Behavior & Nutrition - Diet health (%)
Diet Behavior & Nutrition - Milk product consumption (# of products/month)
Diet Behavior & Nutrition - Meals not home prepared (#/week)
Diet Behavior & Nutrition - Meals from fast food or pizza place (#/week)
Diet Behavior & Nutrition - Ready-to-eat foods (#/month)
Diet Behavior & Nutrition - Frozen meals/pizza (#/month)
Drug Use - People that ever used marijuana or hashish (%)
Drug Use - Ever used hard drugs (%)
Drug Use - Ever used any form of cocaine (%)
Drug Use - Ever used heroin (%)
Drug Use - Ever used methamphetamine (%)
Health Insurance - People covered by health insurance (%)
Kidney Conditions-Urology - Avg. # of times urinating at night
Medical Conditions - People with asthma (%)
Medical Conditions - People with anemia (%)
Medical Conditions - People with psoriasis (%)
Medical Conditions - People with overweight (%)
Medical Conditions - Elderly people having difficulties in thinking or remembering (%)
Medical Conditions - People who ever received blood transfusion (%)
Medical Conditions - People having trouble seeing even with glass/contacts (%)
Medical Conditions - People with arthritis (%)
Medical Conditions - People with gout (%)
Medical Conditions - People with congestive heart failure (%)
Medical Conditions - People with coronary heart disease (%)
Medical Conditions - People with angina pectoris (%)
Medical Conditions - People who ever had heart attack (%)
Medical Conditions - People who ever had stroke (%)
Medical Conditions - People with emphysema (%)
Medical Conditions - People with thyroid problem (%)
Medical Conditions - People with chronic bronchitis (%)
Medical Conditions - People with any liver condition (%)
Medical Conditions - People who ever had cancer or malignancy (%)
Mental Health - People who have little interest in doing things (%)
Mental Health - People feeling down, depressed, or hopeless (%)
Mental Health - People who have trouble sleeping or sleeping too much (%)
Mental Health - People feeling tired or having little energy (%)
Mental Health - People with poor appetite or overeating (%)
Mental Health - People feeling bad about themself (%)
Mental Health - People who have trouble concentrating on things (%)
Mental Health - People moving or speaking slowly or too fast (%)
Mental Health - People having thoughts they would be better off dead (%)
Oral Health - Average years since last visit a dentist
Oral Health - People embarrassed because of mouth (%)
Oral Health - People with gum disease (%)
Oral Health - General health of teeth and gums (%)
Oral Health - Average days a week using dental floss/device
Oral Health - Average days a week using mouthwash for dental problem
Oral Health - Average number of teeth
Pesticide Use - Households using pesticides to control insects (%)
Pesticide Use - Households using pesticides to kill weeds (%)
Physical Activity - People doing vigorous-intensity work activities (%)
Physical Activity - People doing moderate-intensity work activities (%)
Physical Activity - People walking or bicycling (%)
Physical Activity - People doing vigorous-intensity recreational activities (%)
Physical Activity - People doing moderate-intensity recreational activities (%)
Physical Activity - Average hours a day doing sedentary activities
Physical Activity - Average hours a day watching TV or videos
Physical Activity - Average hours a day using computer
Physical Functioning - People having limitations keeping them from working (%)
Physical Functioning - People limited in amount of work they can do (%)
Physical Functioning - People that need special equipment to walk (%)
Physical Functioning - People experiencing confusion/memory problems (%)
Physical Functioning - People requiring special healthcare equipment (%)
Prescription Medications - Average number of prescription medicines taking
Preventive Aspirin Use - Adults 40+ taking low-dose aspirin (%)
Reproductive Health - Vaginal deliveries (%)
Reproductive Health - Cesarean deliveries (%)
Reproductive Health - Deliveries resulted in a live birth (%)
Reproductive Health - Pregnancies resulted in a delivery (%)
Reproductive Health - Women breastfeeding newborns (%)
Reproductive Health - Women that had a hysterectomy (%)
Reproductive Health - Women that had both ovaries removed (%)
Reproductive Health - Women that have ever taken birth control pills (%)
Reproductive Health - Women taking birth control pills (%)
Reproductive Health - Women that have ever used Depo-Provera or injectables (%)
Reproductive Health - Women that have ever used female hormones (%)
Sexual Behavior - People 18+ that ever had sex (vaginal, anal, or oral) (%)
Sexual Behavior - Males 18+ that ever had vaginal sex with a woman (%)
Sexual Behavior - Males 18+ that ever performed oral sex on a woman (%)
Sexual Behavior - Males 18+ that ever had anal sex with a woman (%)
Sexual Behavior - Males 18+ that ever had any sex with a man (%)
Sexual Behavior - Females 18+ that ever had vaginal sex with a man (%)
Sexual Behavior - Females 18+ that ever performed oral sex on a man (%)
Sexual Behavior - Females 18+ that ever had anal sex with a man (%)
Sexual Behavior - Females 18+ that ever had any kind of sex with a woman (%)
Sexual Behavior - Average age people first had sex
Sexual Behavior - Average number of female sex partners in lifetime (males 18+)
Sexual Behavior - Average number of female vaginal sex partners in lifetime (males 18+)
Sexual Behavior - Average age people first performed oral sex on a woman (18+)
Sexual Behavior - Average number of woman performed oral sex on in lifetime (18+)
Sexual Behavior - Average number of male sex partners in lifetime (males 18+)
Sexual Behavior - Average number of male anal sex partners in lifetime (males 18+)
Sexual Behavior - Average age people first performed oral sex on a man (18+)
Sexual Behavior - Average number of male oral sex partners in lifetime (18+)
Sexual Behavior - People using protection when performing oral sex (%)
Sexual Behavior - Average number of times people have vaginal or anal sex a year
Sexual Behavior - People having sex without condom (%)
Sexual Behavior - Average number of male sex partners in lifetime (females 18+)
Sexual Behavior - Average number of male vaginal sex partners in lifetime (females 18+)
Sexual Behavior - Average number of female sex partners in lifetime (females 18+)
Sexual Behavior - Circumcised males 18+ (%)
Sleep Disorders - Average hours sleeping at night
Sleep Disorders - People that has trouble sleeping (%)
Smoking-Cigarette Use - People smoking cigarettes (%)
Taste & Smell - People 40+ having problems with smell (%)
Taste & Smell - People 40+ having problems with taste (%)
Taste & Smell - People 40+ that ever had wisdom teeth removed (%)
Taste & Smell - People 40+ that ever had tonsils teeth removed (%)
Taste & Smell - People 40+ that ever had a loss of consciousness because of a head injury (%)
Taste & Smell - People 40+ that ever had a broken nose or other serious injury to face or skull (%)
Taste & Smell - People 40+ that ever had two or more sinus infections (%)
Weight - Average height (inches)
Weight - Average weight (pounds)
Weight - Average BMI
Weight - People that are obese (%)
Weight - People that ever were obese (%)
Weight - People trying to lose weight (%)
Urban population: 38,485
Rural population: 15
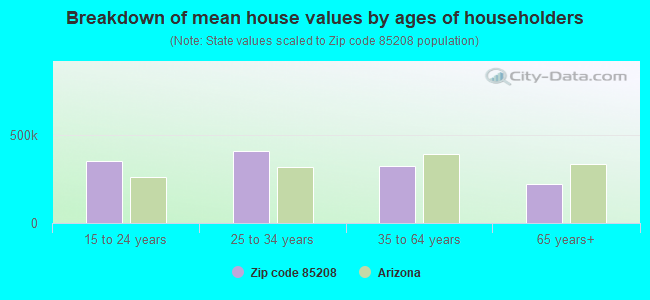
Estimated median house/condo value in 2022: $290,257
85208:
$290,257Arizona:
$402,800
According to our research of Arizona and other state lists, there were 61 registered sex offenders living in 85208 zip code as of April 27, 2024 . The ratio of all residents to sex offenders in zip code 85208 is 621 to 1.The ratio of registered sex offenders to all residents in this zip code is near the state average.
Median resident age: This zip code:
44.2 yearsArizona median age:
38.8 years
Average household size: This zip code:
2.5 peopleArizona:
2.5 people
Averages for the 2020 tax year for zip code 85208, filed in 2021:
Average Adjusted Gross Income (AGI) in 2020: $47,851 (Individual Income Tax Returns) Here:
$47,851State:
$73,499
Salary/wage: $45,240 (reported on 77.8% of returns )Here:
$45,240State:
$59,499
(% of AGI for various income ranges: 1083.3% for AGIs below $25k , 3671.4% for AGIs $25k-50k , 6716.5% for AGIs $50k-75k , 10189.2% for AGIs $75k-100k , 18465.5% for AGIs $100k-200k , 44050.0% for AGIs over 200k ) Taxable interest for individuals: $987 (reported on 19.2% of returns )This zip code:
$987Arizona:
$2,325
(% of AGI for various income ranges: 12.3% for AGIs below $25k , 14.6% for AGIs $25k-50k , 32.0% for AGIs $50k-75k , 36.2% for AGIs $75k-100k , 104.9% for AGIs $100k-200k , 418.6% for AGIs over 200k ) Ordinary dividends: $3,660 (reported on 11.6% of returns )(% of AGI for various income ranges: 22.2% for AGIs below $25k , 26.8% for AGIs $25k-50k , 73.4% for AGIs $50k-75k , 98.0% for AGIs $75k-100k , 238.4% for AGIs $100k-200k , 1297.1% for AGIs over 200k ) Net capital gain/loss in AGI: +$9,748 (reported on 11.1% of returns )Here:
+$9,748State:
+$31,332
(% of AGI for various income ranges: 4.6% for AGIs below $25k , 19.9% for AGIs $25k-50k , 70.7% for AGIs $50k-75k , 175.9% for AGIs $75k-100k , 583.9% for AGIs $100k-200k , 13620.0% for AGIs over 200k ) Profit/loss from business: +$8,756 (reported on 14.0% of returns )Here:
+$8,756State:
+$13,214
(% of AGI for various income ranges: 132.9% for AGIs below $25k , 125.7% for AGIs $25k-50k , 198.7% for AGIs $50k-75k , 191.7% for AGIs $75k-100k , 478.3% for AGIs $100k-200k , 788.6% for AGIs over 200k ) Taxable individual retirement arrangement distribution: $13,842 (reported on 9.2% of returns )85208:
$13,842Arizona:
$23,364
(% of AGI for various income ranges: 74.9% for AGIs below $25k , 95.0% for AGIs $25k-50k , 217.6% for AGIs $50k-75k , 305.7% for AGIs $75k-100k , 712.2% for AGIs $100k-200k , 2501.4% for AGIs over 200k ) Total itemized deductions: $27,865 (reported on 5.1% of returns )Here:
$27,865State:
$36,308
(% of AGI for various income ranges: 36.7% for AGIs below $25k , 88.1% for AGIs $25k-50k , 233.0% for AGIs $50k-75k , 384.2% for AGIs $75k-100k , 907.7% for AGIs $100k-200k , 5155.7% for AGIs over 200k ) Charity contributions: $7,148 (reported on 3.9% of returns )(% of AGI for various income ranges: 2.4% for AGIs below $25k , 14.4% for AGIs $25k-50k , 35.1% for AGIs $50k-75k , 79.1% for AGIs $75k-100k , 235.8% for AGIs $100k-200k , 1064.3% for AGIs over 200k ) Taxes paid: $4,655 (reported on 5.0% of returns )(% of AGI for various income ranges: 4.1% for AGIs below $25k , 11.5% for AGIs $25k-50k , 37.7% for AGIs $50k-75k , 68.2% for AGIs $75k-100k , 187.3% for AGIs $100k-200k , 684.3% for AGIs over 200k ) Earned income credit: $2,274 (reported on 16.8% of returns )(% of AGI for various income ranges: 86.1% for AGIs below $25k , 67.9% for AGIs $25k-50k , 1.4% for AGIs $50k-75k ) Percentage of individuals using paid preparers for their 2020 taxes: 93.0%(% for various income ranges: 91.5% for AGIs below $25k , 93.6% for AGIs $25k-50k , 93.6% for AGIs $50k-75k , 95.3% for AGIs $75k-100k , 93.1% for AGIs $100k-200k , 95.0% for AGIs over 200k )
Averages for the 2012 tax year for zip code 85208, filed in 2013:
Average Adjusted Gross Income (AGI) in 2012: $40,415 (Individual Income Tax Returns) Here:
$40,415State:
$57,644
Salary/wage: $37,942 (reported on 79.3% of returns )Here:
$37,942State:
$47,932
(% of AGI for various income ranges: 69.6% for AGIs below $25k , 77.9% for AGIs $25k-50k , 76.4% for AGIs $50k-75k , 75.9% for AGIs $75k-100k , 74.4% for AGIs $100k-200k , 46.6% for AGIs over 200k ) Taxable interest for individuals: $1,002 (reported on 26.3% of returns )This zip code:
$1,002Arizona:
$2,064
(% of AGI for various income ranges: 1.1% for AGIs below $25k , 0.5% for AGIs $25k-50k , 0.6% for AGIs $50k-75k , 0.7% for AGIs $75k-100k , 0.5% for AGIs $100k-200k , 0.9% for AGIs over 200k ) Ordinary dividends: $3,147 (reported on 13.5% of returns )(% of AGI for various income ranges: 1.6% for AGIs below $25k , 0.9% for AGIs $25k-50k , 0.8% for AGIs $50k-75k , 0.9% for AGIs $75k-100k , 1.2% for AGIs $100k-200k , 1.7% for AGIs over 200k ) Net capital gain/loss in AGI: +$2,567 (reported on 10.9% of returns )Here:
+$2,567State:
+$15,530
(% of AGI for various income ranges: 0.1% for AGIs $25k-50k , 0.6% for AGIs $50k-75k , 0.6% for AGIs $75k-100k , 1.8% for AGIs $100k-200k , 5.5% for AGIs over 200k ) Profit/loss from business: +$8,180 (reported on 11.9% of returns )Here:
+$8,180State:
+$12,323
(% of AGI for various income ranges: 6.5% for AGIs below $25k , 2.4% for AGIs $25k-50k , 1.5% for AGIs $50k-75k , 1.5% for AGIs $75k-100k , 1.7% for AGIs $100k-200k ) Taxable individual retirement arrangement distribution: $10,920 (reported on 12.1% of returns )85208:
$10,920Arizona:
$18,280
(% of AGI for various income ranges: 4.0% for AGIs below $25k , 2.9% for AGIs $25k-50k , 2.6% for AGIs $50k-75k , 2.9% for AGIs $75k-100k , 5.1% for AGIs $100k-200k ) Total itemized deductions: $17,102 (26% of AGI, reported on 26.9% of returns )Here:
$17,102State:
$23,651
Here:
25.7% of AGIState:
20.6% of AGI
(% of AGI for various income ranges: 8.8% for AGIs below $25k , 10.6% for AGIs $25k-50k , 11.8% for AGIs $50k-75k , 12.7% for AGIs $75k-100k , 12.7% for AGIs $100k-200k , 10.5% for AGIs over 200k ) Charity contributions: $2,818 (reported on 21.7% of returns )(% of AGI for various income ranges: 0.9% for AGIs below $25k , 1.2% for AGIs $25k-50k , 1.7% for AGIs $50k-75k , 1.8% for AGIs $75k-100k , 1.8% for AGIs $100k-200k , 2.1% for AGIs over 200k ) Taxes paid: $3,552 (reported on 26.6% of returns )(% of AGI for various income ranges: 1.3% for AGIs below $25k , 1.8% for AGIs $25k-50k , 2.2% for AGIs $50k-75k , 2.8% for AGIs $75k-100k , 3.4% for AGIs $100k-200k , 4.0% for AGIs over 200k ) Earned income credit: $2,257 (reported on 21.2% of returns )(% of AGI for various income ranges: 6.2% for AGIs below $25k , 1.3% for AGIs $25k-50k ) Percentage of individuals using paid preparers for their 2012 taxes: 48.4%(% for various income ranges: 46.6% for AGIs below $25k , 47.8% for AGIs $25k-50k , 50.8% for AGIs $50k-75k , 50.9% for AGIs $75k-100k , 53.2% for AGIs $100k-200k , 83.3% for AGIs over 200k )
Averages for the 2004 tax year for zip code 85208, filed in 2005:
Average Adjusted Gross Income (AGI) in 2004: $40,657 (Individual Income Tax Returns) Here:
$40,657State:
$50,097
Salary/wage: $38,989 (reported on 78.0% of returns )Here:
$38,989State:
$42,146
(% of AGI for various income ranges: 83.4% for AGIs below $10k , 64.4% for AGIs $10k-25k , 76.3% for AGIs $25k-50k , 78.8% for AGIs $50k-75k , 80.3% for AGIs $75k-100k , 66.5% for AGIs over 100k ) Taxable interest for individuals: $1,656 (reported on 42.4% of returns )This zip code:
$1,656Arizona:
$2,374
(% of AGI for various income ranges: 7.6% for AGIs below $10k , 3.6% for AGIs $10k-25k , 1.7% for AGIs $25k-50k , 1.1% for AGIs $50k-75k , 1.1% for AGIs $75k-100k , 1.6% for AGIs over 100k ) Taxable dividends: $2,356 (reported on 22.5% of returns )(% of AGI for various income ranges: 6.1% for AGIs below $10k , 2.5% for AGIs $10k-25k , 1.1% for AGIs $25k-50k , 1.0% for AGIs $50k-75k , 1.0% for AGIs $75k-100k , 1.3% for AGIs over 100k ) Net capital gain/loss: +$4,763 (reported on 19.4% of returns )Here:
+$4,763State:
+$17,569
(% of AGI for various income ranges: -3.7% for AGIs below $10k , -0.1% for AGIs $10k-25k , 0.5% for AGIs $25k-50k , 0.8% for AGIs $50k-75k , 1.6% for AGIs $75k-100k , 9.7% for AGIs over 100k ) Profit/loss from business: +$5,829 (reported on 12.3% of returns )Here:
+$5,829State:
+$11,088
(% of AGI for various income ranges: 3.9% for AGIs below $10k , 3.0% for AGIs $10k-25k , 1.6% for AGIs $25k-50k , 1.3% for AGIs $50k-75k , 1.7% for AGIs $75k-100k , 1.8% for AGIs over 100k ) Profit/loss from farming: +$333 (reported on 0.1% of returns )
Here : State :
IRA payment deduction: $2,687 (reported on 2.0% of returns )85208:
$2,687Arizona:
$3,023
(% of AGI for various income ranges: 0.2% for AGIs below $10k , 0.1% for AGIs $10k-25k , 0.1% for AGIs $25k-50k , 0.1% for AGIs $50k-75k , 0.1% for AGIs $75k-100k , 0.1% for AGIs over 100k ) Self-employed pension: $9,128 (reported on 0.2% of returns )Here:
$9,128Arizona:
$15,785
Total itemized deductions: $15,927 (26% of AGI, reported on 42.4% of returns )Here:
$15,927State:
$19,781
Here:
26.3% of AGIState:
21.8% of AGI
(% of AGI for various income ranges: 19.5% for AGIs below $10k , 13.5% for AGIs $10k-25k , 16.3% for AGIs $25k-50k , 17.7% for AGIs $50k-75k , 17.6% for AGIs $75k-100k , 16.0% for AGIs over 100k ) Charity contributions deductions: $2,550 (4% of AGI, reported on 37.1% of returns )Here:
4.1% of AGIState:
3.5% of AGI
(% of AGI for various income ranges: 1.4% for AGIs below $10k , 1.5% for AGIs $10k-25k , 2.0% for AGIs $25k-50k , 2.5% for AGIs $50k-75k , 2.4% for AGIs $75k-100k , 2.9% for AGIs over 100k ) Total tax: $4,491 (reported on 75.1% of returns )(% of AGI for various income ranges: 2.4% for AGIs below $10k , 3.4% for AGIs $10k-25k , 6.0% for AGIs $25k-50k , 7.9% for AGIs $50k-75k , 9.7% for AGIs $75k-100k , 14.5% for AGIs over 100k ) Earned income credit: $1,688 (reported on 12.5% of returns )Percentage of individuals using paid preparers for their 2004 taxes: 58.0%(% for various income ranges: 52.5% for AGIs below $10k , 60.8% for AGIs $10k-25k , 58.0% for AGIs $25k-50k , 57.4% for AGIs $50k-75k , 57.4% for AGIs $75k-100k , 62.9% for AGIs over 100k )
Estimated median household income in 2022: This zip code:
$67,334Arizona:
$74,568
Nearest zip codes: 85209 ,
85207 ,
85120 ,
85212 ,
85206 ,
85205 .
Mesa Zip Code Map
Percentage of family households: This zip code:
38.2%Arizona:
43.6%
Percentage of households with unmarried partners: This zip code:
6.4%Arizona:
46.7%
Likely homosexual households (counted as self-reported same-sex unmarried-partner households)
Lesbian couples: 0.1% of all households Gay men: 0.1% of all households
Household received Food Stamps/SNAP in the past 12 months: 1,565Household did not receive Food Stamps/SNAP in the past 12 months: 14,027
Women who had a birth in the past 12 months: 168 (173 now married , 0 unmarried) Women who did not have a birth in the past 12 months: 7,673 (2,911 now married , 4,768 unmarried)
Housing units in zip code 85208 with a mortgage: 6,626 (353
second mortgage , 25
home equity loan , 289
both second mortgage and home equity loan )
Houses without a mortgage: 70
Median monthly owner costs for units with a mortgage: $1,370
Median monthly owner costs for units without a mortgage: $426
Residents with income below the poverty level in 2022:
This zip code:
10.8%Whole state:
12.5%
Residents with income below 50% of the poverty level in 2022:
This zip code:
5.5%Whole state:
6.0%
Median number of rooms in houses and condos: Median number of rooms in apartments:
Year house built (houses)
50 2020 or later1,055 2010 to 20193,356 2000 to 20094,193 1990 to 19993,968 1980 to 19894,360 1970 to 1979782 1960 to 1969462 1950 to 195949 1940 to 194955 1939 or earlier
Zip code 85208 household income distribution in 2022 774 Less than $10,000393 $10,000 to $14,999603 $15,000 to $19,999764 $20,000 to $24,999582 $25,000 to $29,999740 $30,000 to $34,999559 $35,000 to $39,999706 $40,000 to $44,999564 $45,000 to $49,9991,046 $50,000 to $59,9991,874 $60,000 to $74,9992,559 $75,000 to $99,9991,737 $100,000 to $124,999878 $125,000 to $149,9991,282 $150,000 to $199,999431 $200,000 or moreEstimate of home value of owner-occupied houses/condos in 2022 in zip code 85208 387 Less than $10,000175 $10,000 to $14,999131 $15,000 to $19,999219 $20,000 to $24,999145 $25,000 to $29,99986 $30,000 to $34,999200 $35,000 to $39,999320 $40,000 to $49,999306 $50,000 to $59,99980 $60,000 to $69,99994 $70,000 to $79,999128 $80,000 to $89,999137 $90,000 to $99,999520 $100,000 to $124,999213 $125,000 to $149,999316 $150,000 to $174,999368 $175,000 to $199,999830 $200,000 to $249,9991,164 $250,000 to $299,9992,455 $300,000 to $399,9991,306 $400,000 to $499,999333 $500,000 to $749,99948 $750,000 to $999,999126 $1,000,000 to $1,499,99919 $1,500,000 to $1,999,99928 $2,000,000 or moreRent paid by renters in 2022 in zip code 85208 23 $100 to $1491 $250 to $2995 $400 to $44968 $450 to $49960 $500 to $54946 $550 to $59938 $600 to $64947 $650 to $69954 $700 to $749121 $750 to $799138 $800 to $899243 $900 to $999665 $1,000 to $1,249470 $1,250 to $1,499895 $1,500 to $1,999328 $2,000 to $2,49912 $2,500 to $2,99921 $3,000 to $3,49911 $3,500 or more89 No cash rent
Median gross rent in 2022: $1,572.
Median price asked for vacant for-sale houses and condos in 2022: $177,423.
Estimated median house (or condo) value in 2022 for: White Non-Hispanic householders: $366,025Black or African American householders: $336,971American Indian or Alaska Native householders: $234,996Asian householders: $371,437Some other race householders: $305,068Two or more races householders: $302,789Hispanic or Latino householders: $305,068Estimated median house or condo value in 2022: $290,257
85208:
$290,257Arizona:
$402,800
Lower value quartile - upper value quartile: $143,902 - $420,963
Mean price in 2022: Detached houses: $274,069Here:
$274,069State:
$521,408
Townhouses or other attached units: $384,993Here:
$384,993State:
$387,465
In 2-unit structures: $109,786Here:
$109,786State:
$1,060,724
In 3-to-4-unit structures: $497,037Here:
$497,037State:
$342,505
In 5-or-more-unit structures: $321,539Here:
$321,539State:
$371,286
Mobile homes: $98,086Here:
$98,086State:
$141,516
Occupied boats, RVs, vans, etc.: $36,982Here:
$36,982State:
$60,504
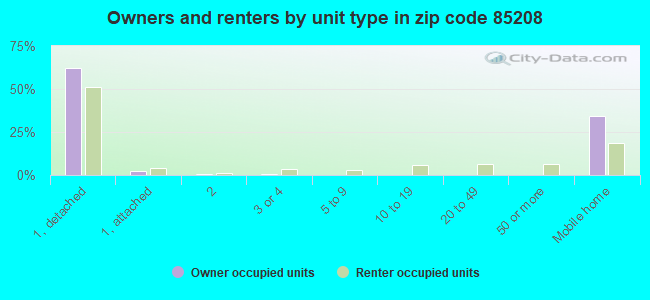
Housing units in structures:
One, detached: 10,071One, attached: 714Two: 973 or 4: 2205 to 9: 18410 to 19: 26020 to 49: 28650 or more: 291Mobile homes: 6,546Boats, RVs, vans, etc.: 30Unemployment : 5.2%
Means of transportation to work in zip code 85208 66.5% 10,694 Drove a car alone14.4% 2,320 Carpooled0.3% 43 Bus or trolley bus0.1% 20 Taxi0.5% 82 Motorcycle0.2% 26 Bicycle2.4% 387 Walked1.6% 263 Other means12.5% 2,016 Worked at homeTravel time to work (commute) in zip code 85208 208 Less than 5 minutes1,184 5 to 9 minutes1,547 10 to 14 minutes2,459 15 to 19 minutes2,180 20 to 24 minutes978 25 to 29 minutes2,211 30 to 34 minutes601 35 to 39 minutes765 40 to 44 minutes1,111 45 to 59 minutes387 60 to 89 minutes120 90 or more minutes
Neighborhoods in zip code 85208: Percentage of zip code residents living and working in this county: 94.3%
Household type by relationship:
Households: 38,501
Male householders: 8,204 (1,832 living alone ), Female householders: 7,384 (2,708 living alone )6,980 spouses (6,852 opposite-sex spouses ), 1,016 unmarried partners , (988 opposite-sex unmarried partners ), 9,870 children (9,031 natural , 242 adopted , 595 stepchildren ), 887 grandchildren , 423 brothers or sisters , 592 parents , 144 foster children , 1,336 other relatives , 1,422 non-relatives In group quarters: 266 (-1 institutionalized population )
Size of family households: 4,645 2-persons , 1,799 3-persons , 1,516 4-persons , 1,177 5-persons , 276 6-persons , 452 7-or-more-persons
Size of nonfamily households: 4,535 1-person , 871 2-persons , 194 3-persons , 68 4-persons , 14 5-persons , 10 6-persons
4,509 married couples with children. single-parent households (792 men , 1,309 women ).
82.0% of residents of 85208 zip code speak English at home. of residents speak Spanish at home (63% very well, 18% well, 15% not well, 5% not at all ).of residents speak other Indo-European language at home (82% very well, 14% well, 3% not well ).of residents speak Asian or Pacific Island language at home (65% very well, 20% well, 13% not well, 2% not at all ).of residents speak other language at home (60% very well, 40% well ).
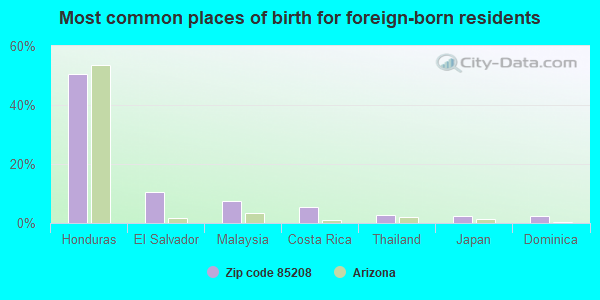
Foreign born population: 3,789 (9.8%)
(53.7%
of them are naturalized citizens )
This zip code:
9.8%Whole state:
13.1%
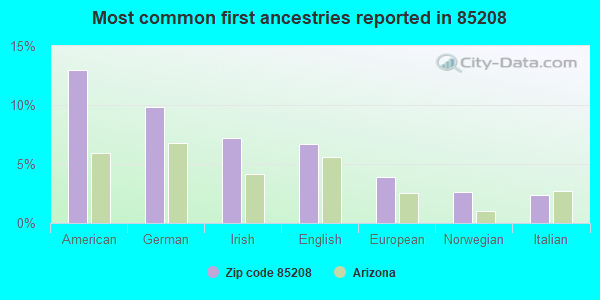
51% Honduras 11% El Salvador 8% Malaysia 6% Costa Rica 3% Thailand 2% Japan 2% Dominica 13% American 10% German 7% Irish 7% English 4% European 3% Norwegian 2% Italian
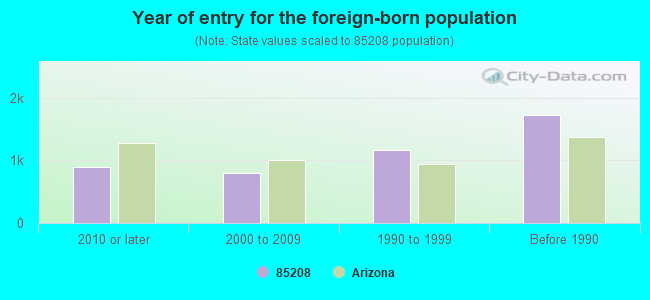
Year of entry for the foreign-born population
894 2010 or later 807 2000 to 2009 1,172 1990 to 1999 1,727 Before 1990
There are
68 Medical Specialists in Zip Code 85208 .
Facilities with environmental interests located in this zip code:
GM DESERT PROVING GROUND (13303 SOUTH ELLSWORTH ROAD in MESA, AZ)
STATE MASTER (Arizona's Tracking Of The Environment) - AZURITE-1401, GROUND WATER PROGRAM, LEAKING STORAGE TANK, WASTE, UNDERGROUND STORAGE TANK PROGRAM HAZARDOUS WASTE BIENNIAL REPORTER (Resource Conservation and Recovery Act (tracking hazardous waste)) Large Quantity Generators, more that 1000 kg of hazardous waste/month (Resource Conservation and Recovery Act (tracking hazardous waste)) TSD (Resource Conservation and Recovery Act (tracking hazardous waste)) Organizations: GENERAL MOTORS CORP (CONTACT/GENERAL)
, GMC GM DESERT PROVING GROUND MESA (CONTACT/OPERATOR)
Alternative names: DESERT PROVING GROUNDS - GENERAL MOTORS CORP, GMC DESERT PROVING GROUND MESA, GMC PROVING GROUNDS, GENERAL MOTORS - PROVING GROUNDS
BOULDER CANYON LEARNING CENTER (10222 E. SOUTHERN in MESA, AZ)
(National Center for Education Statistics) - STATE ID-280 Organizations: MESA UNIFIED DISTRICT (SCHOOL DISTRICT)
DILWORTH BRINTON (11455 E. SUNLAND AVE. in MESA, AZ)
(National Center for Education Statistics) - STATE ID-156 Organizations: MESA UNIFIED DISTRICT (SCHOOL DISTRICT)
NOAH WEBSTER BASIC SCHOOL (8350 EAST BASELINE ROAD in MESA, AZ)
(National Center for Education Statistics) - STATE ID-101
FRYS FOOD & DRUG STORES #115 (435 ELLSWORTH RD in MESA, AZ)
(Resource Conservation and Recovery Act (tracking hazardous waste)) Organizations: KROGER CO (CONTACT/OWNER)
Alternative names: FRYS FOOD & DRUG STORES 115, FRYS FOOD STORES 115
BULLDOG CLEANERS (1925 S SOSSAMAN STE 107 in MESA, AZ)
Small Quantity Generators, between 100 kg and 1000 kg of hazardous waste/month (Resource Conservation and Recovery Act (tracking hazardous waste)) Organizations: BRIAN ANADORE (IRENE) (CONTACT/OPERATOR)
EAST MESA AUTO REPAIR CENTER INC (8027 E APACHE TRAIL in MESA, AZ)
Small Quantity Generators, between 100 kg and 1000 kg of hazardous waste/month (Resource Conservation and Recovery Act (tracking hazardous waste)) - notification Business NAICS classification: GENERAL AUTOMOTIVE REPAIR.; AUTOMOTIVE BODY, PAINT, AND INTERIOR REPAIR AND MAINTENANCE.Organizations: BILL TAYLOR (CONTACT/OWNER)
HOME DEPOT #HD0404 (1545 S CRIMSON RD in MESA, AZ)
Small Quantity Generators, between 100 kg and 1000 kg of hazardous waste/month (Resource Conservation and Recovery Act (tracking hazardous waste)) Organizations: HOME DEPOT USA (CONTACT/OPERATOR)
Alternative names: HOME DEPOT 0404
HOME DEPOT USA INC HD 0456 (6838 E SUPERSTITION SPRINGS BL in MESA, AZ)
Small Quantity Generators, between 100 kg and 1000 kg of hazardous waste/month (Resource Conservation and Recovery Act (tracking hazardous waste)) Organizations: THE HOME DEPOT (CONTACT/OWNER)
Alternative names: HOME DEPOT 456 3 E COMPANY, HOME DEPOT THE 456/3E CO
WALGREENS #5392 (420 SOSSAMAN RD in MESA, AZ)
(Resource Conservation and Recovery Act (tracking hazardous waste)) Business NAICS classification: ONE-HOUR PHOTOFINISHING.
Housing units lacking complete plumbing facilities: 0.5%
Housing units lacking complete kitchen facilities: 0.2%
82.8% Electricity 15.2% Utility gas 0.9% No fuel used 0.6% Bottled, tank, or LP gas
Population in 1990: 22,113. Population change in the 1990s: +19,942 (+90.2%).
Place of birth for U.S.-born residents:
This state: 12,728Northeast: 2,921Midwest: 9,118South: 2,468West: 6,450
40% of the 85208 zip code residents lived in the same house 5 years ago.
Out of people who lived in different houses, 54% lived in this county.
Out of people who lived in different counties, 50% lived in Arizona.
88% of the 85208 zip code residents lived in the same house 1 year ago.
Out of people who lived in different houses, 47% moved from this county.
Out of people who lived in different houses, 10% moved from different county within same state.
Out of people who lived in different houses, 41% moved from different state.
Out of people who lived in different houses, 4% moved from abroad.
Private vs. public school enrollment:
Students in private schools in grades 1 to 8 (elementary and middle school): 493
Students in private schools in grades 9 to 12 (high school): 96
Students in private undergraduate colleges: 197
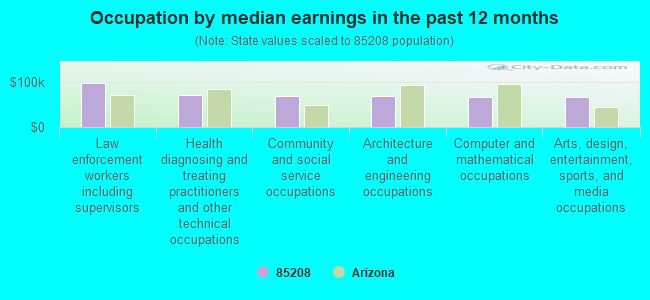
Occupation by median earnings in the past 12 months ($)
98,268 Law enforcement workers including supervisors 70,545 Health diagnosing and treating practitioners and other technical occupations 68,760 Community and social service occupations 68,542 Architecture and engineering occupations 67,857 Computer and mathematical occupations 67,161 Arts, design, entertainment, sports, and media occupations
Companies with federal contracts located in this zip code:
INTEGRATED TECHNOLOGY WORKS, I (7640 EAST HARMONY AVENUE in MESA, AZ; small business) in 254 contracts from 2000 to 2006
Contracts for Custodial Janitorial Services, Misc Fiber Optic Components by Air Force, Internal Revenue Service, Navy, Minerals Management Service, and others Signed by year: 2000: $1,664,000; 2001: $1,869,501; 2002: $3,983,501; 2003: $4,309,737; 2004: $1,907,294; 2005: $3,400,177; 2006: $36,191.
Biggest contracts: with Air Force for Custodial Janitorial Services. Taking place in CA. Signed on 2005-10-28. Completion date: 2006-09-30.
, same as above. Signed on 2004-10-18. Completion date: 2005-09-30.
, same as above. Signed on 2003-10-30. Completion date: 2004-09-30.
with Internal Revenue Service for Custodial Janitorial Services. Taking place in DC. Signed on 2000-11-15. Completion date: 2001-02-15.
SUNRIDGE PROPERTIES INC (1440 S CLEARVIEW AVE #101 in MESA, AZ)
$14,965 with Army for Miscellaneous Items. Signed on 2003-12-03. Completion date: 2003-12-01.
MAYNARD, DAVID (7325 E LAKEVIEW AVE in MESA, AZ; small business)
$10,000 with Army for Fiber Optic Devices. Signed on 2004-03-18. Completion date: 2004-03-26.
Top industries in this zip code by the number of employees in 2005:
Information: Wired Telecommunications Carriers (250-499 employees: 1 establishment, 100-249 employees: 1 establishment, 50-99 employees: 1 establishment, 1-4 employees: 2 establishments)Accommodation and Food Services: Full-Service Restaurants (100-249: 1, 50-99: 3, 20-49: 2, 10-19: 3)Accommodation and Food Services: Limited-Service Restaurants (50-99: 1, 20-49: 11, 10-19: 2, 5-9: 1, 1-4: 4)Educational Services: Elementary and Secondary Schools (100-249: 1, 1-4: 1)Construction: Masonry Contractors (50-99: 1, 10-19: 1, 1-4: 3)
People in group quarters in 2010:
221 people in nursing facilities/skilled-nursing facilities
29 people in hospitals with patients who have no usual home elsewhere
13 people in workers' group living quarters and job corps centers
10 people in group homes intended for adults
6 people in group homes for juveniles (non-correctional)
People in group quarters in 2000:
77 people in nursing homes
17 people in other noninstitutional group quarters
12 people in homes for abused, dependent, and neglected children
Fatal accident statistics in 2014:
Fatal accident count: 5Vehicles involved in fatal accidents: 6Fatal accidents caused by drunken drivers: 0Fatalities: 5Persons involved in fatal accidents: 6Pedestrians involved in fatal accidents: 2
Fatal accident statistics in 2013:
Fatal accident count: 6Vehicles involved in fatal accidents: 9Fatal accidents caused by drunken drivers: 0Fatalities: 6Persons involved in fatal accidents: 9Pedestrians involved in fatal accidents: 1
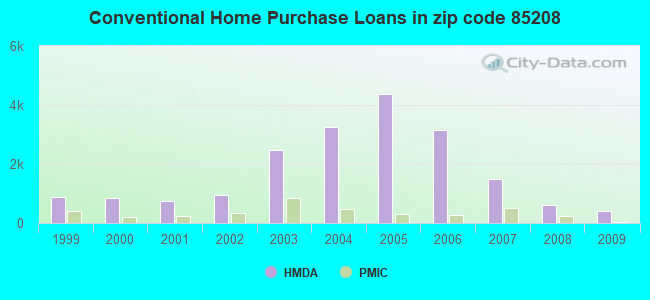
Home Mortgage Disclosure Act Aggregated Statistics For Year 2009(Based on 9 full and 10 partial tracts) A) FHA, FSA/RHS & VA B) Conventional C) Refinancings D) Home Improvement Loans E) Loans on Dwellings For 5+ Families F) Non-occupant Loans on G) Loans On Manufactured Number Average Value Number Average Value Number Average Value Number Average Value Number Average Value Number Average Value Number Average Value
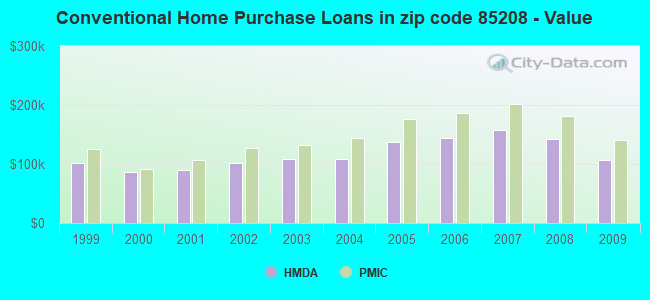
LOANS ORIGINATED 903 $132,602 414 $107,248 1,125 $152,199 11 $68,815 2 $6,460,560 268 $107,421 142 $96,690 APPLICATIONS APPROVED, NOT ACCEPTED 37 $155,597 56 $88,749 181 $140,233 10 $8,799 0 $0 29 $110,913 46 $65,105 APPLICATIONS DENIED 100 $122,048 98 $109,825 561 $149,389 74 $33,438 0 $0 78 $120,419 107 $76,034 APPLICATIONS WITHDRAWN 102 $126,676 53 $120,967 322 $155,444 23 $68,587 0 $0 41 $114,044 39 $92,713 FILES CLOSED FOR INCOMPLETENESS 13 $136,258 8 $84,514 74 $147,064 8 $50,491 0 $0 11 $76,448 17 $72,871
Aggregated Statistics For Year 2008(Based on 9 full and 10 partial tracts) A) FHA, FSA/RHS & VA B) Conventional C) Refinancings D) Home Improvement Loans E) Loans on Dwellings For 5+ Families F) Non-occupant Loans on G) Loans On Manufactured Number Average Value Number Average Value Number Average Value Number Average Value Number Average Value Number Average Value Number Average Value
LOANS ORIGINATED 591 $170,281 613 $142,447 1,065 $164,131 94 $66,819 2 $22,702,275 249 $133,017 259 $108,246 APPLICATIONS APPROVED, NOT ACCEPTED 41 $150,588 104 $128,633 199 $165,847 19 $36,693 0 $0 30 $132,207 72 $88,839 APPLICATIONS DENIED 123 $163,348 180 $134,574 1,086 $168,873 165 $67,329 2 $218,585 120 $149,571 216 $77,155 APPLICATIONS WITHDRAWN 59 $151,209 96 $152,348 370 $171,714 39 $68,141 2 $125,760 55 $137,935 51 $103,420 FILES CLOSED FOR INCOMPLETENESS 12 $146,108 18 $175,423 103 $174,128 14 $49,179 0 $0 16 $142,869 21 $113,433
Aggregated Statistics For Year 2007(Based on 9 full and 10 partial tracts) A) FHA, FSA/RHS & VA B) Conventional C) Refinancings D) Home Improvement Loans E) Loans on Dwellings For 5+ Families F) Non-occupant Loans on G) Loans On Manufactured Number Average Value Number Average Value Number Average Value Number Average Value Number Average Value Number Average Value Number Average Value
LOANS ORIGINATED 254 $176,804 1,483 $157,545 2,073 $162,888 341 $75,972 2 $607,055 426 $154,664 443 $99,706 APPLICATIONS APPROVED, NOT ACCEPTED 22 $180,519 234 $159,740 501 $165,414 105 $76,384 0 $0 67 $155,722 78 $85,472 APPLICATIONS DENIED 46 $171,099 515 $154,352 1,891 $177,519 437 $71,779 1 $2,293,840 231 $156,930 398 $83,545 APPLICATIONS WITHDRAWN 59 $175,408 302 $146,446 740 $178,131 98 $131,140 2 $23,928,480 94 $154,715 87 $102,711 FILES CLOSED FOR INCOMPLETENESS 2 $77,350 52 $163,692 251 $202,101 23 $56,064 0 $0 27 $162,101 17 $90,048
Aggregated Statistics For Year 2006(Based on 9 full and 10 partial tracts) A) FHA, FSA/RHS & VA B) Conventional C) Refinancings D) Home Improvement Loans E) Loans on Dwellings For 5+ Families F) Non-occupant Loans on G) Loans On Manufactured Number Average Value Number Average Value Number Average Value Number Average Value Number Average Value Number Average Value Number Average Value
LOANS ORIGINATED 190 $193,058 3,162 $144,355 3,292 $168,595 470 $93,022 4 $18,159,552 806 $153,556 537 $91,581 APPLICATIONS APPROVED, NOT ACCEPTED 12 $171,725 529 $134,505 568 $165,877 113 $66,275 0 $0 111 $151,799 124 $84,835 APPLICATIONS DENIED 45 $157,645 856 $146,519 1,805 $164,826 464 $85,796 0 $0 192 $158,364 427 $81,147 APPLICATIONS WITHDRAWN 38 $199,101 740 $141,580 1,145 $174,031 123 $116,033 0 $0 174 $164,630 93 $88,905 FILES CLOSED FOR INCOMPLETENESS 4 $146,665 127 $155,675 335 $181,940 10 $93,316 0 $0 40 $171,535 13 $108,077
Aggregated Statistics For Year 2005(Based on 9 full and 10 partial tracts) A) FHA, FSA/RHS & VA B) Conventional C) Refinancings D) Home Improvement Loans E) Loans on Dwellings For 5+ Families F) Non-occupant Loans on G) Loans On Manufactured Number Average Value Number Average Value Number Average Value Number Average Value Number Average Value Number Average Value Number Average Value
LOANS ORIGINATED 112 $159,412 4,368 $136,585 4,960 $158,320 407 $93,179 1 $349,180 1,458 $140,100 447 $77,408 APPLICATIONS APPROVED, NOT ACCEPTED 8 $110,439 513 $117,890 691 $148,656 151 $52,279 0 $0 149 $137,370 127 $76,100 APPLICATIONS DENIED 30 $116,020 873 $126,709 1,817 $140,068 442 $58,995 0 $0 245 $134,448 407 $74,412 APPLICATIONS WITHDRAWN 16 $156,001 754 $135,007 1,270 $148,373 176 $112,427 0 $0 196 $132,302 98 $84,478 FILES CLOSED FOR INCOMPLETENESS 4 $87,412 208 $126,343 642 $159,612 30 $71,355 0 $0 66 $139,200 18 $81,665
Aggregated Statistics For Year 2004(Based on 9 full and 10 partial tracts) A) FHA, FSA/RHS & VA B) Conventional C) Refinancings D) Home Improvement Loans E) Loans on Dwellings For 5+ Families F) Non-occupant Loans on G) Loans On Manufactured Number Average Value Number Average Value Number Average Value Number Average Value Number Average Value Number Average Value Number Average Value
LOANS ORIGINATED 242 $133,634 3,259 $107,986 2,816 $118,867 253 $42,854 3 $1,819,043 832 $109,216 331 $65,795 APPLICATIONS APPROVED, NOT ACCEPTED 12 $121,035 403 $99,243 592 $117,801 73 $32,351 0 $0 102 $104,421 114 $68,635 APPLICATIONS DENIED 47 $121,445 663 $101,034 1,913 $118,976 396 $38,184 0 $0 168 $98,973 367 $65,684 APPLICATIONS WITHDRAWN 36 $133,273 507 $121,225 1,188 $126,626 104 $63,085 0 $0 109 $96,762 122 $79,522 FILES CLOSED FOR INCOMPLETENESS 7 $146,813 98 $123,114 228 $129,846 24 $57,261 0 $0 46 $119,072 7 $85,454
Aggregated Statistics For Year 2003(Based on 9 full and 10 partial tracts) A) FHA, FSA/RHS & VA B) Conventional C) Refinancings D) Home Improvement Loans E) Loans on Dwellings For 5+ Families F) Non-occupant Loans on Number Average Value Number Average Value Number Average Value Number Average Value Number Average Value Number Average Value
LOANS ORIGINATED 555 $131,091 2,478 $107,712 5,781 $112,505 234 $23,133 2 $256,880 717 $99,481 APPLICATIONS APPROVED, NOT ACCEPTED 23 $123,530 294 $96,213 901 $109,197 76 $23,767 0 $0 82 $97,762 APPLICATIONS DENIED 102 $135,653 499 $99,001 2,001 $101,797 305 $25,076 0 $0 128 $82,865 APPLICATIONS WITHDRAWN 92 $126,673 423 $120,060 1,363 $112,214 68 $28,113 0 $0 97 $92,534 FILES CLOSED FOR INCOMPLETENESS 6 $150,843 46 $116,807 194 $119,176 4 $42,282 0 $0 11 $110,965
Aggregated Statistics For Year 2002(Based on 3 full and 6 partial tracts) A) FHA, FSA/RHS & VA B) Conventional C) Refinancings D) Home Improvement Loans F) Non-occupant Loans on Number Average Value Number Average Value Number Average Value Number Average Value Number Average Value
LOANS ORIGINATED 558 $130,089 957 $101,066 1,446 $93,912 89 $17,132 246 $79,745 APPLICATIONS APPROVED, NOT ACCEPTED 17 $134,770 170 $94,577 253 $85,738 26 $26,655 15 $72,753 APPLICATIONS DENIED 103 $130,944 217 $81,034 649 $77,474 119 $16,242 40 $81,286 APPLICATIONS WITHDRAWN 169 $129,359 164 $114,179 455 $99,449 29 $44,763 30 $82,428 FILES CLOSED FOR INCOMPLETENESS 6 $111,503 15 $137,752 57 $81,540 0 $0 7 $107,267
Aggregated Statistics For Year 2001(Based on 3 full and 6 partial tracts) A) FHA, FSA/RHS & VA B) Conventional C) Refinancings D) Home Improvement Loans E) Loans on Dwellings For 5+ Families F) Non-occupant Loans on Number Average Value Number Average Value Number Average Value Number Average Value Number Average Value Number Average Value
LOANS ORIGINATED 364 $114,705 754 $90,562 1,237 $87,048 85 $24,122 1 $788,610 207 $80,437 APPLICATIONS APPROVED, NOT ACCEPTED 12 $140,690 130 $80,362 214 $72,142 38 $20,809 0 $0 18 $75,755 APPLICATIONS DENIED 30 $115,355 277 $75,608 652 $66,628 140 $20,626 1 $503,890 52 $81,746 APPLICATIONS WITHDRAWN 47 $120,667 102 $93,783 388 $91,999 21 $24,278 0 $0 21 $70,340 FILES CLOSED FOR INCOMPLETENESS 6 $137,688 19 $98,509 63 $92,648 2 $65,020 0 $0 2 $67,975
Aggregated Statistics For Year 2000(Based on 3 full and 6 partial tracts) A) FHA, FSA/RHS & VA B) Conventional C) Refinancings D) Home Improvement Loans F) Non-occupant Loans on Number Average Value Number Average Value Number Average Value Number Average Value Number Average Value
LOANS ORIGINATED 529 $110,977 839 $85,663 411 $61,700 137 $20,412 125 $83,369 APPLICATIONS APPROVED, NOT ACCEPTED 51 $114,687 162 $64,341 111 $58,832 99 $22,240 23 $65,354 APPLICATIONS DENIED 99 $108,226 501 $62,137 368 $52,282 204 $22,245 17 $49,954 APPLICATIONS WITHDRAWN 86 $108,136 117 $88,813 181 $69,064 17 $41,489 12 $58,646 FILES CLOSED FOR INCOMPLETENESS 13 $97,042 27 $103,294 85 $72,491 0 $0 0 $0
Aggregated Statistics For Year 1999(Based on 3 full and 3 partial tracts) A) FHA, FSA/RHS & VA B) Conventional C) Refinancings D) Home Improvement Loans E) Loans on Dwellings For 5+ Families F) Non-occupant Loans on Number Average Value Number Average Value Number Average Value Number Average Value Number Average Value Number Average Value
LOANS ORIGINATED 403 $111,891 881 $102,013 533 $73,073 125 $37,145 4 $406,922 119 $81,381 APPLICATIONS APPROVED, NOT ACCEPTED 15 $111,130 168 $83,433 123 $68,398 55 $22,488 0 $0 27 $80,328 APPLICATIONS DENIED 65 $110,878 321 $76,255 318 $58,332 168 $20,443 0 $0 27 $71,473 APPLICATIONS WITHDRAWN 56 $115,281 162 $103,355 168 $70,923 17 $28,226 1 $87,440 16 $79,967 FILES CLOSED FOR INCOMPLETENESS 5 $104,670 24 $110,987 66 $70,805 4 $24,102 1 $83,600 3 $105,640
Private Mortgage Insurance Companies Aggregated Statistics For Year 2009(Based on 9 full and 10 partial tracts) A) Conventional B) Refinancings C) Non-occupant Loans on Number Average Value Number Average Value Number Average Value
LOANS ORIGINATED 48 $140,165 21 $165,791 2 $72,325 APPLICATIONS APPROVED, NOT ACCEPTED 19 $162,513 16 $170,481 0 $0 APPLICATIONS DENIED 6 $104,462 2 $112,885 4 $111,838 APPLICATIONS WITHDRAWN 1 $46,190 2 $128,045 0 $0 FILES CLOSED FOR INCOMPLETENESS 0 $0 4 $149,582 2 $214,590
Aggregated Statistics For Year 2008(Based on 9 full and 10 partial tracts) A) Conventional B) Refinancings C) Non-occupant Loans on D) Loans On Manufactured Number Average Value Number Average Value Number Average Value Number Average Value
LOANS ORIGINATED 238 $181,008 76 $213,853 34 $177,532 4 $87,688 APPLICATIONS APPROVED, NOT ACCEPTED 143 $188,425 86 $222,718 29 $196,473 2 $102,650 APPLICATIONS DENIED 30 $142,214 5 $174,382 10 $153,076 0 $0 APPLICATIONS WITHDRAWN 7 $163,297 8 $212,918 6 $138,943 0 $0 FILES CLOSED FOR INCOMPLETENESS 30 $181,812 6 $164,448 22 $173,420 0 $0
Aggregated Statistics For Year 2007(Based on 9 full and 10 partial tracts) A) Conventional B) Refinancings C) Non-occupant Loans on D) Loans On Manufactured Number Average Value Number Average Value Number Average Value Number Average Value
LOANS ORIGINATED 523 $200,935 201 $216,695 51 $167,109 25 $116,373 APPLICATIONS APPROVED, NOT ACCEPTED 103 $174,129 65 $236,276 10 $172,666 4 $79,385 APPLICATIONS DENIED 7 $181,763 7 $179,674 4 $175,150 0 $0 APPLICATIONS WITHDRAWN 33 $179,461 27 $222,535 13 $197,925 0 $0 FILES CLOSED FOR INCOMPLETENESS 5 $154,930 0 $0 1 $22,030 0 $0
Aggregated Statistics For Year 2006(Based on 9 full and 10 partial tracts) A) Conventional B) Refinancings C) Non-occupant Loans on D) Loans On Manufactured Number Average Value Number Average Value Number Average Value Number Average Value
LOANS ORIGINATED 280 $185,791 111 $219,676 46 $158,397 49 $108,667 APPLICATIONS APPROVED, NOT ACCEPTED 105 $181,500 40 $210,358 30 $166,045 2 $106,895 APPLICATIONS DENIED 9 $175,411 4 $218,585 1 $44,050 2 $86,945 APPLICATIONS WITHDRAWN 30 $179,547 9 $289,356 12 $192,970 0 $0 FILES CLOSED FOR INCOMPLETENESS 32 $155,852 4 $174,078 0 $0 0 $0
Aggregated Statistics For Year 2005(Based on 9 full and 10 partial tracts) A) Conventional B) Refinancings C) Non-occupant Loans on D) Loans On Manufactured Number Average Value Number Average Value Number Average Value Number Average Value
LOANS ORIGINATED 309 $175,871 181 $185,097 77 $160,525 57 $93,013 APPLICATIONS APPROVED, NOT ACCEPTED 224 $157,621 59 $164,109 8 $140,364 6 $90,900 APPLICATIONS DENIED 2 $152,870 2 $216,960 2 $108,480 0 $0 APPLICATIONS WITHDRAWN 18 $169,293 17 $150,652 8 $177,232 0 $0 FILES CLOSED FOR INCOMPLETENESS 11 $192,242 2 $154,735 0 $0 0 $0
Aggregated Statistics For Year 2004(Based on 9 full and 10 partial tracts) A) Conventional B) Refinancings C) Non-occupant Loans on D) Loans On Manufactured Number Average Value Number Average Value Number Average Value Number Average Value
LOANS ORIGINATED 473 $144,278 276 $149,788 80 $144,815 28 $76,798 APPLICATIONS APPROVED, NOT ACCEPTED 90 $138,561 112 $146,356 22 $127,840 8 $87,135 APPLICATIONS DENIED 7 $143,349 3 $114,383 0 $0 1 $57,480 APPLICATIONS WITHDRAWN 23 $137,480 26 $131,583 6 $123,145 0 $0 FILES CLOSED FOR INCOMPLETENESS 0 $0 2 $176,665 0 $0 0 $0
Aggregated Statistics For Year 2003(Based on 9 full and 10 partial tracts) A) Conventional B) Refinancings C) Non-occupant Loans on Number Average Value Number Average Value Number Average Value
LOANS ORIGINATED 847 $131,453 945 $134,822 170 $122,529 APPLICATIONS APPROVED, NOT ACCEPTED 70 $128,641 249 $140,925 27 $126,296 APPLICATIONS DENIED 11 $106,120 22 $146,465 9 $142,699 APPLICATIONS WITHDRAWN 24 $116,873 50 $130,822 9 $96,386 FILES CLOSED FOR INCOMPLETENESS 4 $90,212 6 $123,805 2 $74,775
Aggregated Statistics For Year 2002(Based on 3 full and 6 partial tracts) A) Conventional B) Refinancings C) Non-occupant Loans on Number Average Value Number Average Value Number Average Value
LOANS ORIGINATED 331 $126,978 214 $117,117 40 $95,854 APPLICATIONS APPROVED, NOT ACCEPTED 40 $149,154 52 $110,954 2 $69,275 APPLICATIONS DENIED 2 $131,120 9 $104,831 7 $116,396 APPLICATIONS WITHDRAWN 17 $139,790 8 $112,174 0 $0 FILES CLOSED FOR INCOMPLETENESS 2 $81,330 0 $0 0 $0
Aggregated Statistics For Year 2001(Based on 3 full and 6 partial tracts) A) Conventional B) Refinancings C) Non-occupant Loans on Number Average Value Number Average Value Number Average Value
LOANS ORIGINATED 254 $106,598 156 $109,497 35 $86,254 APPLICATIONS APPROVED, NOT ACCEPTED 25 $94,335 34 $105,585 0 $0 APPLICATIONS DENIED 8 $106,140 15 $102,170 3 $96,033 APPLICATIONS WITHDRAWN 1 $68,000 8 $134,944 0 $0 FILES CLOSED FOR INCOMPLETENESS 0 $0 0 $0 0 $0
Aggregated Statistics For Year 2000(Based on 3 full and 6 partial tracts) A) Conventional B) Refinancings C) Non-occupant Loans on Number Average Value Number Average Value Number Average Value
LOANS ORIGINATED 219 $91,826 51 $86,617 43 $84,850 APPLICATIONS APPROVED, NOT ACCEPTED 27 $87,749 6 $105,825 5 $83,512 APPLICATIONS DENIED 13 $83,184 2 $89,615 0 $0 APPLICATIONS WITHDRAWN 4 $66,975 2 $85,780 2 $65,090 FILES CLOSED FOR INCOMPLETENESS 1 $60,170 0 $0 0 $0
Aggregated Statistics For Year 1999(Based on 3 full and 3 partial tracts) A) Conventional B) Refinancings C) Non-occupant Loans on Number Average Value Number Average Value Number Average Value
LOANS ORIGINATED 397 $125,309 74 $114,757 28 $100,482 APPLICATIONS APPROVED, NOT ACCEPTED 40 $118,077 18 $103,611 2 $76,085 APPLICATIONS DENIED 22 $128,125 5 $131,340 1 $110,160 APPLICATIONS WITHDRAWN 15 $125,844 5 $118,496 3 $75,150 FILES CLOSED FOR INCOMPLETENESS 5 $129,180 1 $111,600 0 $0
Most common first names in zip code 85208 among deceased individuals Name Count Lived (average)
Robert 269 74.5 years John 246 76.4 years William 211 75.5 years James 184 75.0 years Charles 152 75.8 years Mary 135 78.7 years George 112 78.9 years Donald 109 74.7 years Dorothy 103 78.0 years Helen 98 80.6 years
Most common last names in zip code 85208 among deceased individuals Last name Count Lived (average)
Johnson 90 78.5 years Smith 69 76.7 years Davis 45 75.4 years Miller 45 77.7 years Nelson 41 79.6 years Brown 39 76.7 years Jones 38 77.8 years Taylor 38 78.4 years Anderson 38 78.2 years Williams 33 77.9 years
Businesses in zip code 85208
Name Count Name Count
99 Cents Only Stores 1 Outback 1 Albertsons 1 Outback Steakhouse 1 Blockbuster 1 Panda Express 3 CVS 1 Papa John's Pizza 1 Chuck E. Cheese's 1 Quiznos 1 Cricket Wireless 1 SONIC Drive-In 1 Domino's Pizza 1 Safeway 1 FedEx 1 Sears 1 H&R Block 1 Starbucks 3 IHOP 1 Subway 3 IZOD 1 Vons 1 Kroger 1 Walgreens 3 Long John Silver's 1 Wendy's 2 Nike 1

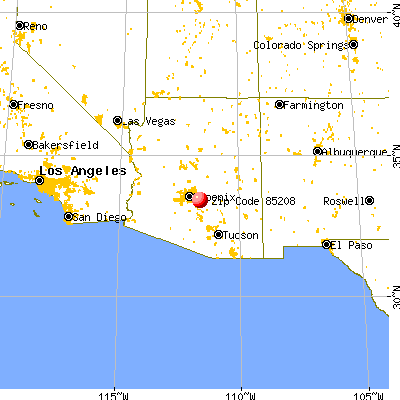


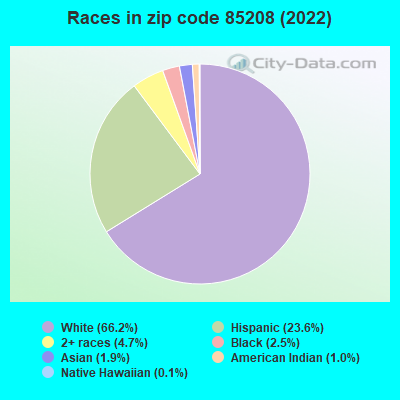


+$333
-$7,013
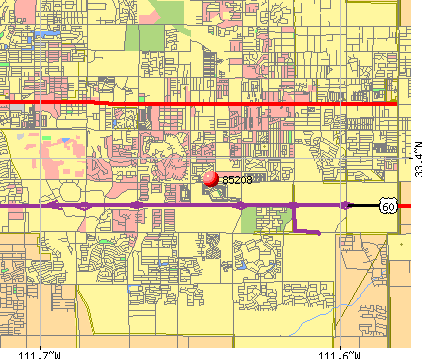 Nearest zip codes: 85209, 85207, 85120, 85212, 85206, 85205.