Fountain Hills, Arizona Submit your own pictures of this town and show them to the world
OSM Map
General Map
Google Map
MSN Map
OSM Map
General Map
Google Map
MSN Map
OSM Map
General Map
Google Map
MSN Map
OSM Map
General Map
Google Map
MSN Map
Please wait while loading the map...
Population in 2022: 23,785 (98% urban, 2% rural). Population change since 2000: +17.5%Males: 11,804 Females: 11,981
March 2022 cost of living index in Fountain Hills: 103.2 (near average, U.S. average is 100) Percentage of residents living in poverty in 2022: 5.5%for White Non-Hispanic residents , 1.5% for Black residents , 2.5% for Hispanic or Latino residents , 16.1% for American Indian residents , 15.0% for other race residents , 11.9% for two or more races residents )
Profiles of local businesses
Business Search - 14 Million verified businesses
Data:
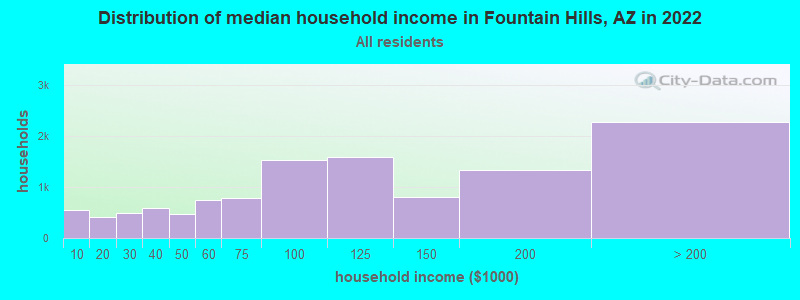
Median household income ($)
Median household income (% change since 2000)
Household income diversity
Ratio of average income to average house value (%)
Ratio of average income to average rent
Median household income ($) - White
Median household income ($) - Black or African American
Median household income ($) - Asian
Median household income ($) - Hispanic or Latino
Median household income ($) - American Indian and Alaska Native
Median household income ($) - Multirace
Median household income ($) - Other Race
Median household income for houses/condos with a mortgage ($)
Median household income for apartments without a mortgage ($)
Races - White alone (%)
Races - White alone (% change since 2000)
Races - Black alone (%)
Races - Black alone (% change since 2000)
Races - American Indian alone (%)
Races - American Indian alone (% change since 2000)
Races - Asian alone (%)
Races - Asian alone (% change since 2000)
Races - Hispanic (%)
Races - Hispanic (% change since 2000)
Races - Native Hawaiian and Other Pacific Islander alone (%)
Races - Native Hawaiian and Other Pacific Islander alone (% change since 2000)
Races - Two or more races (%)
Races - Two or more races (% change since 2000)
Races - Other race alone (%)
Races - Other race alone (% change since 2000)
Racial diversity
Unemployment (%)
Unemployment (% change since 2000)
Unemployment (%) - White
Unemployment (%) - Black or African American
Unemployment (%) - Asian
Unemployment (%) - Hispanic or Latino
Unemployment (%) - American Indian and Alaska Native
Unemployment (%) - Multirace
Unemployment (%) - Other Race
Population density (people per square mile)
Population - Males (%)
Population - Females (%)
Population - Males (%) - White
Population - Males (%) - Black or African American
Population - Males (%) - Asian
Population - Males (%) - Hispanic or Latino
Population - Males (%) - American Indian and Alaska Native
Population - Males (%) - Multirace
Population - Males (%) - Other Race
Population - Females (%) - White
Population - Females (%) - Black or African American
Population - Females (%) - Asian
Population - Females (%) - Hispanic or Latino
Population - Females (%) - American Indian and Alaska Native
Population - Females (%) - Multirace
Population - Females (%) - Other Race
Coronavirus confirmed cases (Apr 27, 2024)
Deaths caused by coronavirus (Apr 27, 2024)
Coronavirus confirmed cases (per 100k population) (Apr 27, 2024)
Deaths caused by coronavirus (per 100k population) (Apr 27, 2024)
Daily increase in number of cases (Apr 27, 2024)
Weekly increase in number of cases (Apr 27, 2024)
Cases doubled (in days) (Apr 27, 2024)
Hospitalized patients (Apr 18, 2022)
Negative test results (Apr 18, 2022)
Total test results (Apr 18, 2022)
COVID Vaccine doses distributed (per 100k population) (Sep 19, 2023)
COVID Vaccine doses administered (per 100k population) (Sep 19, 2023)
COVID Vaccine doses distributed (Sep 19, 2023)
COVID Vaccine doses administered (Sep 19, 2023)
Likely homosexual households (%)
Likely homosexual households (% change since 2000)
Likely homosexual households - Lesbian couples (%)
Likely homosexual households - Lesbian couples (% change since 2000)
Likely homosexual households - Gay men (%)
Likely homosexual households - Gay men (% change since 2000)
Cost of living index
Median gross rent ($)
Median contract rent ($)
Median monthly housing costs ($)
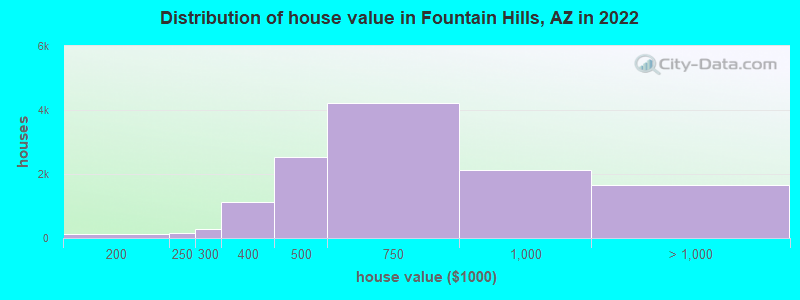
Median house or condo value ($)
Median house or condo value ($ change since 2000)
Mean house or condo value by units in structure - 1, detached ($)
Mean house or condo value by units in structure - 1, attached ($)
Mean house or condo value by units in structure - 2 ($)
Mean house or condo value by units in structure by units in structure - 3 or 4 ($)
Mean house or condo value by units in structure - 5 or more ($)
Mean house or condo value by units in structure - Boat, RV, van, etc. ($)
Mean house or condo value by units in structure - Mobile home ($)
Median house or condo value ($) - White
Median house or condo value ($) - Black or African American
Median house or condo value ($) - Asian
Median house or condo value ($) - Hispanic or Latino
Median house or condo value ($) - American Indian and Alaska Native
Median house or condo value ($) - Multirace
Median house or condo value ($) - Other Race
Median resident age
Resident age diversity
Median resident age - Males
Median resident age - Females
Median resident age - White
Median resident age - Black or African American
Median resident age - Asian
Median resident age - Hispanic or Latino
Median resident age - American Indian and Alaska Native
Median resident age - Multirace
Median resident age - Other Race
Median resident age - Males - White
Median resident age - Males - Black or African American
Median resident age - Males - Asian
Median resident age - Males - Hispanic or Latino
Median resident age - Males - American Indian and Alaska Native
Median resident age - Males - Multirace
Median resident age - Males - Other Race
Median resident age - Females - White
Median resident age - Females - Black or African American
Median resident age - Females - Asian
Median resident age - Females - Hispanic or Latino
Median resident age - Females - American Indian and Alaska Native
Median resident age - Females - Multirace
Median resident age - Females - Other Race
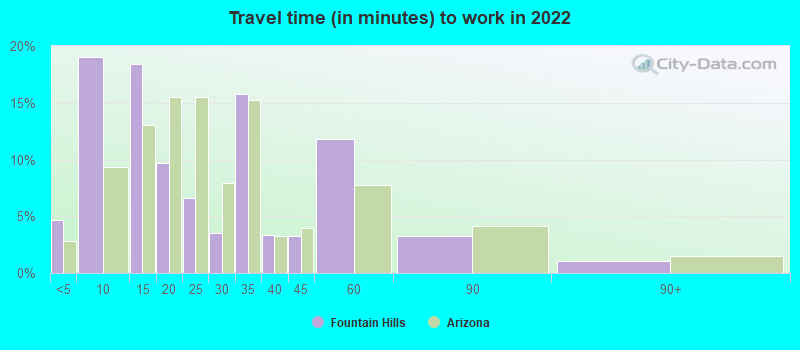
Commute - mean travel time to work (minutes)
Travel time to work - Less than 5 minutes (%)
Travel time to work - Less than 5 minutes (% change since 2000)
Travel time to work - 5 to 9 minutes (%)
Travel time to work - 5 to 9 minutes (% change since 2000)
Travel time to work - 10 to 19 minutes (%)
Travel time to work - 10 to 19 minutes (% change since 2000)
Travel time to work - 20 to 29 minutes (%)
Travel time to work - 20 to 29 minutes (% change since 2000)
Travel time to work - 30 to 39 minutes (%)
Travel time to work - 30 to 39 minutes (% change since 2000)
Travel time to work - 40 to 59 minutes (%)
Travel time to work - 40 to 59 minutes (% change since 2000)
Travel time to work - 60 to 89 minutes (%)
Travel time to work - 60 to 89 minutes (% change since 2000)
Travel time to work - 90 or more minutes (%)
Travel time to work - 90 or more minutes (% change since 2000)
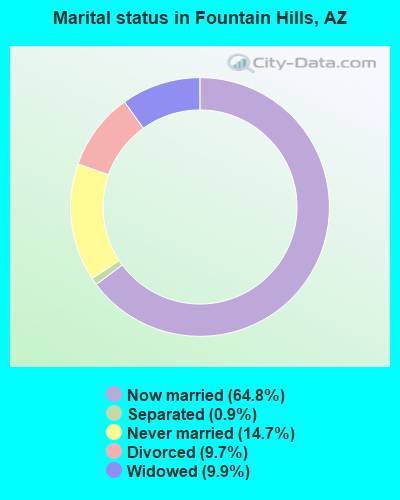
Marital status - Never married (%)
Marital status - Now married (%)
Marital status - Separated (%)
Marital status - Widowed (%)
Marital status - Divorced (%)
Median family income ($)
Median family income (% change since 2000)
Median non-family income ($)
Median non-family income (% change since 2000)
Median per capita income ($)
Median per capita income (% change since 2000)
Median family income ($) - White
Median family income ($) - Black or African American
Median family income ($) - Asian
Median family income ($) - Hispanic or Latino
Median family income ($) - American Indian and Alaska Native
Median family income ($) - Multirace
Median family income ($) - Other Race
Median year house/condo built
Median year apartment built
Year house built - Built 2005 or later (%)
Year house built - Built 2000 to 2004 (%)
Year house built - Built 1990 to 1999 (%)
Year house built - Built 1980 to 1989 (%)
Year house built - Built 1970 to 1979 (%)
Year house built - Built 1960 to 1969 (%)
Year house built - Built 1950 to 1959 (%)
Year house built - Built 1940 to 1949 (%)
Year house built - Built 1939 or earlier (%)
Average household size
Household density (households per square mile)
Average household size - White
Average household size - Black or African American
Average household size - Asian
Average household size - Hispanic or Latino
Average household size - American Indian and Alaska Native
Average household size - Multirace
Average household size - Other Race
Occupied housing units (%)
Vacant housing units (%)
Owner occupied housing units (%)
Renter occupied housing units (%)
Vacancy status - For rent (%)
Vacancy status - For sale only (%)
Vacancy status - Rented or sold, not occupied (%)
Vacancy status - For seasonal, recreational, or occasional use (%)
Vacancy status - For migrant workers (%)
Vacancy status - Other vacant (%)
Residents with income below the poverty level (%)
Residents with income below 50% of the poverty level (%)
Children below poverty level (%)
Poor families by family type - Married-couple family (%)
Poor families by family type - Male, no wife present (%)
Poor families by family type - Female, no husband present (%)
Poverty status for native-born residents (%)
Poverty status for foreign-born residents (%)
Poverty among high school graduates not in families (%)
Poverty among people who did not graduate high school not in families (%)
Residents with income below the poverty level (%) - White
Residents with income below the poverty level (%) - Black or African American
Residents with income below the poverty level (%) - Asian
Residents with income below the poverty level (%) - Hispanic or Latino
Residents with income below the poverty level (%) - American Indian and Alaska Native
Residents with income below the poverty level (%) - Multirace
Residents with income below the poverty level (%) - Other Race
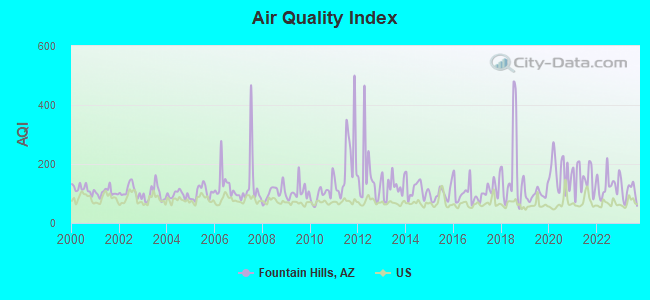
Air pollution - Air Quality Index (AQI)
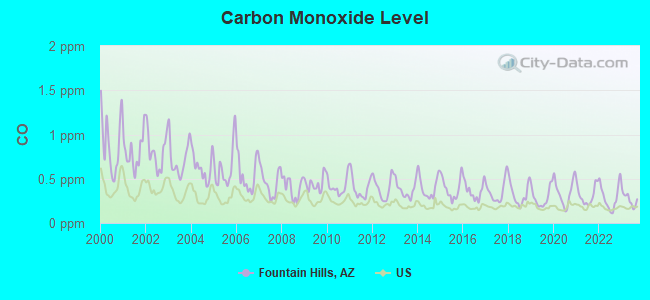
Air pollution - CO
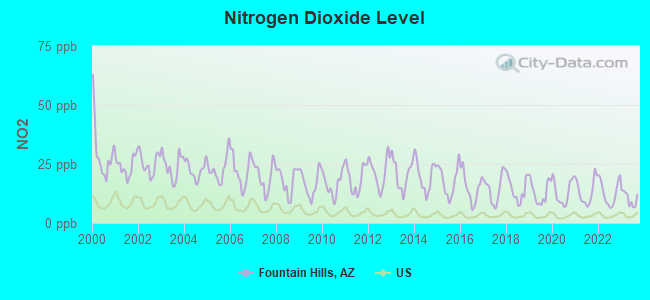
Air pollution - NO2
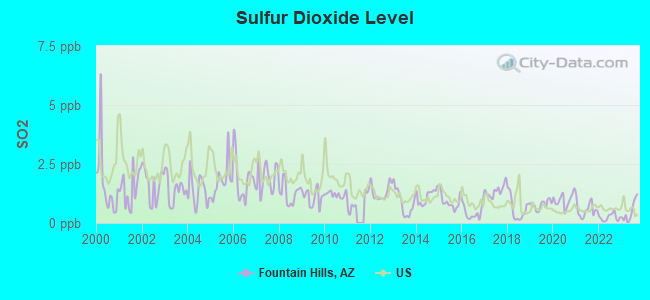
Air pollution - SO2
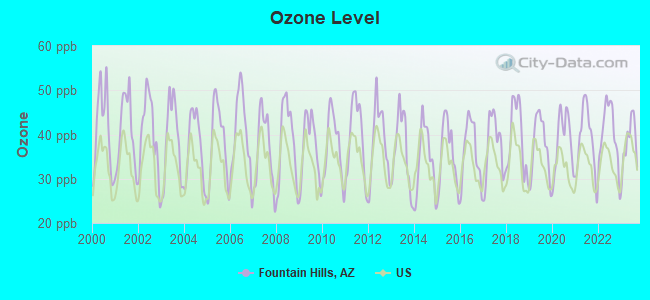
Air pollution - Ozone
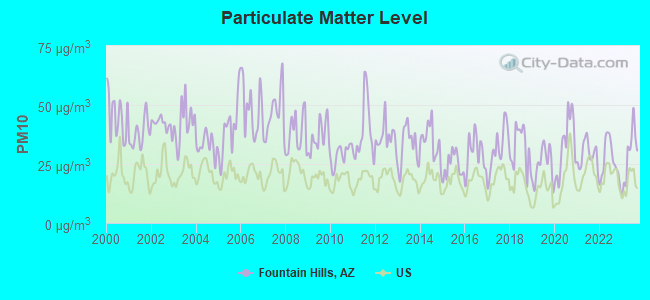
Air pollution - PM10
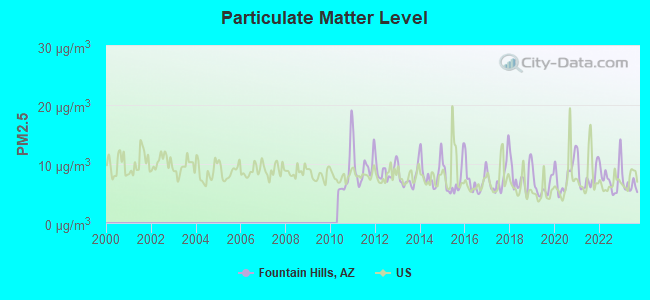
Air pollution - PM25
Air pollution - Pb
Crime - Murders per 100,000 population
Crime - Rapes per 100,000 population
Crime - Robberies per 100,000 population
Crime - Assaults per 100,000 population
Crime - Burglaries per 100,000 population
Crime - Thefts per 100,000 population
Crime - Auto thefts per 100,000 population
Crime - Arson per 100,000 population
Crime - City-data.com crime index
Crime - Violent crime index
Crime - Property crime index
Crime - Murders per 100,000 population (5 year average)
Crime - Rapes per 100,000 population (5 year average)
Crime - Robberies per 100,000 population (5 year average)
Crime - Assaults per 100,000 population (5 year average)
Crime - Burglaries per 100,000 population (5 year average)
Crime - Thefts per 100,000 population (5 year average)
Crime - Auto thefts per 100,000 population (5 year average)
Crime - Arson per 100,000 population (5 year average)
Crime - City-data.com crime index (5 year average)
Crime - Violent crime index (5 year average)
Crime - Property crime index (5 year average)
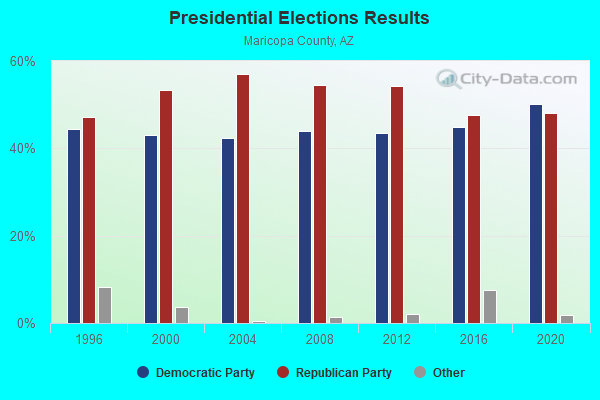
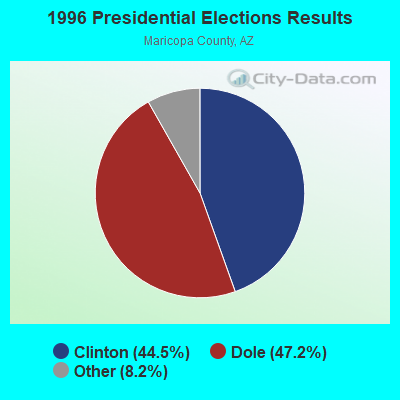
1996 Presidential Elections Results (%) - Democratic Party (Clinton)
1996 Presidential Elections Results (%) - Republican Party (Dole)
1996 Presidential Elections Results (%) - Other
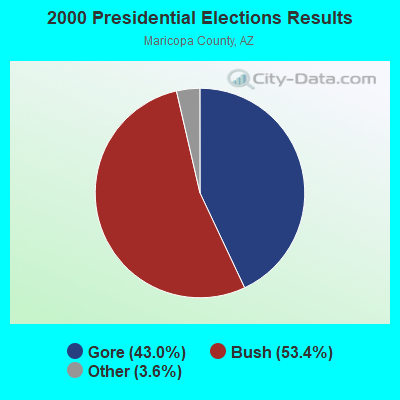
2000 Presidential Elections Results (%) - Democratic Party (Gore)
2000 Presidential Elections Results (%) - Republican Party (Bush)
2000 Presidential Elections Results (%) - Other
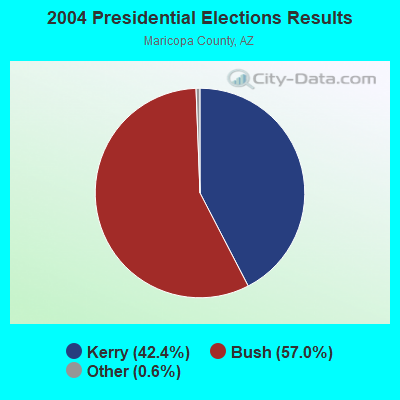
2004 Presidential Elections Results (%) - Democratic Party (Kerry)
2004 Presidential Elections Results (%) - Republican Party (Bush)
2004 Presidential Elections Results (%) - Other
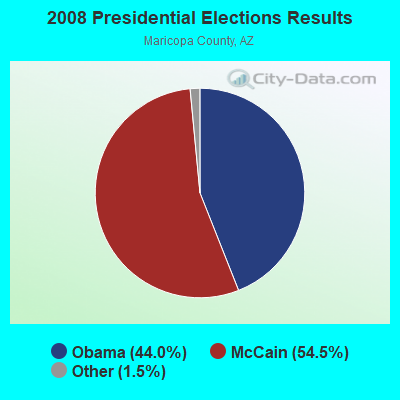
2008 Presidential Elections Results (%) - Democratic Party (Obama)
2008 Presidential Elections Results (%) - Republican Party (McCain)
2008 Presidential Elections Results (%) - Other
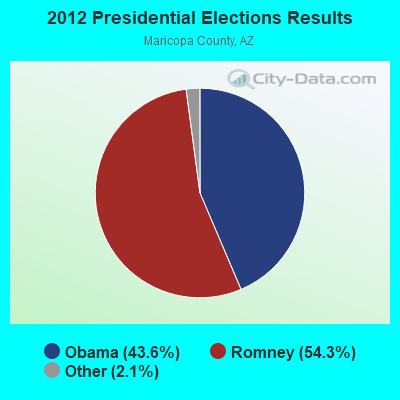
2012 Presidential Elections Results (%) - Democratic Party (Obama)
2012 Presidential Elections Results (%) - Republican Party (Romney)
2012 Presidential Elections Results (%) - Other
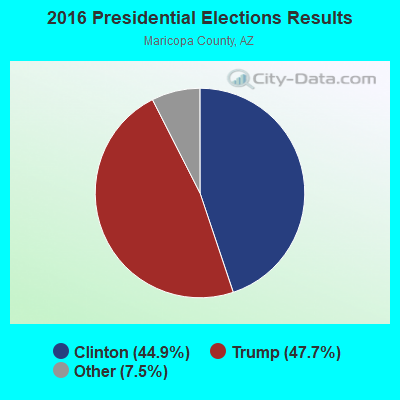
2016 Presidential Elections Results (%) - Democratic Party (Clinton)
2016 Presidential Elections Results (%) - Republican Party (Trump)
2016 Presidential Elections Results (%) - Other
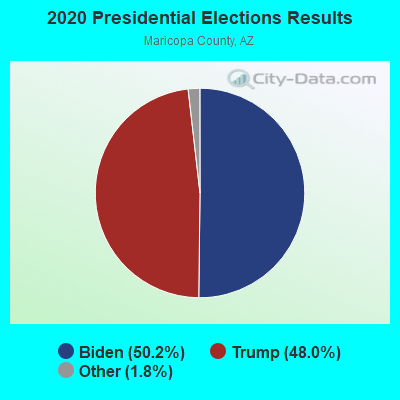
2020 Presidential Elections Results (%) - Democratic Party (Biden)
2020 Presidential Elections Results (%) - Republican Party (Trump)
2020 Presidential Elections Results (%) - Other
Ancestries Reported - Arab (%)
Ancestries Reported - Czech (%)
Ancestries Reported - Danish (%)
Ancestries Reported - Dutch (%)
Ancestries Reported - English (%)
Ancestries Reported - French (%)
Ancestries Reported - French Canadian (%)
Ancestries Reported - German (%)
Ancestries Reported - Greek (%)
Ancestries Reported - Hungarian (%)
Ancestries Reported - Irish (%)
Ancestries Reported - Italian (%)
Ancestries Reported - Lithuanian (%)
Ancestries Reported - Norwegian (%)
Ancestries Reported - Polish (%)
Ancestries Reported - Portuguese (%)
Ancestries Reported - Russian (%)
Ancestries Reported - Scotch-Irish (%)
Ancestries Reported - Scottish (%)
Ancestries Reported - Slovak (%)
Ancestries Reported - Subsaharan African (%)
Ancestries Reported - Swedish (%)
Ancestries Reported - Swiss (%)
Ancestries Reported - Ukrainian (%)
Ancestries Reported - United States (%)
Ancestries Reported - Welsh (%)
Ancestries Reported - West Indian (%)
Ancestries Reported - Other (%)
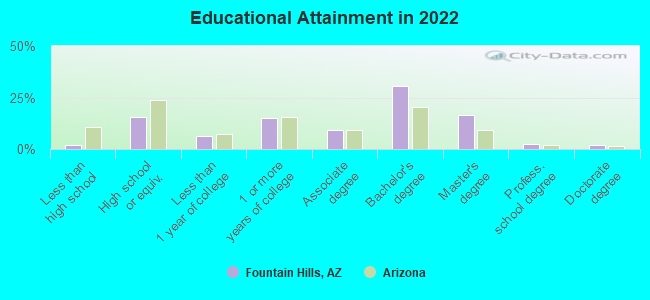
Educational Attainment - No schooling completed (%)
Educational Attainment - Less than high school (%)
Educational Attainment - High school or equivalent (%)
Educational Attainment - Less than 1 year of college (%)
Educational Attainment - 1 or more years of college (%)
Educational Attainment - Associate degree (%)
Educational Attainment - Bachelor's degree (%)
Educational Attainment - Master's degree (%)
Educational Attainment - Professional school degree (%)
Educational Attainment - Doctorate degree (%)
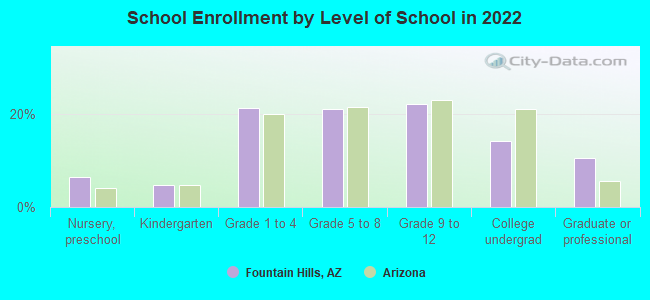
School Enrollment - Nursery, preschool (%)
School Enrollment - Kindergarten (%)
School Enrollment - Grade 1 to 4 (%)
School Enrollment - Grade 5 to 8 (%)
School Enrollment - Grade 9 to 12 (%)
School Enrollment - College undergrad (%)
School Enrollment - Graduate or professional (%)
School Enrollment - Not enrolled in school (%)
School enrollment - Public schools (%)
School enrollment - Private schools (%)
School enrollment - Not enrolled (%)
Median number of rooms in houses and condos
Median number of rooms in apartments
Housing units lacking complete plumbing facilities (%)
Housing units lacking complete kitchen facilities (%)
Density of houses
Urban houses (%)
Rural houses (%)
Households with people 60 years and over (%)
Households with people 65 years and over (%)
Households with people 75 years and over (%)
Households with one or more nonrelatives (%)
Households with no nonrelatives (%)
Population in households (%)
Family households (%)
Nonfamily households (%)
Population in families (%)
Family households with own children (%)
Median number of bedrooms in owner occupied houses
Mean number of bedrooms in owner occupied houses
Median number of bedrooms in renter occupied houses
Mean number of bedrooms in renter occupied houses
Median number of vehichles in owner occupied houses
Mean number of vehichles in owner occupied houses
Median number of vehichles in renter occupied houses
Mean number of vehichles in renter occupied houses
Mortgage status - with mortgage (%)
Mortgage status - with second mortgage (%)
Mortgage status - with home equity loan (%)
Mortgage status - with both second mortgage and home equity loan (%)
Mortgage status - without a mortgage (%)
Average family size
Average family size - White
Average family size - Black or African American
Average family size - Asian
Average family size - Hispanic or Latino
Average family size - American Indian and Alaska Native
Average family size - Multirace
Average family size - Other Race
Geographical mobility - Same house 1 year ago (%)
Geographical mobility - Moved within same county (%)
Geographical mobility - Moved from different county within same state (%)
Geographical mobility - Moved from different state (%)
Geographical mobility - Moved from abroad (%)
Place of birth - Born in state of residence (%)
Place of birth - Born in other state (%)
Place of birth - Native, outside of US (%)
Place of birth - Foreign born (%)
Housing units in structures - 1, detached (%)
Housing units in structures - 1, attached (%)
Housing units in structures - 2 (%)
Housing units in structures - 3 or 4 (%)
Housing units in structures - 5 to 9 (%)
Housing units in structures - 10 to 19 (%)
Housing units in structures - 20 to 49 (%)
Housing units in structures - 50 or more (%)
Housing units in structures - Mobile home (%)
Housing units in structures - Boat, RV, van, etc. (%)
House/condo owner moved in on average (years ago)
Renter moved in on average (years ago)
Year householder moved into unit - Moved in 1999 to March 2000 (%)
Year householder moved into unit - Moved in 1995 to 1998 (%)
Year householder moved into unit - Moved in 1990 to 1994 (%)
Year householder moved into unit - Moved in 1980 to 1989 (%)
Year householder moved into unit - Moved in 1970 to 1979 (%)
Year householder moved into unit - Moved in 1969 or earlier (%)
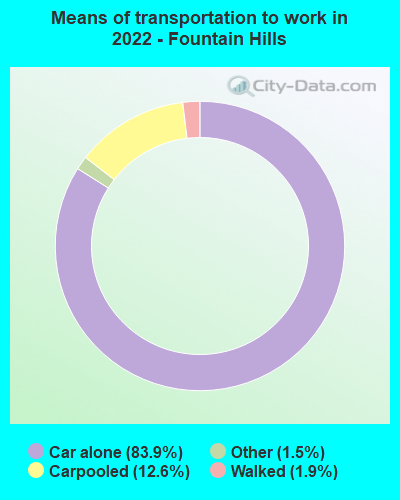
Means of transportation to work - Drove car alone (%)
Means of transportation to work - Carpooled (%)
Means of transportation to work - Public transportation (%)
Means of transportation to work - Bus or trolley bus (%)
Means of transportation to work - Streetcar or trolley car (%)
Means of transportation to work - Subway or elevated (%)
Means of transportation to work - Railroad (%)
Means of transportation to work - Ferryboat (%)
Means of transportation to work - Taxicab (%)
Means of transportation to work - Motorcycle (%)
Means of transportation to work - Bicycle (%)
Means of transportation to work - Walked (%)
Means of transportation to work - Other means (%)
Working at home (%)
Industry diversity
Most Common Industries - Agriculture, forestry, fishing and hunting, and mining (%)
Most Common Industries - Agriculture, forestry, fishing and hunting (%)
Most Common Industries - Mining, quarrying, and oil and gas extraction (%)
Most Common Industries - Construction (%)
Most Common Industries - Manufacturing (%)
Most Common Industries - Wholesale trade (%)
Most Common Industries - Retail trade (%)
Most Common Industries - Transportation and warehousing, and utilities (%)
Most Common Industries - Transportation and warehousing (%)
Most Common Industries - Utilities (%)
Most Common Industries - Information (%)
Most Common Industries - Finance and insurance, and real estate and rental and leasing (%)
Most Common Industries - Finance and insurance (%)
Most Common Industries - Real estate and rental and leasing (%)
Most Common Industries - Professional, scientific, and management, and administrative and waste management services (%)
Most Common Industries - Professional, scientific, and technical services (%)
Most Common Industries - Management of companies and enterprises (%)
Most Common Industries - Administrative and support and waste management services (%)
Most Common Industries - Educational services, and health care and social assistance (%)
Most Common Industries - Educational services (%)
Most Common Industries - Health care and social assistance (%)
Most Common Industries - Arts, entertainment, and recreation, and accommodation and food services (%)
Most Common Industries - Arts, entertainment, and recreation (%)
Most Common Industries - Accommodation and food services (%)
Most Common Industries - Other services, except public administration (%)
Most Common Industries - Public administration (%)
Occupation diversity
Most Common Occupations - Management, business, science, and arts occupations (%)
Most Common Occupations - Management, business, and financial occupations (%)
Most Common Occupations - Management occupations (%)
Most Common Occupations - Business and financial operations occupations (%)
Most Common Occupations - Computer, engineering, and science occupations (%)
Most Common Occupations - Computer and mathematical occupations (%)
Most Common Occupations - Architecture and engineering occupations (%)
Most Common Occupations - Life, physical, and social science occupations (%)
Most Common Occupations - Education, legal, community service, arts, and media occupations (%)
Most Common Occupations - Community and social service occupations (%)
Most Common Occupations - Legal occupations (%)
Most Common Occupations - Education, training, and library occupations (%)
Most Common Occupations - Arts, design, entertainment, sports, and media occupations (%)
Most Common Occupations - Healthcare practitioners and technical occupations (%)
Most Common Occupations - Health diagnosing and treating practitioners and other technical occupations (%)
Most Common Occupations - Health technologists and technicians (%)
Most Common Occupations - Service occupations (%)
Most Common Occupations - Healthcare support occupations (%)
Most Common Occupations - Protective service occupations (%)
Most Common Occupations - Fire fighting and prevention, and other protective service workers including supervisors (%)
Most Common Occupations - Law enforcement workers including supervisors (%)
Most Common Occupations - Food preparation and serving related occupations (%)
Most Common Occupations - Building and grounds cleaning and maintenance occupations (%)
Most Common Occupations - Personal care and service occupations (%)
Most Common Occupations - Sales and office occupations (%)
Most Common Occupations - Sales and related occupations (%)
Most Common Occupations - Office and administrative support occupations (%)
Most Common Occupations - Natural resources, construction, and maintenance occupations (%)
Most Common Occupations - Farming, fishing, and forestry occupations (%)
Most Common Occupations - Construction and extraction occupations (%)
Most Common Occupations - Installation, maintenance, and repair occupations (%)
Most Common Occupations - Production, transportation, and material moving occupations (%)
Most Common Occupations - Production occupations (%)
Most Common Occupations - Transportation occupations (%)
Most Common Occupations - Material moving occupations (%)
People in Group quarters - Institutionalized population (%)
People in Group quarters - Correctional institutions (%)
People in Group quarters - Federal prisons and detention centers (%)
People in Group quarters - Halfway houses (%)
People in Group quarters - Local jails and other confinement facilities (including police lockups) (%)
People in Group quarters - Military disciplinary barracks (%)
People in Group quarters - State prisons (%)
People in Group quarters - Other types of correctional institutions (%)
People in Group quarters - Nursing homes (%)
People in Group quarters - Hospitals/wards, hospices, and schools for the handicapped (%)
People in Group quarters - Hospitals/wards and hospices for chronically ill (%)
People in Group quarters - Hospices or homes for chronically ill (%)
People in Group quarters - Military hospitals or wards for chronically ill (%)
People in Group quarters - Other hospitals or wards for chronically ill (%)
People in Group quarters - Hospitals or wards for drug/alcohol abuse (%)
People in Group quarters - Mental (Psychiatric) hospitals or wards (%)
People in Group quarters - Schools, hospitals, or wards for the mentally retarded (%)
People in Group quarters - Schools, hospitals, or wards for the physically handicapped (%)
People in Group quarters - Institutions for the deaf (%)
People in Group quarters - Institutions for the blind (%)
People in Group quarters - Orthopedic wards and institutions for the physically handicapped (%)
People in Group quarters - Wards in general hospitals for patients who have no usual home elsewhere (%)
People in Group quarters - Wards in military hospitals for patients who have no usual home elsewhere (%)
People in Group quarters - Juvenile institutions (%)
People in Group quarters - Long-term care (%)
People in Group quarters - Homes for abused, dependent, and neglected children (%)
People in Group quarters - Residential treatment centers for emotionally disturbed children (%)
People in Group quarters - Training schools for juvenile delinquents (%)
People in Group quarters - Short-term care, detention or diagnostic centers for delinquent children (%)
People in Group quarters - Type of juvenile institution unknown (%)
People in Group quarters - Noninstitutionalized population (%)
People in Group quarters - College dormitories (includes college quarters off campus) (%)
People in Group quarters - Military quarters (%)
People in Group quarters - On base (%)
People in Group quarters - Barracks, unaccompanied personnel housing (UPH), (Enlisted/Officer), ;and similar group living quarters for military personnel (%)
People in Group quarters - Transient quarters for temporary residents (%)
People in Group quarters - Military ships (%)
People in Group quarters - Group homes (%)
People in Group quarters - Homes or halfway houses for drug/alcohol abuse (%)
People in Group quarters - Homes for the mentally ill (%)
People in Group quarters - Homes for the mentally retarded (%)
People in Group quarters - Homes for the physically handicapped (%)
People in Group quarters - Other group homes (%)
People in Group quarters - Religious group quarters (%)
People in Group quarters - Dormitories (%)
People in Group quarters - Agriculture workers' dormitories on farms (%)
People in Group quarters - Job Corps and vocational training facilities (%)
People in Group quarters - Other workers' dormitories (%)
People in Group quarters - Crews of maritime vessels (%)
People in Group quarters - Other nonhousehold living situations (%)
People in Group quarters - Other noninstitutional group quarters (%)
Residents speaking English at home (%)
Residents speaking English at home - Born in the United States (%)
Residents speaking English at home - Native, born elsewhere (%)
Residents speaking English at home - Foreign born (%)
Residents speaking Spanish at home (%)
Residents speaking Spanish at home - Born in the United States (%)
Residents speaking Spanish at home - Native, born elsewhere (%)
Residents speaking Spanish at home - Foreign born (%)
Residents speaking other language at home (%)
Residents speaking other language at home - Born in the United States (%)
Residents speaking other language at home - Native, born elsewhere (%)
Residents speaking other language at home - Foreign born (%)
Class of Workers - Employee of private company (%)
Class of Workers - Self-employed in own incorporated business (%)
Class of Workers - Private not-for-profit wage and salary workers (%)
Class of Workers - Local government workers (%)
Class of Workers - State government workers (%)
Class of Workers - Federal government workers (%)
Class of Workers - Self-employed workers in own not incorporated business and Unpaid family workers (%)
House heating fuel used in houses and condos - Utility gas (%)
House heating fuel used in houses and condos - Bottled, tank, or LP gas (%)
House heating fuel used in houses and condos - Electricity (%)
House heating fuel used in houses and condos - Fuel oil, kerosene, etc. (%)
House heating fuel used in houses and condos - Coal or coke (%)
House heating fuel used in houses and condos - Wood (%)
House heating fuel used in houses and condos - Solar energy (%)
House heating fuel used in houses and condos - Other fuel (%)
House heating fuel used in houses and condos - No fuel used (%)
House heating fuel used in apartments - Utility gas (%)
House heating fuel used in apartments - Bottled, tank, or LP gas (%)
House heating fuel used in apartments - Electricity (%)
House heating fuel used in apartments - Fuel oil, kerosene, etc. (%)
House heating fuel used in apartments - Coal or coke (%)
House heating fuel used in apartments - Wood (%)
House heating fuel used in apartments - Solar energy (%)
House heating fuel used in apartments - Other fuel (%)
House heating fuel used in apartments - No fuel used (%)
Armed forces status - In Armed Forces (%)
Armed forces status - Civilian (%)
Armed forces status - Civilian - Veteran (%)
Armed forces status - Civilian - Nonveteran (%)
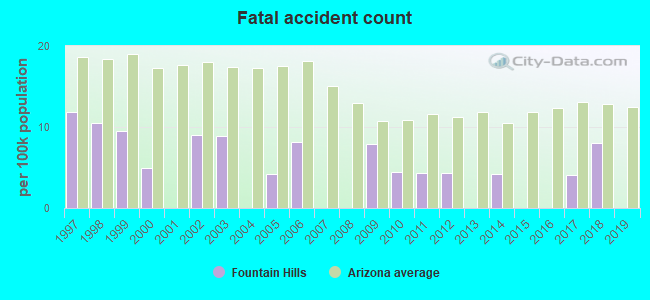
Fatal accidents locations in years 2005-2021
Fatal accidents locations in 2005
Fatal accidents locations in 2006
Fatal accidents locations in 2007
Fatal accidents locations in 2008
Fatal accidents locations in 2009
Fatal accidents locations in 2010
Fatal accidents locations in 2011
Fatal accidents locations in 2012
Fatal accidents locations in 2013
Fatal accidents locations in 2014
Fatal accidents locations in 2015
Fatal accidents locations in 2016
Fatal accidents locations in 2017
Fatal accidents locations in 2018
Fatal accidents locations in 2019
Fatal accidents locations in 2020
Fatal accidents locations in 2021
Alcohol use - People drinking some alcohol every month (%)
Alcohol use - People not drinking at all (%)
Alcohol use - Average days/month drinking alcohol
Alcohol use - Average drinks/week
Alcohol use - Average days/year people drink much
Audiometry - Average condition of hearing (%)
Audiometry - People that can hear a whisper from across a quiet room (%)
Audiometry - People that can hear normal voice from across a quiet room (%)
Audiometry - Ears ringing, roaring, buzzing (%)
Audiometry - Had a job exposure to loud noise (%)
Audiometry - Had off-work exposure to loud noise (%)
Blood Pressure & Cholesterol - Has high blood pressure (%)
Blood Pressure & Cholesterol - Checking blood pressure at home (%)
Blood Pressure & Cholesterol - Frequently checking blood cholesterol (%)
Blood Pressure & Cholesterol - Has high cholesterol level (%)
Consumer Behavior - Money monthly spent on food at supermarket/grocery store
Consumer Behavior - Money monthly spent on food at other stores
Consumer Behavior - Money monthly spent on eating out
Consumer Behavior - Money monthly spent on carryout/delivered foods
Consumer Behavior - Income spent on food at supermarket/grocery store (%)
Consumer Behavior - Income spent on food at other stores (%)
Consumer Behavior - Income spent on eating out (%)
Consumer Behavior - Income spent on carryout/delivered foods (%)
Current Health Status - General health condition (%)
Current Health Status - Blood donors (%)
Current Health Status - Has blood ever tested for HIV virus (%)
Current Health Status - Left-handed people (%)
Dermatology - People using sunscreen (%)
Diabetes - Diabetics (%)
Diabetes - Had a blood test for high blood sugar (%)
Diabetes - People taking insulin (%)
Diet Behavior & Nutrition - Diet health (%)
Diet Behavior & Nutrition - Milk product consumption (# of products/month)
Diet Behavior & Nutrition - Meals not home prepared (#/week)
Diet Behavior & Nutrition - Meals from fast food or pizza place (#/week)
Diet Behavior & Nutrition - Ready-to-eat foods (#/month)
Diet Behavior & Nutrition - Frozen meals/pizza (#/month)
Drug Use - People that ever used marijuana or hashish (%)
Drug Use - Ever used hard drugs (%)
Drug Use - Ever used any form of cocaine (%)
Drug Use - Ever used heroin (%)
Drug Use - Ever used methamphetamine (%)
Health Insurance - People covered by health insurance (%)
Kidney Conditions-Urology - Avg. # of times urinating at night
Medical Conditions - People with asthma (%)
Medical Conditions - People with anemia (%)
Medical Conditions - People with psoriasis (%)
Medical Conditions - People with overweight (%)
Medical Conditions - Elderly people having difficulties in thinking or remembering (%)
Medical Conditions - People who ever received blood transfusion (%)
Medical Conditions - People having trouble seeing even with glass/contacts (%)
Medical Conditions - People with arthritis (%)
Medical Conditions - People with gout (%)
Medical Conditions - People with congestive heart failure (%)
Medical Conditions - People with coronary heart disease (%)
Medical Conditions - People with angina pectoris (%)
Medical Conditions - People who ever had heart attack (%)
Medical Conditions - People who ever had stroke (%)
Medical Conditions - People with emphysema (%)
Medical Conditions - People with thyroid problem (%)
Medical Conditions - People with chronic bronchitis (%)
Medical Conditions - People with any liver condition (%)
Medical Conditions - People who ever had cancer or malignancy (%)
Mental Health - People who have little interest in doing things (%)
Mental Health - People feeling down, depressed, or hopeless (%)
Mental Health - People who have trouble sleeping or sleeping too much (%)
Mental Health - People feeling tired or having little energy (%)
Mental Health - People with poor appetite or overeating (%)
Mental Health - People feeling bad about themself (%)
Mental Health - People who have trouble concentrating on things (%)
Mental Health - People moving or speaking slowly or too fast (%)
Mental Health - People having thoughts they would be better off dead (%)
Oral Health - Average years since last visit a dentist
Oral Health - People embarrassed because of mouth (%)
Oral Health - People with gum disease (%)
Oral Health - General health of teeth and gums (%)
Oral Health - Average days a week using dental floss/device
Oral Health - Average days a week using mouthwash for dental problem
Oral Health - Average number of teeth
Pesticide Use - Households using pesticides to control insects (%)
Pesticide Use - Households using pesticides to kill weeds (%)
Physical Activity - People doing vigorous-intensity work activities (%)
Physical Activity - People doing moderate-intensity work activities (%)
Physical Activity - People walking or bicycling (%)
Physical Activity - People doing vigorous-intensity recreational activities (%)
Physical Activity - People doing moderate-intensity recreational activities (%)
Physical Activity - Average hours a day doing sedentary activities
Physical Activity - Average hours a day watching TV or videos
Physical Activity - Average hours a day using computer
Physical Functioning - People having limitations keeping them from working (%)
Physical Functioning - People limited in amount of work they can do (%)
Physical Functioning - People that need special equipment to walk (%)
Physical Functioning - People experiencing confusion/memory problems (%)
Physical Functioning - People requiring special healthcare equipment (%)
Prescription Medications - Average number of prescription medicines taking
Preventive Aspirin Use - Adults 40+ taking low-dose aspirin (%)
Reproductive Health - Vaginal deliveries (%)
Reproductive Health - Cesarean deliveries (%)
Reproductive Health - Deliveries resulted in a live birth (%)
Reproductive Health - Pregnancies resulted in a delivery (%)
Reproductive Health - Women breastfeeding newborns (%)
Reproductive Health - Women that had a hysterectomy (%)
Reproductive Health - Women that had both ovaries removed (%)
Reproductive Health - Women that have ever taken birth control pills (%)
Reproductive Health - Women taking birth control pills (%)
Reproductive Health - Women that have ever used Depo-Provera or injectables (%)
Reproductive Health - Women that have ever used female hormones (%)
Sexual Behavior - People 18+ that ever had sex (vaginal, anal, or oral) (%)
Sexual Behavior - Males 18+ that ever had vaginal sex with a woman (%)
Sexual Behavior - Males 18+ that ever performed oral sex on a woman (%)
Sexual Behavior - Males 18+ that ever had anal sex with a woman (%)
Sexual Behavior - Males 18+ that ever had any sex with a man (%)
Sexual Behavior - Females 18+ that ever had vaginal sex with a man (%)
Sexual Behavior - Females 18+ that ever performed oral sex on a man (%)
Sexual Behavior - Females 18+ that ever had anal sex with a man (%)
Sexual Behavior - Females 18+ that ever had any kind of sex with a woman (%)
Sexual Behavior - Average age people first had sex
Sexual Behavior - Average number of female sex partners in lifetime (males 18+)
Sexual Behavior - Average number of female vaginal sex partners in lifetime (males 18+)
Sexual Behavior - Average age people first performed oral sex on a woman (18+)
Sexual Behavior - Average number of woman performed oral sex on in lifetime (18+)
Sexual Behavior - Average number of male sex partners in lifetime (males 18+)
Sexual Behavior - Average number of male anal sex partners in lifetime (males 18+)
Sexual Behavior - Average age people first performed oral sex on a man (18+)
Sexual Behavior - Average number of male oral sex partners in lifetime (18+)
Sexual Behavior - People using protection when performing oral sex (%)
Sexual Behavior - Average number of times people have vaginal or anal sex a year
Sexual Behavior - People having sex without condom (%)
Sexual Behavior - Average number of male sex partners in lifetime (females 18+)
Sexual Behavior - Average number of male vaginal sex partners in lifetime (females 18+)
Sexual Behavior - Average number of female sex partners in lifetime (females 18+)
Sexual Behavior - Circumcised males 18+ (%)
Sleep Disorders - Average hours sleeping at night
Sleep Disorders - People that has trouble sleeping (%)
Smoking-Cigarette Use - People smoking cigarettes (%)
Taste & Smell - People 40+ having problems with smell (%)
Taste & Smell - People 40+ having problems with taste (%)
Taste & Smell - People 40+ that ever had wisdom teeth removed (%)
Taste & Smell - People 40+ that ever had tonsils teeth removed (%)
Taste & Smell - People 40+ that ever had a loss of consciousness because of a head injury (%)
Taste & Smell - People 40+ that ever had a broken nose or other serious injury to face or skull (%)
Taste & Smell - People 40+ that ever had two or more sinus infections (%)
Weight - Average height (inches)
Weight - Average weight (pounds)
Weight - Average BMI
Weight - People that are obese (%)
Weight - People that ever were obese (%)
Weight - People trying to lose weight (%)
21,180 86.9% White alone 798 3.3% Two or more races 776 3.2% Hispanic 587 2.4% Asian alone 552 2.3% Black alone 54 0.2% Other race alone 30 0.1% American Indian alone 10 0.04% Native Hawaiian and Other
According to our research of Arizona and other state lists, there were 7 registered sex offenders living in Fountain Hills, Arizona as of April 27, 2024 . The ratio of all residents to sex offenders in Fountain Hills is 3,538 to 1.The ratio of registered sex offenders to all residents in this city is much lower than the state average.
Latest news from Fountain Hills, AZ collected exclusively by city-data.com from local newspapers, TV, and radio stations
Fountain Hills, AZ City Guides: Ancestries: German (14.2%), Irish (12.8%), English (10.9%), American (7.0%), Italian (7.0%), Polish (3.5%).
Current Local Time:
Land area: 18.2 square miles.
Population density: 1,309 people per square mile (low).
1,958 residents are foreign born (3.5% Europe , 2.1% North America , 1.4% Asia ).
This town:
8.0%Arizona:
13.0%
Median real estate property taxes paid for housing units with mortgages in 2022: $2,423 (0.4%)Median real estate property taxes paid for housing units with no mortgage in 2022: $2,473 (0.4%)
Nearest city with pop. 50,000+: Scottsdale, AZ
Nearest city with pop. 1,000,000+: Phoenix, AZ
Nearest cities:
Latitude: 33.60 N, Longitude: 111.73 W
Daytime population change due to commuting: -3,028 (-12.4%)Workers who live and work in this town: 5,187 (47.4%)
Property values in Fountain Hills, AZ
Fountain Hills tourist attractions:
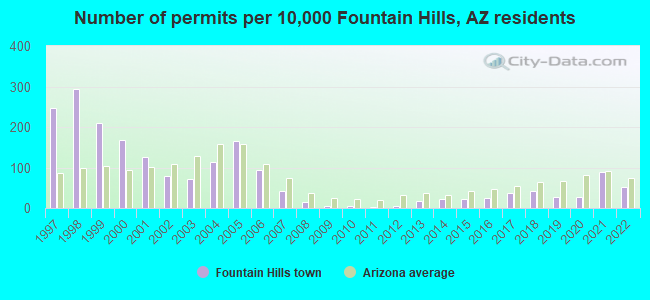
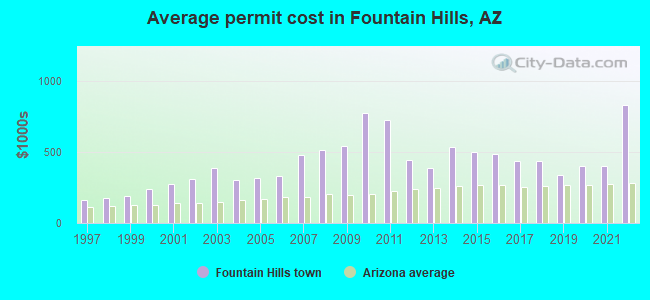
Single-family new house construction building permits:
2022: 107 buildings , average cost: $833,4002021: 181 buildings , average cost: $404,8002020: 56 buildings , average cost: $404,6002019: 55 buildings , average cost: $337,7002018: 86 buildings , average cost: $440,7002017: 76 buildings , average cost: $441,2002016: 49 buildings , average cost: $483,9002015: 46 buildings , average cost: $498,6002014: 44 buildings , average cost: $538,3002013: 34 buildings , average cost: $385,6002012: 9 buildings , average cost: $448,0002011: 6 buildings , average cost: $730,3002010: 11 buildings , average cost: $776,4002009: 12 buildings , average cost: $544,0002008: 32 buildings , average cost: $512,2002007: 82 buildings , average cost: $482,5002006: 192 buildings , average cost: $335,4002005: 336 buildings , average cost: $315,1002004: 228 buildings , average cost: $304,7002003: 145 buildings , average cost: $385,9002002: 159 buildings , average cost: $311,4002001: 257 buildings , average cost: $276,0002000: 342 buildings , average cost: $236,7001999: 423 buildings , average cost: $191,3001998: 594 buildings , average cost: $174,3001997: 501 buildings , average cost: $164,200Unemployment in December 2023: Population change in the 1990s: +10,162 (+100.9%).
Most common industries in Fountain Hills, AZ (%)
Both Males Females
Health care (11.5%)
Construction (8.0%)
Professional, scientific, technical services (7.5%)
Finance & insurance (6.2%)
Educational services (6.2%)
Accommodation & food services (5.8%)
Arts, entertainment, recreation (4.8%)
Construction (13.3%)
Professional, scientific, technical services (8.5%)
Health care (6.5%)
Finance & insurance (5.1%)
Arts, entertainment, recreation (4.8%)
Computer & electronic products (4.5%)
Accommodation & food services (4.0%)
Health care (16.8%)
Educational services (8.5%)
Accommodation & food services (7.8%)
Finance & insurance (7.4%)
Professional, scientific, technical services (6.4%)
Real estate & rental & leasing (5.4%)
Arts, entertainment, recreation (4.8%)
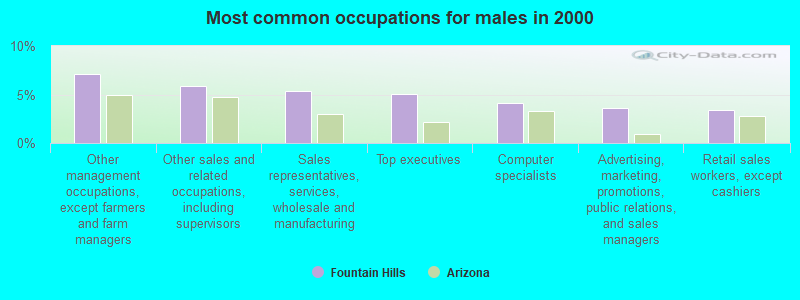
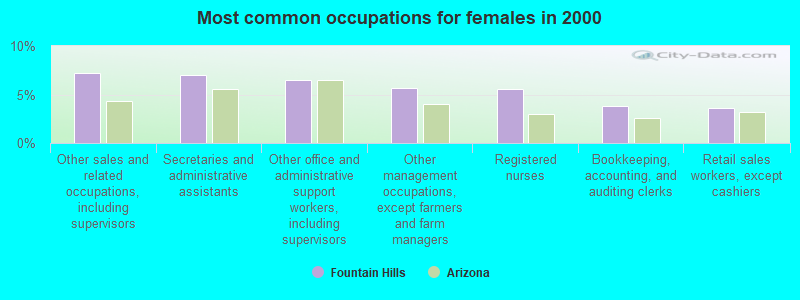
Most common occupations in Fountain Hills, AZ (%)
Both Males Females
Other sales and related occupations, including supervisors (6.5%)
Other management occupations, except farmers and farm managers (6.4%)
Sales representatives, services, wholesale and manufacturing (4.2%)
Other office and administrative support workers, including supervisors (4.0%)
Retail sales workers, except cashiers (3.5%)
Secretaries and administrative assistants (3.5%)
Top executives (3.3%)
Other management occupations, except farmers and farm managers (7.1%)
Other sales and related occupations, including supervisors (5.8%)
Sales representatives, services, wholesale and manufacturing (5.3%)
Top executives (5.1%)
Computer specialists (4.1%)
Advertising, marketing, promotions, public relations, and sales managers (3.7%)
Retail sales workers, except cashiers (3.4%)
Other sales and related occupations, including supervisors (7.2%)
Secretaries and administrative assistants (7.0%)
Other office and administrative support workers, including supervisors (6.4%)
Other management occupations, except farmers and farm managers (5.7%)
Registered nurses (5.5%)
Bookkeeping, accounting, and auditing clerks (3.8%)
Retail sales workers, except cashiers (3.6%)
Earthquake activity:
Fountain Hills-area historical earthquake activity is significantly above Arizona state average. It is 2287% greater than the overall U.S. average. On 6/28/1992 at 11:57:34, a magnitude 7.6 (6.2 MB, 7.6 MS, 7.3 MW, Depth: 0.7 mi, Class: Major, Intensity: VIII - XII) earthquake occurred 278.7 miles away from the city center, causing 3 deaths ( 1 shaking deaths, 2 other deaths) and 400 injuries, causing $100,000,000 total damage and $40,000,000 insured lossesOn 5/19/1940 at 04:36:40, a magnitude 7.2 (7.2 UK) earthquake occurred 230.6 miles away from Fountain Hills center, causing $33,000,000 total damage On 10/16/1999 at 09:46:44, a magnitude 7.4 (6.3 MB, 7.4 MS, 7.2 MW, 7.3 ML) earthquake occurred 276.9 miles away from the city center On 12/31/1934 at 18:45:56, a magnitude 7.1 (7.1 UK) earthquake occurred 242.0 miles away from the city center On 10/15/1979 at 23:16:54, a magnitude 7.0 (5.7 MB, 6.9 MS, 7.0 ML, 6.4 MW) earthquake occurred 232.8 miles away from the city center On 7/21/1952 at 11:52:14, a magnitude 7.7 (7.7 UK) earthquake occurred 426.4 miles away from the city center, causing $50,000,000 total damage Magnitude types: body-wave magnitude (MB), local magnitude (ML), surface-wave magnitude (MS), moment magnitude (MW) Natural disasters: The number of natural disasters in Maricopa County (16) is near the US average (15).Major Disasters (Presidential) Declared: 11Emergencies Declared: 1Floods: 10, Storms: 9, Fires: 3, Flash Flood: 1, Heavy Rain: 1, Hurricane: 1, Tornado: 1, Wind: 1, Other: 1 (Note: some incidents may be assigned to more than one category). Hospitals and medical centers in Fountain Hills: FOUNTAIN VIEW VILLAGE (16455 EAST AVENUE OF THE FOUNTAINS)
Other hospitals and medical centers near Fountain Hills: FOCUS HOME THERAPY AND MEDICAL SERVICES, LLC (Home Health Center, about 7 miles away; SCOTTSDALE, AZ)
LIFE CARE CENTER OF SCOTTSDALE (Nursing Home, about 9 miles away; SCOTTSDALE, AZ)
ADVANCED HEALTH CARE OF SCOTTSDALE (Nursing Home, about 9 miles away; SCOTTSDALE, AZ)
AVALON CARE CENTER - SHADOW MOUNTAIN (Nursing Home, about 9 miles away; SCOTTSDALE, AZ)
DESERT MOUNTAIN DIALYSIS (DVA) (Dialysis Facility, about 9 miles away; SCOTTSDALE, AZ)
WEYRICH HCC OF WESTMINSTER VLG (Nursing Home, about 10 miles away; SCOTTSDALE, AZ)
SCOTTSDALE HEALTHCARE-SHEA MEDICAL CENTER (about 10 miles away; SCOTTSDALE, AZ)
Amtrak station near Fountain Hills: 20 miles: PHOENIX AIRPORT (PHOENIX, TERMINAL 2) - Bus Station Services: enclosed waiting area, public restrooms, public payphones, full-service food facilities, paid short-term parking, paid long-term parking, car rental agency, taxi stand, intercity bus service, public transit connection.
College/University in Fountain Hills: American Institute of Interior Design Full-time enrollment: 31; Location: 13014 N. Saguaro Blvd., Suite 206; Private, for-profit; Website: www.aiid.edu)
Colleges/universities with over 2000 students nearest to Fountain Hills:
Scottsdale Community College (about 12 miles; Scottsdale, AZ ; Full-time enrollment: 6,030)
Le Cordon Bleu College of Culinary Arts-Scottsdale (about 13 miles; Scottsdale, AZ ; FT enrollment: 2,123)
Arizona State University-Skysong (about 15 miles; Scottsdale, AZ ; FT enrollment: 5,445)
Paradise Valley Community College (about 17 miles; Phoenix, AZ ; FT enrollment: 5,259)
Mesa Community College (about 17 miles; Mesa, AZ ; FT enrollment: 14,726)
Arizona State University-Tempe (about 18 miles; Tempe, AZ ; FT enrollment: 45,951)
GateWay Community College (about 19 miles; Phoenix, AZ ; FT enrollment: 3,414)
Public schools in Fountain Hills:
See full list of schools located in Fountain Hills User-submitted facts and corrections:
Local Fountain Hills AM Radio Station KFHX, 1620AM and Streaming Netcasts on www.kfhx.com
Notable locations in Fountain Hills: (A) , Fountain Hills Community Center (B) , Laser Drive Industrial Park (C) , Fountain Hills Town Hall (D) , Maricopa County Library District Fountain Hills Branch (E) , Rural / Metro Fire Department Station 823 Fountain Hills Fire Department (F) , Rural / Metro Fire Department Station 822 Fountain Hills Fire Department (G) . Display/hide their locations on the map
Shopping Centers: (1) , Fountain Hills Plaza Shopping Center (2) , Four Peaks Power Center Shopping Center (3) , Palisades Plaza Shopping Center (4) . Display/hide their locations on the map
Churches in Fountain Hills include: (A) , Church of the Ascension (B) , Four Peaks Community Church (C) , Fountain Hills Trinity Lutheran Church (D) , Fountain Hills First Baptist Church (E) , Fountain Hills Community Church (F) , Fountain Hills Christian Center (G) , Faith Mountain Christian Center (H) , Christ's Church of Fountain Hills (I) . Display/hide their locations on the map
Lake: (A) . Display/hide its location on the map
Park in Fountain Hills: (1) . Display/hide its location on the map
Tourist attractions:
Hotels:
Court:
Birthplace of: Holly Cruikshank - Dancer.
Maricopa County has a predicted average indoor radon screening level between 2 and 4 pCi/L (pico curies per liter) - Moderate Potential Drinking water stations with addresses in Fountain Hills that have no violations reported:
HERMOSA VILLAGE (Serves CO, Population served: 120, Primary Water Source Type: Groundwater)
Average household size: This town:
2.2 peopleArizona:
2.6 people
Percentage of family households: This town:
68.9%Whole state:
66.2%
Percentage of households with unmarried partners: This town:
4.9%Whole state:
7.8%
Likely homosexual households (counted as self-reported same-sex unmarried-partner households)
Lesbian couples: 0.4% of all households Gay men: 0.4% of all households
People in group quarters in Fountain Hills in 2010:
149 people in nursing facilities/skilled-nursing facilities
18 people in workers' group living quarters and job corps centers
15 people in group homes intended for adults
people in other noninstitutional group quarters in 2000Banks with branches in Fountain Hills (2011 data):
JPMorgan Chase Bank, National Association: Shea & Monterey Banking Center, Shea And Eagle Mountain Branch, Fountain Hills Branch. Info updated 2011/11/10: Bank assets: $1,811,678.0 mil, Deposits: $1,190,738.0 mil, headquarters in Columbus, OH, positive income , International Specialization, 5577 total offices , Holding Company: Jpmorgan Chase & Co.
Wells Fargo Bank, National Association: Fountain Hills Branch at 16355 E Palisades Blvd, branch established on 1998/03/02; Palisades Plaza Branch at 13733 Fountain Hills Boulevard, branch established on 1998/04/09. Info updated 2011/04/05: Bank assets: $1,161,490.0 mil, Deposits: $905,653.0 mil, headquarters in Sioux Falls, SD, positive income , 6395 total offices , Holding Company: Wells Fargo & Company
MidFirst Bank: Fountain Hills Branch at 16225 East Palisades Boulevard, branch established on 2007/04/30. Info updated 2011/07/21: Bank assets: $9,790.2 mil, Deposits: $6,308.2 mil, headquarters in Oklahoma City, OK, positive income , Commercial Lending Specialization, 77 total offices
Bank of America, National Association: Fountain Hills Branch at 16925 East Shea Boulevard, branch established on 1997/02/20. Info updated 2009/11/18: Bank assets: $1,451,969.3 mil, Deposits: $1,077,176.8 mil, headquarters in Charlotte, NC, positive income , 5782 total offices , Holding Company: Bank Of America Corporation
Washington Federal: Fountain Hills Branch at 16600 East Avenue Of The Fountains, branch established on 1999/12/30. Info updated 2011/12/19: Bank assets: $13,653.0 mil, Deposits: $8,905.8 mil, headquarters in Seattle, WA, positive income , Mortgage Lending Specialization, 174 total offices
Meridian Bank, National Association: Fountain Hills Branch at 13404 North La Montana Drive, branch established on 1981/02/17. Info updated 2011/04/29: Bank assets: $971.9 mil, Deposits: $709.7 mil, headquarters in Wickenburg, AZ, positive income , Commercial Lending Specialization, 7 total offices , Holding Company: Marquette Financial Companies
For population 15 years and over in Fountain Hills:
Never married: 14.7%Now married: 64.8%Separated: 0.9%Widowed: 9.9%Divorced: 9.7% For population 25 years and over in Fountain Hills:
High school or higher: 97.8%Bachelor's degree or higher: 50.1%Graduate or professional degree: 20.4%Unemployed: 2.2%Mean travel time to work (commute): 18.7 minutes
Education Gini index (Inequality in education) Here:
9.2Arizona average:
12.2
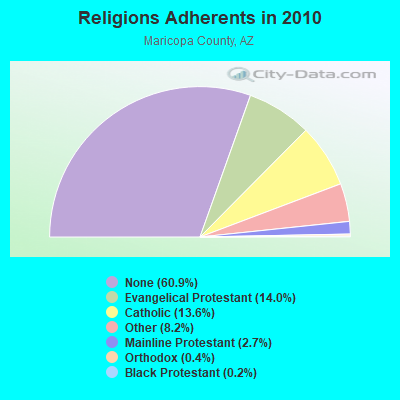
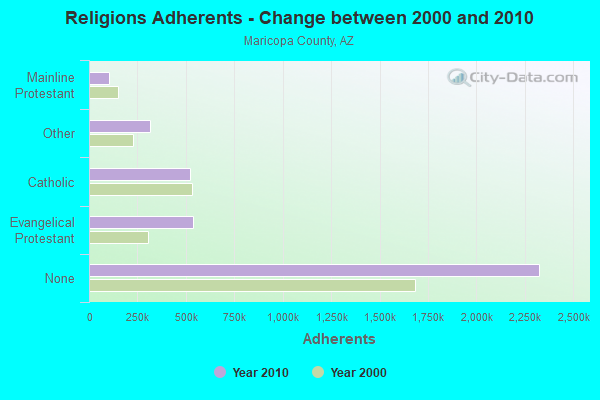
Religion statistics for Fountain Hills, AZ (based on Maricopa County data)
Religion Adherents Congregations Evangelical Protestant 534,453 1,206 Catholic 520,651 100 Other 312,574 680 Mainline Protestant 104,145 241 Orthodox 13,379 24 Black Protestant 6,278 48 None 2,325,637 -
Source: Clifford Grammich, Kirk Hadaway, Richard Houseal, Dale E.Jones, Alexei Krindatch, Richie Stanley and Richard H.Taylor. 2012. 2010 U.S.Religion Census: Religious Congregations & Membership Study. Association of Statisticians of American Religious Bodies. Jones, Dale E., et al. 2002. Congregations and Membership in the United States 2000. Nashville, TN: Glenmary Research Center. Graphs represent county-level data
Food Environment Statistics: Number of grocery stores : 501Maricopa County :
1.30 / 10,000 pop.State :
1.36 / 10,000 pop.
Number of supercenters and club stores : 60This county :
0.16 / 10,000 pop.State :
0.14 / 10,000 pop.
Number of convenience stores (no gas) : 219This county :
0.57 / 10,000 pop.State :
0.55 / 10,000 pop.
Number of convenience stores (with gas) : 768Maricopa County :
1.99 / 10,000 pop.Arizona :
2.47 / 10,000 pop.
Number of full-service restaurants : 2,264Maricopa County :
5.86 / 10,000 pop.Arizona :
6.21 / 10,000 pop.
Adult obesity rate : Maricopa County :
22.5%Arizona :
22.8%
Low-income preschool obesity rate : Maricopa County :
14.8%Arizona :
14.2%
Health and Nutrition: Healthy diet rate : Fountain Hills:
54.7%State:
49.0%
Average overall health of teeth and gums : Fountain Hills:
52.9%State:
47.3%
People feeling badly about themselves : People not drinking alcohol at all : This city:
8.4%Arizona:
10.2%
Average hours sleeping at night : Overweight people : Fountain Hills:
36.4%Arizona:
33.5%
General health condition : Fountain Hills:
59.6%Arizona:
56.1%
Average condition of hearing : This city:
77.8%Arizona:
79.4%
More about Health and Nutrition of Fountain Hills, AZ Residents
Local government employment and payroll (March 2022)
Function
Full-time employees
Monthly full-time payroll
Average yearly full-time wage
Part-time employees
Monthly part-time payroll
Other Government Administration
15 $68,843 $55,074 1 $7,298 Parks and Recreation
12 $60,841 $60,841 7 $9,031 Streets and Highways
11 $69,616 $75,945 0 $0 Other and Unallocable
11 $52,733 $57,527 19 $40,139 Judicial and Legal
5 $35,187 $84,449 0 $0 Financial Administration
4 $29,936 $89,808 4 $3,461 Solid Waste Management
1 $4,454 $53,448 0 $0
Totals for Government
59 $321,610 $65,412 31 $59,929
Fountain Hills government finances - Expenditure in 2021 (per resident):
Current Operations - Miscellaneous Commercial Activities - Other: $5,458,000 ($229.47)
Police Protection: $3,353,000 ($140.97)Local Fire Protection: $2,660,000 ($111.84)Parks and Recreation: $2,520,000 ($105.95)Central Staff Services: $2,132,000 ($89.64)General - Other: $1,087,000 ($45.70)Housing and Community Development: $955,000 ($40.15)General Public Buildings: $753,000 ($31.66)Judicial and Legal Services: $390,000 ($16.40)General - Interest on Debt: $16,000 ($0.67)
Other Capital Outlay - General - Other: $133,000 ($5.59)
Fountain Hills government finances - Revenue in 2021 (per resident):
Charges - Other: $84,000 ($3.53)
Sewerage: $35,000 ($1.47)Miscellaneous - General Revenue - Other: $275,000 ($11.56)
Rents: $265,000 ($11.14)Fines and Forfeits: $211,000 ($8.87)Interest Earnings: $30,000 ($1.26)Revenue - Water Utilities: $30,000 ($1.26)
State Intergovernmental - General Local Government Support: $6,996,000 ($294.13)
Highways: $2,585,000 ($108.68)Tax - General Sales and Gross Receipts: $15,657,000 ($658.27)
Other License: $1,293,000 ($54.36)Occupation and Business License - Other: $1,000,000 ($42.04)Property: $427,000 ($17.95)Corporation Net Income: $426,000 ($17.91)Other: $320,000 ($13.45)
Fountain Hills government finances - Debt in 2021 (per resident):
Long Term Debt - Retired Unspecified Public Purpose: $400,000 ($16.82)
Beginning Outstanding - Unspecified Public Purpose: $400,000 ($16.82)
Fountain Hills government finances - Cash and Securities in 2021 (per resident):
Other Funds - Cash and Securities: $24,811,000 ($1043.14)
5.80% of this county's 2021 resident taxpayers lived in other counties in 2020 ($92,013 average adjusted gross income )
Here:
5.80%Arizona average:
6.85%
0.02% of residents moved from foreign countries ($227 average AGI )Maricopa County:
0.02%Arizona average:
0.03%
Top counties from which taxpayers relocated into this county between 2020 and 2021:
5.04% of this county's 2020 resident taxpayers moved to other counties in 2021 ($76,911 average adjusted gross income )
Here:
5.04%Arizona average:
5.72%
0.02% of residents moved to foreign countries ($234 average AGI )Maricopa County:
0.02%Arizona average:
0.03%
Top counties to which taxpayers relocated from this county between 2020 and 2021:
Businesses in Fountain Hills, AZ
Name Count Name Count
Ace Hardware 1 Kroger 1 Arby's 1 Little Caesars Pizza 1 Big O Tires 1 McDonald's 1 Blockbuster 1 Nike 1 Burger King 1 Pier 1 Imports 1 CVS 1 Pizza Hut 1 Circle K 2 Quiznos 1 Comfort Inn 1 RadioShack 1 Cricket Wireless 1 Starbucks 3 Curves 1 Subway 2 Dennys 1 T-Mobile 1 Discount Tire 1 Target 1 Famous Footwear 1 U-Haul 1 FedEx 5 UPS 3 Goodwill 1 Vons 1 H&R Block 1 Walgreens 1 Holiday Inn 1 Wendy's 1
Strongest AM radio stations in Fountain Hills:
KMIK (1580 AM; 50 kW; TEMPE, AZ; Owner: ABC, INC.)
KFNX (1100 AM; 50 kW; CAVE CREEK, AZ; Owner: NORTH AMERICAN BROADCASTING CO., INC.)
KFNN (1510 AM; 22 kW; MESA, AZ; Owner: CRC BROADCASTING COMPANY, INC.)
KPXQ (1360 AM; 50 kW; GLENDALE, AZ; Owner: COMMON GROUND BROADCASTING, INC.)
KMIA (710 AM; 50 kW; BLACK CANYON CITY, AZ; Owner: ENTRAVISION HOLDINGS, LLC)
KTAR (620 AM; 5 kW; PHOENIX, AZ; Owner: EMMIS RADIO LICENSE CORPORATION)
KXAM (1310 AM; 5 kW; MESA, AZ; Owner: EMBEE BROADCASTING, INC.)
KKNT (960 AM; 5 kW; PHOENIX, AZ; Owner: COMMON GROUND BROADCASTING, INC)
KFYI (550 AM; 5 kW; PHOENIX, AZ; Owner: AMFM RADIO LICENSES, L.L.C.)
KXEM (1010 AM; 15 kW; TOLLESON, AZ; Owner: JAMES CRYSTAL ENTERPRISES OF PHOENIX, INC.)
KAZG (1440 AM; 5 kW; SCOTTSDALE, AZ; Owner: CACTUS RADIO, INC.)
KGME (910 AM; 5 kW; PHOENIX, AZ; Owner: AMFM RADIO LICENSES, L.L.C.)
KDUS (1060 AM; 5 kW; TEMPE, AZ; Owner: TEMPE RADIO, INC.)
Strongest FM radio stations in Fountain Hills:
KLVK (89.1 FM; FOUNTAIN HILLS, AZ; Owner: EDUCATIONAL MEDIA FOUNDATION)
K210CP (89.9 FM; MESA, AZ; Owner: CALVARY CHAPEL OF TWIN FALLS, INC.)
K220HH (91.9 FM; MESA, AZ; Owner: CALVARY CHAPEL OF TWIN FALLS, INC.)
KMLE (107.9 FM; CHANDLER, AZ; Owner: INFINITY RADIO OPERATIONS INC.)
K206BL (89.1 FM; DREAMLAND, AZ; Owner: AMERICAN FAMILY ASSOCIATION)
KSLX-FM (100.7 FM; SCOTTSDALE, AZ; Owner: CACTUS RADIO, INC.)
KKLT (98.7 FM; PHOENIX, AZ; Owner: EMMIS RADIO LICENSE CORPORATION)
KZON (101.5 FM; PHOENIX, AZ; Owner: INFINITY RADIO OPERATIONS INC.)
KKFR (92.3 FM; GLENDALE, AZ; Owner: EMMIS RADIO LICENSE CORPORATION)
KESZ (99.9 FM; PHOENIX, AZ; Owner: CLEAR CHANNEL BROADCASTING LICENSES, INC.)
KOOL-FM (94.5 FM; PHOENIX, AZ; Owner: INFINITY RADIO OPERATIONS INC.)
KNIX-FM (102.5 FM; PHOENIX, AZ; Owner: CLEAR CHANNEL BROADCASTING LICENSES, INC.)
KUPD (97.9 FM; TEMPE, AZ; Owner: TEMPE RADIO, INC.)
KFLR-FM (90.3 FM; PHOENIX, AZ; Owner: FAMILY LIFE BROADCASTING, INC.)
KJZZ (91.5 FM; PHOENIX, AZ; Owner: MARICOPA COUNTY COMM. COLLEGE DIST.)
KYOT-FM (95.5 FM; PHOENIX, AZ; Owner: AMFM RADIO LICENSES, L.L.C.)
KMXP (96.9 FM; PHOENIX, AZ; Owner: CITICASTERS LICENSES, L.P.)
KZZP (104.7 FM; MESA, AZ; Owner: CITICASTERS LICENSES, L.P.)
KDKB (93.3 FM; MESA, AZ; Owner: MESA RADIO, INC.)
K240CV (95.9 FM; PHOENIX, AZ; Owner: ZORBA RESOURCES, INC.)
TV broadcast stations around Fountain Hills:
KAET (Channel 8; PHOENIX, AZ; Owner: ARIZONA BOARD OF REGENTS)
K57HX (Channel 57; MESA, AZ; Owner: KAZT, L.L.C.)
KCOS-LP (Channel 28; PHOENIX, AZ; Owner: ARACELIS ORTIZ, EXECUTRIX OF THE ESTATE OF CARLOS ORTIZ)
KPHE-LP (Channel 19; PHOENIX, AZ; Owner: U.S. INTERACTIVE, L.L.C.)
K42FD (Channel 42; PHOENIX, AZ; Owner: KDMA CHANNEL 25, INC.)
K55EH (Channel 55; PHOENIX, AZ; Owner: KAZT, L.L.C.)
KPPX (Channel 51; TOLLESON, AZ; Owner: AMERICA 51, L.P.)
K23BY (Channel 23; SCOTTSDALE, AZ; Owner: KAZT, L.L.C.)
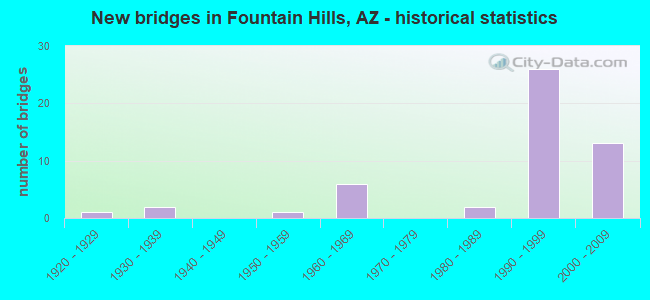
National Bridge Inventory (NBI) Statistics 51 Number of bridges564ft / 172m Total length $9,000 Total costs282,017 Total average daily traffic24,380 Total average daily truck traffic316,876 Total future (year 2037) average daily traffic
New bridges - historical statistics
1 1920-1929 2 1930-1939 1 1950-1959 6 1960-1969 2 1980-1989 26 1990-1999 13 2000-2009
See full National Bridge Inventory statistics for Fountain Hills, AZ
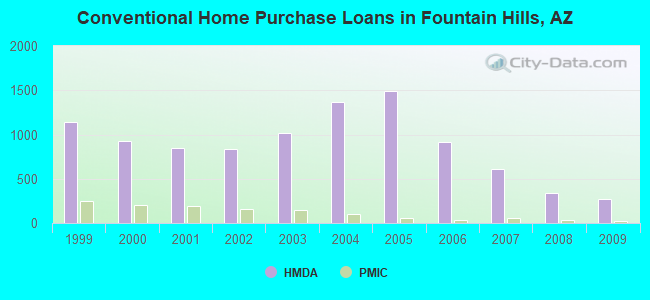
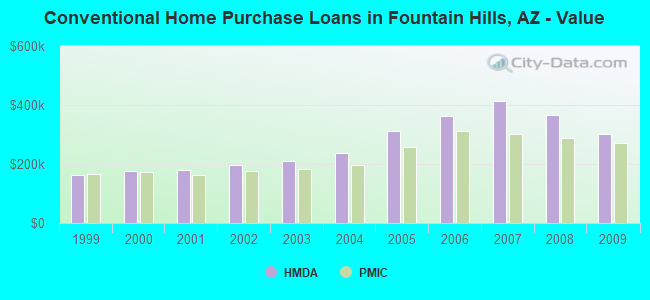
Home Mortgage Disclosure Act Aggregated Statistics For Year 2009(Based on 2 full and 2 partial tracts) A) FHA, FSA/RHS & VA B) Conventional C) Refinancings D) Home Improvement Loans F) Non-occupant Loans on G) Loans On Manufactured Number Average Value Number Average Value Number Average Value Number Average Value Number Average Value Number Average Value
LOANS ORIGINATED 84 $217,278 272 $301,820 895 $271,404 24 $172,030 245 $271,842 2 $599,880 APPLICATIONS APPROVED, NOT ACCEPTED 4 $175,515 30 $434,354 77 $284,214 2 $15,500 22 $268,279 0 $0 APPLICATIONS DENIED 11 $212,945 61 $422,121 316 $343,154 10 $107,642 85 $368,914 1 $125,000 APPLICATIONS WITHDRAWN 13 $239,662 46 $286,596 149 $291,064 15 $118,988 50 $301,394 0 $0 FILES CLOSED FOR INCOMPLETENESS 6 $191,998 12 $329,727 34 $280,859 0 $0 10 $175,109 0 $0
Aggregated Statistics For Year 2008(Based on 2 full and 2 partial tracts) A) FHA, FSA/RHS & VA B) Conventional C) Refinancings D) Home Improvement Loans F) Non-occupant Loans on G) Loans On Manufactured Number Average Value Number Average Value Number Average Value Number Average Value Number Average Value Number Average Value
LOANS ORIGINATED 34 $235,597 334 $367,608 496 $332,320 22 $130,891 224 $297,820 1 $147,000 APPLICATIONS APPROVED, NOT ACCEPTED 6 $260,277 56 $462,561 84 $379,423 3 $42,690 30 $265,218 0 $0 APPLICATIONS DENIED 4 $288,130 75 $569,429 268 $465,828 34 $439,398 67 $292,357 1 $25,000 APPLICATIONS WITHDRAWN 3 $343,743 43 $357,458 110 $399,690 10 $288,191 36 $348,912 0 $0 FILES CLOSED FOR INCOMPLETENESS 3 $213,887 19 $318,402 34 $384,054 3 $97,067 16 $192,794 0 $0
Aggregated Statistics For Year 2007(Based on 2 full and 2 partial tracts) A) FHA, FSA/RHS & VA B) Conventional C) Refinancings D) Home Improvement Loans F) Non-occupant Loans on G) Loans On Manufactured Number Average Value Number Average Value Number Average Value Number Average Value Number Average Value Number Average Value
LOANS ORIGINATED 0 $0 607 $412,050 764 $380,971 63 $278,733 326 $344,005 2 $69,530 APPLICATIONS APPROVED, NOT ACCEPTED 1 $416,000 84 $519,315 160 $364,959 13 $119,825 51 $400,446 0 $0 APPLICATIONS DENIED 1 $127,080 171 $511,412 364 $403,191 63 $205,333 96 $350,104 0 $0 APPLICATIONS WITHDRAWN 1 $137,000 52 $585,454 168 $430,504 25 $141,746 34 $423,059 0 $0 FILES CLOSED FOR INCOMPLETENESS 0 $0 10 $407,818 56 $436,358 6 $117,692 6 $191,842 0 $0
Aggregated Statistics For Year 2006(Based on 2 full and 2 partial tracts) A) FHA, FSA/RHS & VA B) Conventional C) Refinancings D) Home Improvement Loans F) Non-occupant Loans on G) Loans On Manufactured Number Average Value Number Average Value Number Average Value Number Average Value Number Average Value Number Average Value
LOANS ORIGINATED 0 $0 920 $363,733 1,018 $340,534 111 $246,866 409 $313,114 0 $0 APPLICATIONS APPROVED, NOT ACCEPTED 1 $132,650 131 $354,516 149 $376,689 27 $125,911 61 $280,281 0 $0 APPLICATIONS DENIED 2 $244,370 258 $417,286 345 $383,906 56 $166,131 102 $280,813 3 $93,000 APPLICATIONS WITHDRAWN 0 $0 149 $358,517 288 $363,991 17 $167,864 55 $313,730 0 $0 FILES CLOSED FOR INCOMPLETENESS 0 $0 38 $590,352 78 $345,791 2 $125,690 13 $313,862 0 $0
Aggregated Statistics For Year 2005(Based on 2 full and 2 partial tracts) A) FHA, FSA/RHS & VA B) Conventional C) Refinancings D) Home Improvement Loans F) Non-occupant Loans on G) Loans On Manufactured Number Average Value Number Average Value Number Average Value Number Average Value Number Average Value Number Average Value
LOANS ORIGINATED 6 $142,893 1,493 $312,638 1,293 $287,946 109 $213,650 676 $261,561 3 $38,673 APPLICATIONS APPROVED, NOT ACCEPTED 0 $0 153 $351,284 153 $318,900 27 $85,152 59 $254,174 4 $93,335 APPLICATIONS DENIED 0 $0 295 $306,625 348 $296,139 37 $125,169 127 $239,764 3 $91,840 APPLICATIONS WITHDRAWN 0 $0 165 $343,077 211 $306,958 25 $205,843 62 $223,613 0 $0 FILES CLOSED FOR INCOMPLETENESS 0 $0 52 $393,425 144 $310,355 9 $94,766 15 $392,983 0 $0
Aggregated Statistics For Year 2004(Based on 2 full and 2 partial tracts) A) FHA, FSA/RHS & VA B) Conventional C) Refinancings D) Home Improvement Loans E) Loans on Dwellings For 5+ Families F) Non-occupant Loans on G) Loans On Manufactured Number Average Value Number Average Value Number Average Value Number Average Value Number Average Value Number Average Value Number Average Value
LOANS ORIGINATED 8 $141,046 1,362 $237,220 998 $239,614 58 $110,172 1 $420,000 497 $204,649 9 $46,288 APPLICATIONS APPROVED, NOT ACCEPTED 1 $83,480 149 $253,408 159 $222,747 23 $85,238 0 $0 56 $217,558 2 $25,670 APPLICATIONS DENIED 3 $107,740 208 $237,024 295 $247,630 51 $91,767 1 $7,500,000 77 $221,858 0 $0 APPLICATIONS WITHDRAWN 1 $120,590 136 $240,760 216 $226,379 18 $107,341 0 $0 34 $230,429 1 $136,000 FILES CLOSED FOR INCOMPLETENESS 0 $0 31 $223,705 126 $231,796 7 $247,403 0 $0 20 $198,831 1 $60,000
Aggregated Statistics For Year 2003(Based on 2 full and 2 partial tracts) A) FHA, FSA/RHS & VA B) Conventional C) Refinancings D) Home Improvement Loans F) Non-occupant Loans on Number Average Value Number Average Value Number Average Value Number Average Value Number Average Value
LOANS ORIGINATED 20 $146,985 1,019 $211,800 2,424 $197,476 48 $50,502 519 $180,470 APPLICATIONS APPROVED, NOT ACCEPTED 0 $0 90 $203,036 274 $181,521 16 $52,162 49 $143,465 APPLICATIONS DENIED 4 $121,348 119 $200,016 482 $198,733 33 $46,545 44 $192,309 APPLICATIONS WITHDRAWN 3 $136,333 113 $249,143 340 $191,583 4 $23,620 43 $208,180 FILES CLOSED FOR INCOMPLETENESS 1 $178,090 15 $205,593 44 $218,301 3 $83,893 10 $242,472
Aggregated Statistics For Year 2002(Based on 1 full and 1 partial tracts) A) FHA, FSA/RHS & VA B) Conventional C) Refinancings D) Home Improvement Loans E) Loans on Dwellings For 5+ Families F) Non-occupant Loans on Number Average Value Number Average Value Number Average Value Number Average Value Number Average Value Number Average Value
LOANS ORIGINATED 20 $148,286 837 $195,803 1,721 $186,041 41 $36,608 1 $400,000 388 $173,178 APPLICATIONS APPROVED, NOT ACCEPTED 3 $154,667 71 $211,127 227 $178,168 29 $45,420 0 $0 33 $147,619 APPLICATIONS DENIED 7 $116,530 105 $165,117 296 $185,544 28 $41,994 0 $0 42 $150,245 APPLICATIONS WITHDRAWN 8 $122,875 91 $197,802 258 $200,334 7 $49,487 1 $124,730 33 $153,673 FILES CLOSED FOR INCOMPLETENESS 2 $87,355 15 $196,381 52 $210,575 1 $16,010 0 $0 3 $286,233
Aggregated Statistics For Year 2001(Based on 1 full and 1 partial tracts) A) FHA, FSA/RHS & VA B) Conventional C) Refinancings D) Home Improvement Loans E) Loans on Dwellings For 5+ Families F) Non-occupant Loans on Number Average Value Number Average Value Number Average Value Number Average Value Number Average Value Number Average Value
LOANS ORIGINATED 30 $129,886 849 $179,149 1,273 $178,453 67 $34,696 1 $50,000 316 $155,374 APPLICATIONS APPROVED, NOT ACCEPTED 3 $151,667 69 $216,471 152 $182,140 16 $27,656 0 $0 23 $229,400 APPLICATIONS DENIED 1 $118,000 85 $210,963 252 $155,786 44 $28,084 0 $0 29 $146,693 APPLICATIONS WITHDRAWN 3 $128,027 94 $215,795 188 $186,643 5 $52,958 1 $19,000 24 $170,818 FILES CLOSED FOR INCOMPLETENESS 1 $64,700 20 $187,640 51 $218,248 1 $110,000 0 $0 8 $152,501
Aggregated Statistics For Year 2000(Based on 1 full and 1 partial tracts) A) FHA, FSA/RHS & VA B) Conventional C) Refinancings D) Home Improvement Loans E) Loans on Dwellings For 5+ Families F) Non-occupant Loans on Number Average Value Number Average Value Number Average Value Number Average Value Number Average Value Number Average Value
LOANS ORIGINATED 36 $120,655 932 $176,649 316 $144,486 70 $29,864 0 $0 246 $171,339 APPLICATIONS APPROVED, NOT ACCEPTED 2 $151,500 88 $171,222 63 $120,464 39 $33,642 0 $0 16 $170,314 APPLICATIONS DENIED 7 $116,857 155 $163,785 147 $114,129 45 $28,970 1 $27,530,000 22 $136,791 APPLICATIONS WITHDRAWN 6 $128,567 79 $169,982 74 $123,572 10 $34,572 0 $0 27 $137,705 FILES CLOSED FOR INCOMPLETENESS 1 $115,390 19 $301,651 34 $185,376 3 $20,333 0 $0 3 $241,213
Aggregated Statistics For Year 1999(Based on 1 full and 1 partial tracts) A) FHA, FSA/RHS & VA B) Conventional C) Refinancings D) Home Improvement Loans F) Non-occupant Loans on Number Average Value Number Average Value Number Average Value Number Average Value Number Average Value
LOANS ORIGINATED 25 $126,866 1,137 $163,633 642 $136,388 103 $26,601 319 $138,817 APPLICATIONS APPROVED, NOT ACCEPTED 1 $156,010 95 $185,288 115 $125,637 33 $33,497 32 $142,372 APPLICATIONS DENIED 7 $119,999 144 $150,384 178 $122,133 48 $32,372 40 $154,815 APPLICATIONS WITHDRAWN 0 $0 133 $179,804 107 $142,048 7 $52,677 28 $134,120 FILES CLOSED FOR INCOMPLETENESS 0 $0 26 $184,333 53 $165,575 2 $19,500 9 $94,309
Detailed HMDA statistics for the following Tracts:
2168.18
, 2168.19 , 2168.20 , 2168.21
Private Mortgage Insurance Companies Aggregated Statistics For Year 2009(Based on 2 full and 2 partial tracts) A) Conventional B) Refinancings C) Non-occupant Loans on Number Average Value Number Average Value Number Average Value
LOANS ORIGINATED 28 $270,853 7 $339,550 6 $242,722 APPLICATIONS APPROVED, NOT ACCEPTED 9 $295,999 4 $324,110 2 $341,500 APPLICATIONS DENIED 8 $301,191 2 $414,795 2 $446,955 APPLICATIONS WITHDRAWN 0 $0 1 $380,000 0 $0 FILES CLOSED FOR INCOMPLETENESS 0 $0 1 $112,000 1 $112,000
Aggregated Statistics For Year 2008(Based on 2 full and 2 partial tracts) A) Conventional B) Refinancings C) Non-occupant Loans on Number Average Value Number Average Value Number Average Value
LOANS ORIGINATED 38 $287,355 14 $324,760 7 $333,651 APPLICATIONS APPROVED, NOT ACCEPTED 16 $290,824 7 $368,704 5 $232,942 APPLICATIONS DENIED 8 $242,971 3 $234,000 4 $147,750 APPLICATIONS WITHDRAWN 2 $246,325 1 $194,000 1 $360,000 FILES CLOSED FOR INCOMPLETENESS 0 $0 1 $274,800 0 $0
Aggregated Statistics For Year 2007(Based on 2 full and 2 partial tracts) A) Conventional B) Refinancings C) Non-occupant Loans on Number Average Value Number Average Value Number Average Value
LOANS ORIGINATED 53 $302,622 26 $357,827 13 $368,650 APPLICATIONS APPROVED, NOT ACCEPTED 8 $335,530 5 $337,256 4 $375,628 APPLICATIONS DENIED 1 $175,000 1 $536,940 0 $0 APPLICATIONS WITHDRAWN 6 $258,088 3 $329,167 2 $224,265 FILES CLOSED FOR INCOMPLETENESS 0 $0 0 $0 0 $0
Aggregated Statistics For Year 2006(Based on 2 full and 2 partial tracts) A) Conventional B) Refinancings C) Non-occupant Loans on Number Average Value Number Average Value Number Average Value
LOANS ORIGINATED 30 $310,561 12 $472,607 15 $307,983 APPLICATIONS APPROVED, NOT ACCEPTED 6 $328,668 3 $364,667 1 $297,760 APPLICATIONS DENIED 1 $360,840 0 $0 1 $360,840 APPLICATIONS WITHDRAWN 1 $202,000 1 $327,000 1 $327,000 FILES CLOSED FOR INCOMPLETENESS 0 $0 0 $0 0 $0
Aggregated Statistics For Year 2005(Based on 2 full and 2 partial tracts) A) Conventional B) Refinancings C) Non-occupant Loans on Number Average Value Number Average Value Number Average Value
LOANS ORIGINATED 54 $257,852 15 $235,227 20 $232,938 APPLICATIONS APPROVED, NOT ACCEPTED 16 $364,250 6 $188,962 5 $243,340 APPLICATIONS DENIED 0 $0 1 $278,810 0 $0 APPLICATIONS WITHDRAWN 3 $300,333 2 $343,925 1 $378,000 FILES CLOSED FOR INCOMPLETENESS 1 $288,810 1 $342,840 1 $288,810
Aggregated Statistics For Year 2004(Based on 2 full and 2 partial tracts) A) Conventional B) Refinancings C) Non-occupant Loans on Number Average Value Number Average Value Number Average Value
LOANS ORIGINATED 97 $196,277 45 $196,117 45 $169,906 APPLICATIONS APPROVED, NOT ACCEPTED 20 $170,562 21 $252,314 14 $149,731 APPLICATIONS DENIED 4 $201,000 2 $137,285 2 $196,575 APPLICATIONS WITHDRAWN 9 $186,412 4 $194,698 5 $138,400 FILES CLOSED FOR INCOMPLETENESS 1 $171,000 0 $0 0 $0
Aggregated Statistics For Year 2003(Based on 2 full and 2 partial tracts) A) Conventional B) Refinancings C) Non-occupant Loans on Number Average Value Number Average Value Number Average Value
LOANS ORIGINATED 146 $181,767 116 $176,931 40 $161,942 APPLICATIONS APPROVED, NOT ACCEPTED 25 $168,088 31 $175,055 8 $218,636 APPLICATIONS DENIED 9 $177,083 3 $182,520 3 $131,333 APPLICATIONS WITHDRAWN 7 $223,790 3 $261,320 2 $322,830 FILES CLOSED FOR INCOMPLETENESS 0 $0 1 $422,210 0 $0
Aggregated Statistics For Year 2002(Based on 1 full and 1 partial tracts) A) Conventional B) Refinancings C) Non-occupant Loans on Number Average Value Number Average Value Number Average Value
LOANS ORIGINATED 163 $177,711 97 $195,527 34 $188,426 APPLICATIONS APPROVED, NOT ACCEPTED 32 $216,930 31 $204,655 8 $187,592 APPLICATIONS DENIED 8 $181,488 2 $184,230 2 $146,365 APPLICATIONS WITHDRAWN 6 $182,738 3 $198,367 0 $0 FILES CLOSED FOR INCOMPLETENESS 0 $0 2 $120,370 0 $0
Aggregated Statistics For Year 2001(Based on 1 full and 1 partial tracts) A) Conventional B) Refinancings C) Non-occupant Loans on Number Average Value Number Average Value Number Average Value
LOANS ORIGINATED 193 $162,602 90 $164,675 35 $140,065 APPLICATIONS APPROVED, NOT ACCEPTED 37 $205,071 25 $182,081 10 $199,840 APPLICATIONS DENIED 6 $208,073 7 $156,871 1 $432,880 APPLICATIONS WITHDRAWN 4 $146,478 5 $135,760 3 $156,840 FILES CLOSED FOR INCOMPLETENESS 2 $387,450 3 $121,583 1 $79,000
Aggregated Statistics For Year 2000(Based on 1 full and 1 partial tracts) A) Conventional B) Refinancings C) Non-occupant Loans on Number Average Value Number Average Value Number Average Value
LOANS ORIGINATED 200 $172,710 27 $167,467 39 $140,405 APPLICATIONS APPROVED, NOT ACCEPTED 47 $193,169 7 $200,867 5 $151,044 APPLICATIONS DENIED 9 $207,929 6 $200,490 2 $134,870 APPLICATIONS WITHDRAWN 9 $223,144 1 $208,770 0 $0 FILES CLOSED FOR INCOMPLETENESS 1 $130,070 0 $0 0 $0
Aggregated Statistics For Year 1999(Based on 1 full and 1 partial tracts) A) Conventional B) Refinancings C) Non-occupant Loans on Number Average Value Number Average Value Number Average Value
LOANS ORIGINATED 252 $166,415 63 $168,718 33 $135,635 APPLICATIONS APPROVED, NOT ACCEPTED 36 $199,234 21 $197,396 11 $172,000 APPLICATIONS DENIED 7 $151,157 3 $134,203 3 $147,400 APPLICATIONS WITHDRAWN 12 $154,306 3 $214,983 1 $112,960 FILES CLOSED FOR INCOMPLETENESS 6 $159,500 1 $182,300 2 $86,895
Detailed PMIC statistics for the following Tracts:
2168.18
, 2168.19 , 2168.20 , 2168.21
Most common first names in Fountain Hills, AZ among deceased individuals Name Count Lived (average)
John 85 78.6 years Robert 80 75.6 years William 63 75.9 years Mary 53 81.7 years Dorothy 44 82.3 years Richard 43 70.4 years Helen 41 82.3 years James 41 73.6 years Joseph 39 76.6 years Margaret 38 83.4 years
Most common last names in Fountain Hills, AZ among deceased individuals Last name Count Lived (average)
Smith 20 73.2 years Johnson 19 77.1 years King 12 74.8 years Miller 10 76.4 years Brown 10 77.5 years Nelson 10 81.4 years Martin 9 76.0 years Wilson 9 81.1 years Thompson 8 84.9 years Anderson 8 89.1 years
Fountain Hills compared to Arizona state average:
Median house value above state average. Unemployed percentage significantly below state average. Hispanic race population percentage significantly below state average. Median age significantly above state average. Renting percentage below state average. Length of stay since moving in significantly above state average. Percentage of population with a bachelor's degree or higher above state average. Fountain Hills on our top lists :
#39 on the list of "Top 101 cities with largest percentage of males in occupations: sales and related occupations (population 5,000+)"
#44 on the list of "Top 101 cities with the most residents born in Other Eastern Asia (population 500+)"
#57 on the list of "Top 101 cities with the most people born in other U.S. states (population 5,000+)"
#2 on the list of "Top 101 counties with the highest Nitrogen Dioxide air pollution readings in 2012 (ppm)"
#3 on the list of "Top 101 counties with the highest total withdrawal of fresh water for public supply"
#3 on the list of "Top 101 counties with the highest surface withdrawal of fresh water for public supply"
#4 on the list of "Top 101 counties with the most Other congregations"
#5 on the list of "Top 101 counties with the most Evangelical Protestant adherents (pop. 50,000+)"
Top Patent Applicants
William Johnstone Ray (75)
Frederic Zenhausern (28)
William J. Ray (19)
Robert Tripp (17)
Francine Y. Robb (16)
David K. Jan (13)
Steven W. Wentworth (12)
Philip H. Bowles (10)
Sourav Sam Bhattacharya (10)
Nongjian Tao (9)
Total of 486 patent applications in 2008-2024.
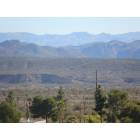
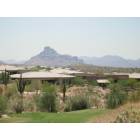
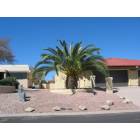
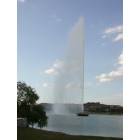
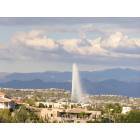
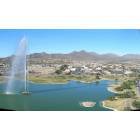
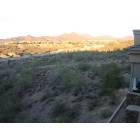
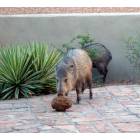
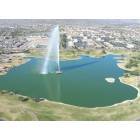
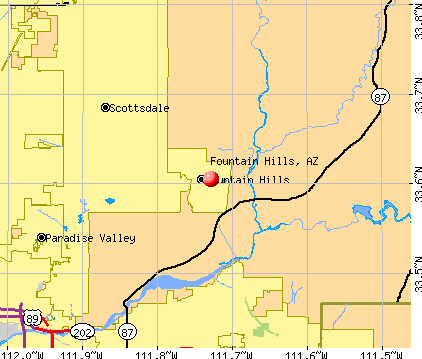


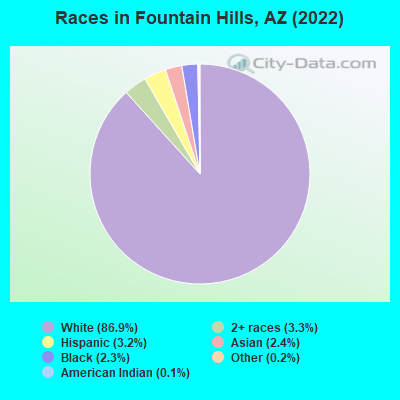
 Recent articles from our blog. Our writers, many of them Ph.D. graduates or candidates, create easy-to-read articles on a wide variety of topics.

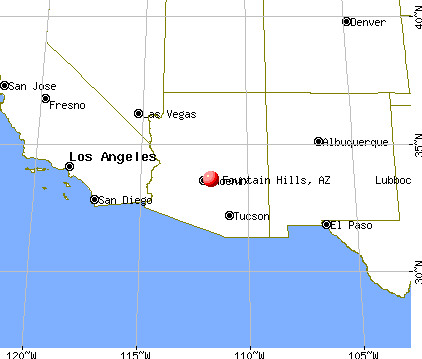
 (9.7 miles