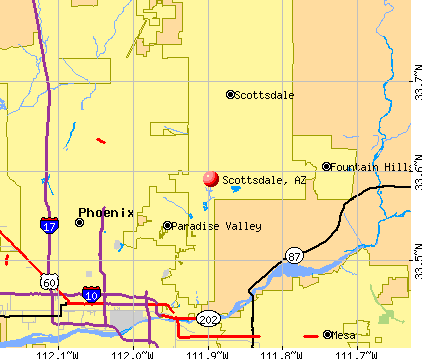
Scottsdale, Arizona
Scottsdale: Beautiful Sunset taken from Happy Valley near Troon in Scottsdale
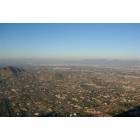
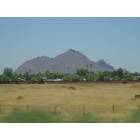
Scottsdale: The View from Camelback Mountain
Scottsdale: Sunset from Stiel Mountain in Scottsdale
Scottsdale: On the golf course in Scottsdale
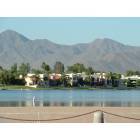
Scottsdale: from Via De Ventura west of
Scottsdale: On the 101
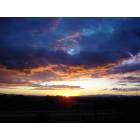
Scottsdale: Beautiful Dramatic Cloudy Sunset near Troon Mountain - Scottsdale
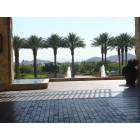
Scottsdale: Coming out of hotel in Scottsdale
Scottsdale: Burnt Orange Sunset taken from Happy Valley Road near Troon Mountain in Scottsdale

Scottsdale: The McDowell Mountains, March 2004
Scottsdale: cactus in downtown scottsdale
- see
52
more - add
your
Submit your own pictures of this city and show them to the world
- OSM Map
- General Map
- Google Map
- MSN Map
Population change since 2000: +19.9%
 |
| Males: 118,291 | |
| Females: 124,759 |
| Median resident age: | 48.7 years |
| Arizona median age: | 38.8 years |
Zip codes: 85257, 85258, 85260.
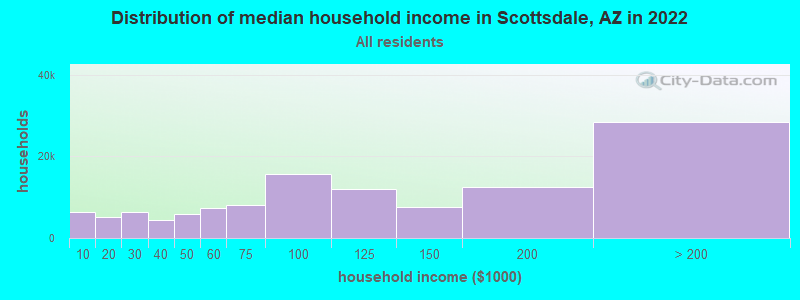
Scottsdale Zip Code Map| Scottsdale: | $100,636 |
| AZ: | $74,568 |
Estimated per capita income in 2022: $81,572 (it was $39,158 in 2000)
Scottsdale city income, earnings, and wages data
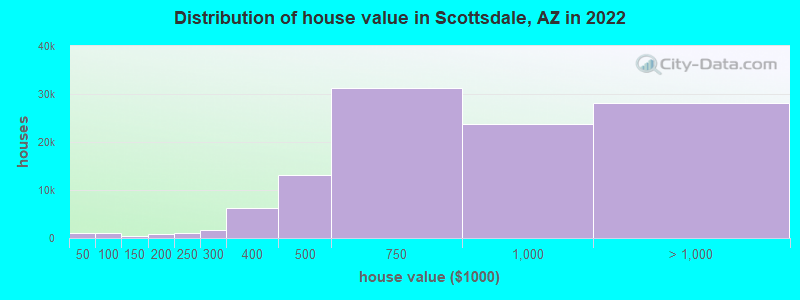
Estimated median house or condo value in 2022: $764,500 (it was $205,000 in 2000)
| Scottsdale: | $764,500 |
| AZ: | $402,800 |
Mean prices in 2022: all housing units: $922,174; detached houses: over $1,000,000; townhouses or other attached units: $597,566; in 2-unit structures: $650,276; in 3-to-4-unit structures: $555,573; in 5-or-more-unit structures: $430,229; mobile homes: $93,390
Median gross rent in 2022: $1,926.
(7.1% for White Non-Hispanic residents, 22.5% for Black residents, 9.7% for Hispanic or Latino residents, 8.6% for American Indian residents, 6.2% for Native Hawaiian and other Pacific Islander residents, 13.7% for other race residents, 7.7% for two or more races residents)
Detailed information about poverty and poor residents in Scottsdale, AZ


Compare current foreclosures in Scottsdale, AZ:
| Photo | Address | Area | Beds / Baths | Price | Details |
|---|---|---|---|---|---|

|
#1
N Hayden Rd Apt 3616
Scottsdale, AZ 85251
|
962 sq. feet
|
1 baths 1 beds |
show details | |

|
#2
E Keim Dr
Scottsdale, AZ 85250
|
3,597 sq. feet
|
6 baths 4 beds |
show details | |

|
#3
E Deer Valley Rd Unit 184
Scottsdale, AZ 85255
|
2,371 sq. feet
|
3 baths 4 beds |
show details | |

|
#4
E Indian School Rd Unit F
Scottsdale, AZ 85251
|
609 sq. feet
|
1 baths - beds |
show details | |

|
#5
E Desert Vw
Scottsdale, AZ 85255
|
2,954 sq. feet
|
4 baths 4 beds |
show details | |

|
#6
N 108th Pl
Scottsdale, AZ 85259
|
3,697 sq. feet
|
3 baths 4 beds |
show details | |

|
#7
E Anderson Dr
Scottsdale, AZ 85254
|
1,977 sq. feet
|
3 baths 3 beds |
show details | |

|
#8
E Monterosa St
Scottsdale, AZ 85251
|
1,876 sq. feet
|
2 baths 3 beds |
show details | |

|
#9
N Miller Rd Unit 8
Scottsdale, AZ 85257
|
1,026 sq. feet
|
2 baths 2 beds |
show details | |

|
#10
N 82nd St
Scottsdale, AZ 85251
|
- sq. feet
|
1 baths 3 beds |
show details |
| Photo | Address | Area | Beds / Baths | Price | Details |
|---|---|---|---|---|---|

|
#11
E Clinton St
Scottsdale, AZ 85260
|
2,048 sq. feet
|
2 baths 4 beds |
show details | |

|
#12
E Thunderbird Rd
Scottsdale, AZ 85254
|
2,256 sq. feet
|
2 baths 4 beds |
show details | |

|
#13
E Mariposa St
Scottsdale, AZ 85251
|
3,878 sq. feet
|
5 baths - beds |
show details | |

|
#14
N 78th St
Scottsdale, AZ 85266
|
2,031 sq. feet
|
2 baths - beds |
show details | |

|
#15
E Lincoln Dr
Scottsdale, AZ 85250
|
1,881 sq. feet
|
2 baths - beds |
show details | |

|
#16
E Surrey Ave
Scottsdale, AZ 85260
|
2,432 sq. feet
|
4 baths - beds |
show details | |

|
#17
N Miller Rd Unit 119
Scottsdale, AZ 85257
|
1,276 sq. feet
|
2 baths - beds |
show details | |

|
#18
E Floriade Dr
Scottsdale, AZ 85260
|
2,440 sq. feet
|
4 baths - beds |
show details | |

|
#19
N 58th Pl
Scottsdale, AZ 85254
|
2,447 sq. feet
|
2 baths - beds |
show details | |

|
#20
E Desert Arroyos
Scottsdale, AZ 85255
|
3,654 sq. feet
|
- baths - beds |
show details |
| Photo | Address | Area | Beds / Baths | Price | Details |
|---|---|---|---|---|---|

|
#21
E Westland Rd
Scottsdale, AZ 85262
|
2,016 sq. feet
|
- baths - beds |
show details | |

|
#22
E Shea Blvd
Scottsdale, AZ 85254
|
2,571 sq. feet
|
- baths - beds |
show details | |

|
#23
N Scottsdale Rd Ste 103
Scottsdale, AZ 85266
|
- sq. feet
|
- baths - beds |
show details | |

|
#24
E Diamond St
Scottsdale, AZ 85257
|
1,682 sq. feet
|
- baths - beds |
show details | |

|
#25
E Becker Ln
Scottsdale, AZ 85259
|
1,699 sq. feet
|
- baths - beds |
show details | |

|
#26
E Garfield St
Scottsdale, AZ 85257
|
1,263 sq. feet
|
- baths - beds |
show details | |

|
#27
E Indian School Rd Unit 148
Scottsdale, AZ 85251
|
- sq. feet
|
- baths - beds |
show details | |

|
#28
N 115th St Apt 1038
Scottsdale, AZ 85259
|
- sq. feet
|
- baths - beds |
show details | |

|
#29
N 164th St
Scottsdale, AZ 85262
|
- sq. feet
|
- baths - beds |
show details | |

|
#30
N 59th Pl
Scottsdale, AZ 85254
|
2,539 sq. feet
|
- baths - beds |
show details |
| Photo | Address | Area | Beds / Baths | Price | Details |
|---|---|---|---|---|---|

|
#31
E Thompson Peak Pkwy Apt R2006
Scottsdale, AZ 85255
|
- sq. feet
|
- baths - beds |
show details | |

|
#32
N Winfield Scott Plz
Scottsdale, AZ 85251
|
- sq. feet
|
- baths - beds |
show details | |

|
#33
N 85th St
Scottsdale, AZ 85260
|
3,667 sq. feet
|
- baths - beds |
show details | |

|
#34
E Altadena Ave
Scottsdale, AZ 85260
|
1,802 sq. feet
|
- baths - beds |
show details | |

|
#35
N Alma School Pkwy
Scottsdale, AZ 85262
|
- sq. feet
|
- baths - beds |
show details | |

|
#36
E Camelback Rd Ste 230
Scottsdale, AZ 85251
|
- sq. feet
|
- baths - beds |
show details | |

|
#37
N Scottsdale Rd Apt 3266
Scottsdale, AZ 85255
|
- sq. feet
|
- baths - beds |
show details | |

|
#38
N Miller Rd
Scottsdale, AZ 85251
|
1,656 sq. feet
|
- baths - beds |
show details | |

|
#39
E Virginia Ave
Scottsdale, AZ 85257
|
1,747 sq. feet
|
- baths - beds |
show details | |

|
#40
E Redfield Rd Unit 1046
Scottsdale, AZ 85260
|
- sq. feet
|
- baths - beds |
show details |
| Photo | Address | Area | Beds / Baths | Price | Details |
|---|---|---|---|---|---|

|
#41
N 56th St Apt 109
Scottsdale, AZ 85254
|
- sq. feet
|
- baths - beds |
show details | |

|
#42
E Phelps Rd
Scottsdale, AZ 85254
|
1,802 sq. feet
|
- baths - beds |
show details | |

|
#43
N 63rd Way
Scottsdale, AZ 85254
|
1,587 sq. feet
|
- baths - beds |
show details | |

|
#44
E Glenrosa Ave
Scottsdale, AZ 85251
|
904 sq. feet
|
- baths - beds |
show details | |

|
#45
E Montecito Ave
Scottsdale, AZ 85251
|
1,416 sq. feet
|
- baths - beds |
show details | |

|
#46
E Thomas Rd Frnt 2014
Scottsdale, AZ 85251
|
- sq. feet
|
- baths - beds |
show details | |

|
#47
E Gray Rd
Scottsdale, AZ 85260
|
1,978 sq. feet
|
- baths - beds |
show details | |

|
#48
E Palo Brea Bnd Unit 2025
Scottsdale, AZ 85255
|
- sq. feet
|
- baths - beds |
show details | |

|
#49
N Scottsdale Rd Ste 117
Scottsdale, AZ 85254
|
- sq. feet
|
- baths - beds |
show details | |

|
Check over 1 million property listings on Foreclosure.com!
|
browse all offers | |||


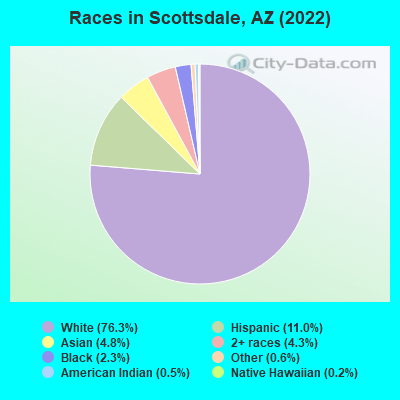
- 185,35076.3%White alone
- 26,80411.0%Hispanic
- 11,7664.8%Asian alone
- 10,3804.3%Two or more races
- 5,5512.3%Black alone
- 1,4550.6%Other race alone
- 1,3250.5%American Indian alone
- 3960.2%Native Hawaiian and Other
Pacific Islander alone
According to our research of Arizona and other state lists, there were 59 registered sex offenders living in Scottsdale, Arizona as of April 27, 2024.
The ratio of all residents to sex offenders in Scottsdale is 4,180 to 1.
The ratio of registered sex offenders to all residents in this city is much lower than the state average.
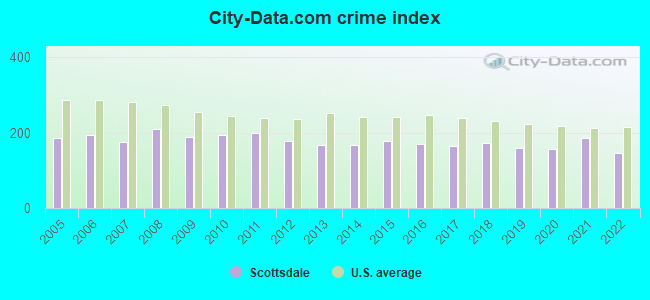
The City-Data.com crime index weighs serious crimes and violent crimes more heavily. Higher means more crime, U.S. average is 246.1. It adjusts for the number of visitors and daily workers commuting into cities.
- means the value is smaller than the state average.- means the value is about the same as the state average.
- means the value is bigger than the state average.
- means the value is much bigger than the state average.
Crime rate in Scottsdale detailed stats: murders, rapes, robberies, assaults, burglaries, thefts, arson
Full-time law enforcement employees in 2021, including police officers: 613 (375 officers - 338 male; 37 female).
| Officers per 1,000 residents here: | 1.53 |
| Arizona average: | 1.75 |
 Recent articles from our blog. Our writers, many of them Ph.D. graduates or candidates, create easy-to-read articles on a wide variety of topics.


Latest news from Scottsdale, AZ collected exclusively by city-data.com from local newspapers, TV, and radio stations
Ancestries: German (9.8%), English (8.5%), American (8.3%), Irish (7.1%), Italian (6.3%), European (5.2%).
Current Local Time: MST (no DST) time zone
Incorporated in 1951
Land area: 184.2 square miles.
Population density: 1,319 people per square mile (low).
29,150 residents are foreign born (4.4% Asia, 2.9% Europe, 2.3% Latin America, 1.6% North America).
| This city: | 11.8% |
| Arizona: | 13.0% |
Median real estate property taxes paid for housing units with mortgages in 2022: $2,854 (0.4%)
Median real estate property taxes paid for housing units with no mortgage in 2022: $2,758 (0.4%)
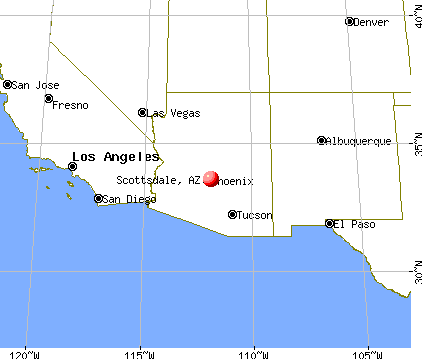
Nearest city with pop. 1,000,000+: Phoenix, AZ  (11.3 miles , pop. 1,321,045).
Nearest cities:
), ), Latitude: 33.59 N, Longitude: 111.90 W
Daytime population change due to commuting: +73,078 (+30.1%)
Workers who live and work in this city: 74,479 (58.6%)
Property values in Scottsdale, AZ

Detailed articles:
- Scottsdale: Introduction
- Scottsdale Basic Facts
- Scottsdale: Communications
- Scottsdale: Convention Facilities
- Scottsdale: Economy
- Scottsdale: Education and Research
- Scottsdale: Geography and Climate
- Scottsdale: Health Care
- Scottsdale: History
- Scottsdale: Municipal Government
- Scottsdale: Population Profile
- Scottsdale: Recreation
- Scottsdale: Transportation
Scottsdale tourist attractions:
- Palms - Scottsdale, AZ - Arizona boutique hotel
- Two Casino Venues Featuring Gaming and Entertainment
- Chaparral Suites Resort - Scottsdale, Arizona - Hotel Featuring Tennis Courts and Swimming Pools
- Cracker Jax Family Fun & Sports Park - Scottsdale, Arizona - Park Featuring Rides, Golf Range and Other Sports
- Doubletree Paradise Valley Resort - Scottsdale, AZ - Luxury resort
- Fifth Avenue - Scottsdale, AZ - Historic shopping district
- Gainey Suites Hotel - Scottsdale, AZ - Luxury suite resort
- Hotel Indigo Scottsdale - Scottsdale, AZ - Boutique hotel
- Kierland Commons - Scottsdale, Arizona - Shopping Center
- Marshall Way Arts District - Scottsdale, AZ - Collection of galleries
- Millennium Resort Scottsdale McCormick Ranch - Scottsdale, AZ - Lakeside resort
- Fiesta Bowl Museum
- Kierland Golf Course
- Mountain View Park
- Scottsdale Civic Center
- Scottsdale Community College
- Scottsdale Historical Museum
- Scottsdale Museum of Contemporary Art
- Scottsdale Ranch Park
- Raptor at Grayhawk Golf Club
- Scottsdale Stadium
- Starfire Golf Club at Scottsdale Country Club
- Talking Stick Golf Club
- Legend Trail Golf Club
- Tournament Players Club (TPC) of Scottsdale Stadium Course
- Troon North Golf Club
- Arizona Canal
- Arizona Cowboy College
- McCormick-Stillman Railroad Park
- Legend Trail Golf Club
- Stagebrush Theatre
- Sylvia Plotkin Judaic Museum
- The Comedy Spot Comedy Club
- The Promenade
- Vista Del Camino Park
- Scottsdale Marriott at McDowell Mountains
- Moss Spa
- Willow Stream Spa at the Fairmont Scottsdale Princess
- Camelback Inn
- Fairmont Scottsdale
- FireSky Resort and Spa- a Kimpton Hotel
- Four Seasons Resort Scottsdale at Troon North
- Hotel Valley Ho
- Hyatt Regency Scottsdale Resort and Spa at Gainey Ranch
- Millennium Resort Scottsdale McCormick Ranch
- The Phoenician
- Westin Kierland Resort and Spa
- Westin Kierland Villas
- Camelback Golf Club
- Cosanti Foundation
- Scottsdale Marriott Suites Old Town
- Cactus Park
- Radisson Fort McDowell Resort & Casino - Scottsdale, Arizona - Hotel Resort Featuring an Adjoining Casino
- Scottsdale Cottonwoods Resort - Scottsdale, Arizona - Hotel Featuring Pools and Tennis Courts
- Scottsdale Fashion Square - Scottsdale, Arizona - Shopping Center
- Scottsdale Resort and Conference Center - Scottsdale, AZ - Award-winning resort
- Sheraton Desert Oasis - Scottsdale, AZ - Villa resort
- Taliesin West - Scottsdale, AZ - Famous school
- The Borgata of Scottsdale - Scottsdale, Arizona - Shopping Center
- The Monument at Troon North Golf Club, Scottsdale, Arizona Consistently Found on Golfers' Must-Play Lists
- W Scottsdale - Scottsdale, Arizona - Hotel Featuring Pool, Fitness Center and Spa
- Wingate Inn and Suites of Scottsdale - Scottsdale, AZ - Business-focused hotel
- Xona Resort Suites - Scottsdale, Arizona - Hotel Featuring Four Swimming Pools
Scottsdale, Arizona accommodation & food services, waste management - Economy and Business Data
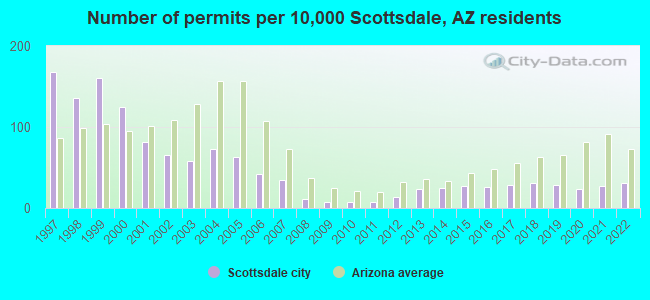
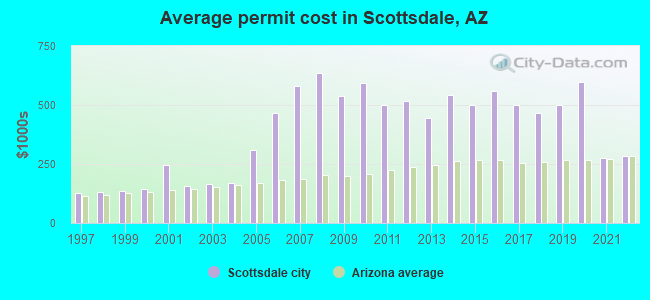
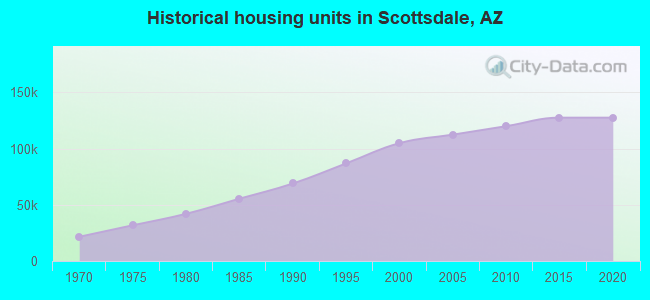
Single-family new house construction building permits:
- 2022: 624 buildings, average cost: $282,200
- 2021: 553 buildings, average cost: $275,200
- 2020: 482 buildings, average cost: $597,800
- 2019: 590 buildings, average cost: $498,300
- 2018: 620 buildings, average cost: $465,400
- 2017: 560 buildings, average cost: $498,100
- 2016: 534 buildings, average cost: $557,600
- 2015: 540 buildings, average cost: $501,000
- 2014: 499 buildings, average cost: $540,700
- 2013: 485 buildings, average cost: $445,400
- 2012: 275 buildings, average cost: $517,900
- 2011: 148 buildings, average cost: $500,500
- 2010: 160 buildings, average cost: $591,500
- 2009: 142 buildings, average cost: $538,200
- 2008: 233 buildings, average cost: $633,700
- 2007: 689 buildings, average cost: $580,000
- 2006: 852 buildings, average cost: $466,900
- 2005: 1282 buildings, average cost: $310,500
- 2004: 1475 buildings, average cost: $169,700
- 2003: 1167 buildings, average cost: $164,200
- 2002: 1328 buildings, average cost: $158,100
- 2001: 1672 buildings, average cost: $246,500
- 2000: 2542 buildings, average cost: $143,800
- 1999: 3239 buildings, average cost: $136,700
- 1998: 2748 buildings, average cost: $132,000
- 1997: 3396 buildings, average cost: $129,000
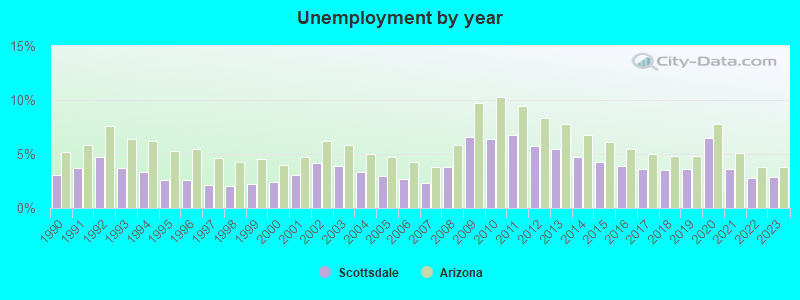
| Here: | 2.9% |
| Arizona: | 3.8% |
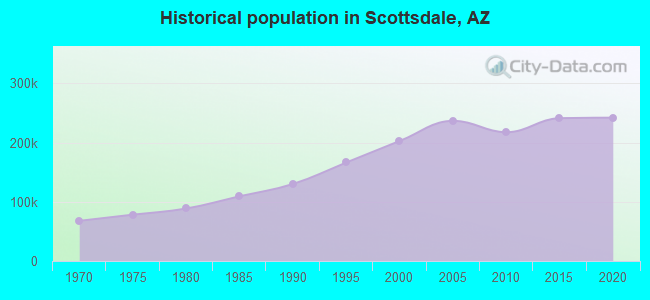
Population change in the 1990s: +72,151 (+55.3%).
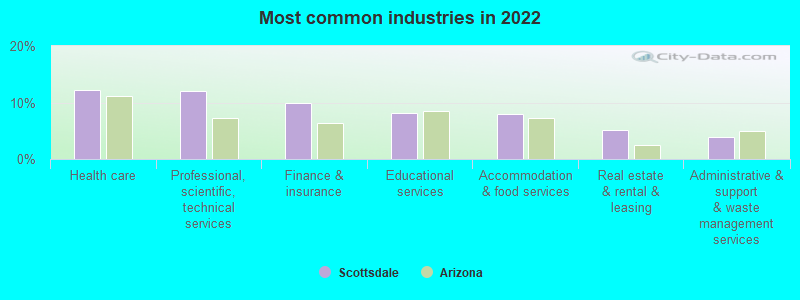
- Health care (12.3%)
- Professional, scientific, technical services (12.0%)
- Finance & insurance (9.9%)
- Educational services (8.1%)
- Accommodation & food services (8.1%)
- Real estate & rental & leasing (5.2%)
- Administrative & support & waste management services (4.0%)
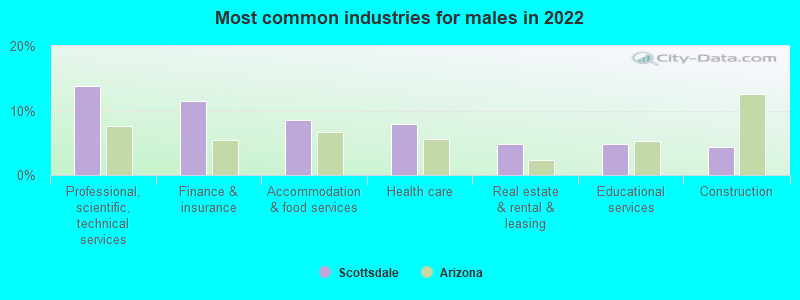
- Professional, scientific, technical services (13.8%)
- Finance & insurance (11.5%)
- Accommodation & food services (8.5%)
- Health care (7.9%)
- Real estate & rental & leasing (4.8%)
- Educational services (4.8%)
- Construction (4.3%)
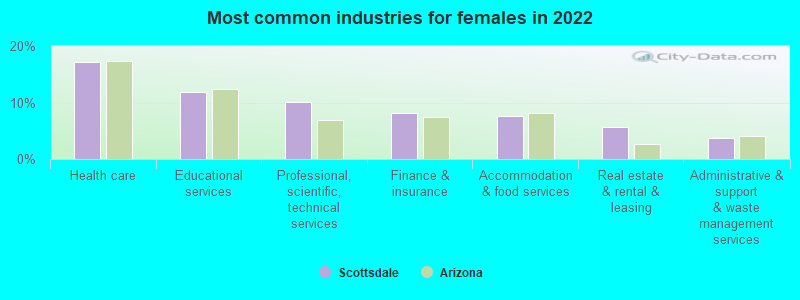
- Health care (17.1%)
- Educational services (11.8%)
- Professional, scientific, technical services (10.0%)
- Finance & insurance (8.1%)
- Accommodation & food services (7.5%)
- Real estate & rental & leasing (5.6%)
- Administrative & support & waste management services (3.8%)
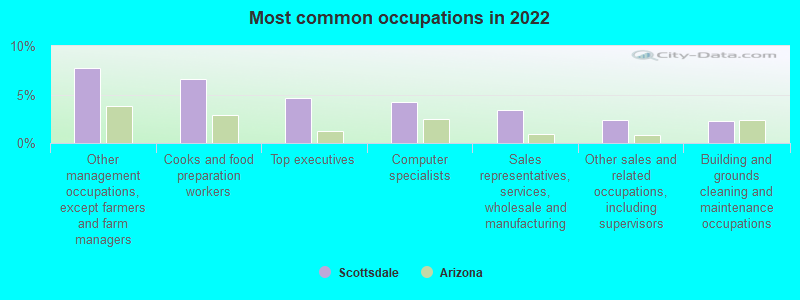
- Other management occupations, except farmers and farm managers (7.7%)
- Cooks and food preparation workers (6.6%)
- Top executives (4.7%)
- Computer specialists (4.3%)
- Sales representatives, services, wholesale and manufacturing (3.4%)
- Other sales and related occupations, including supervisors (2.4%)
- Building and grounds cleaning and maintenance occupations (2.3%)
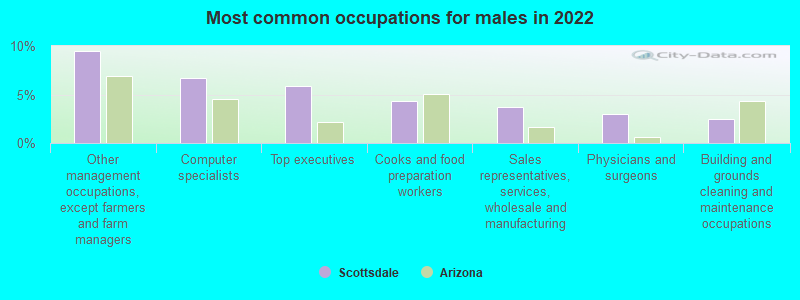
- Other management occupations, except farmers and farm managers (9.5%)
- Computer specialists (6.7%)
- Top executives (5.8%)
- Cooks and food preparation workers (4.3%)
- Sales representatives, services, wholesale and manufacturing (3.8%)
- Physicians and surgeons (3.0%)
- Building and grounds cleaning and maintenance occupations (2.5%)
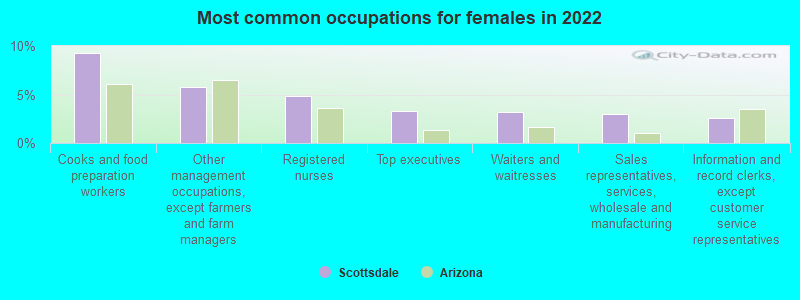
- Cooks and food preparation workers (9.2%)
- Other management occupations, except farmers and farm managers (5.7%)
- Registered nurses (4.9%)
- Top executives (3.3%)
- Waiters and waitresses (3.2%)
- Sales representatives, services, wholesale and manufacturing (3.0%)
- Information and record clerks, except customer service representatives (2.5%)
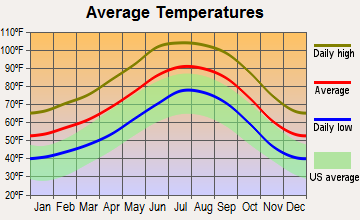
Average climate in Scottsdale, Arizona
Based on data reported by over 4,000 weather stations


|
|


(lower is better)
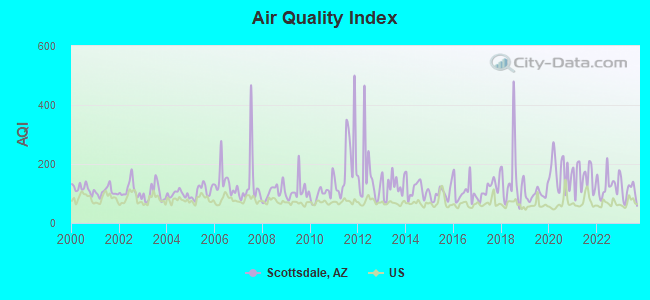
Air Quality Index (AQI) level in 2023 was 106. This is significantly worse than average.
| City: | 106 |
| U.S.: | 73 |
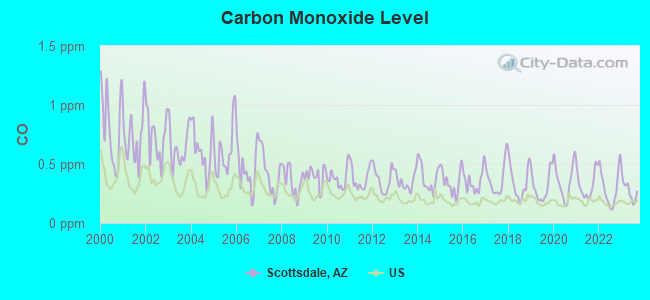
Carbon Monoxide (CO) [ppm] level in 2023 was 0.273. This is about average. Closest monitor was 2.1 miles away from the city center.
| City: | 0.273 |
| U.S.: | 0.251 |
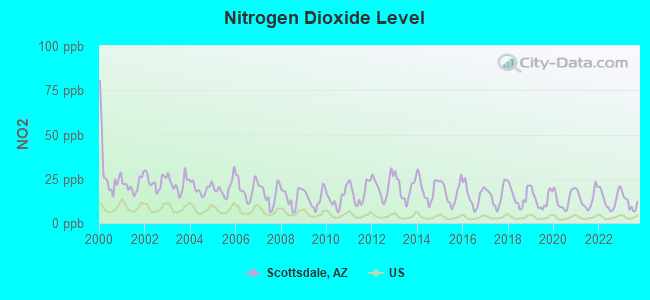
Nitrogen Dioxide (NO2) [ppb] level in 2023 was 11.2. This is significantly worse than average. Closest monitor was 7.3 miles away from the city center.
| City: | 11.2 |
| U.S.: | 5.1 |
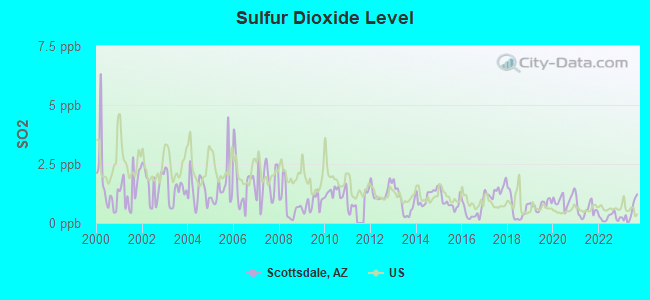
Sulfur Dioxide (SO2) [ppb] level in 2023 was 0.478. This is significantly better than average. Closest monitor was 7.8 miles away from the city center.
| City: | 0.478 |
| U.S.: | 1.515 |
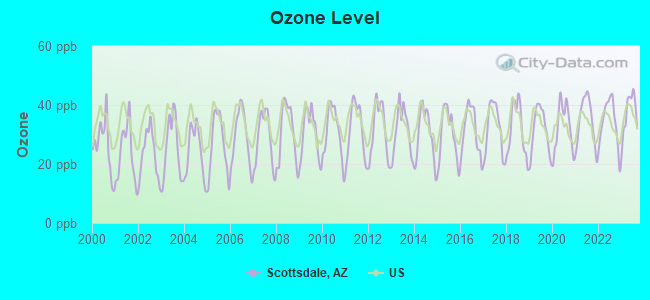
Ozone [ppb] level in 2023 was 37.2. This is about average. Closest monitor was 2.1 miles away from the city center.
| City: | 37.2 |
| U.S.: | 33.3 |
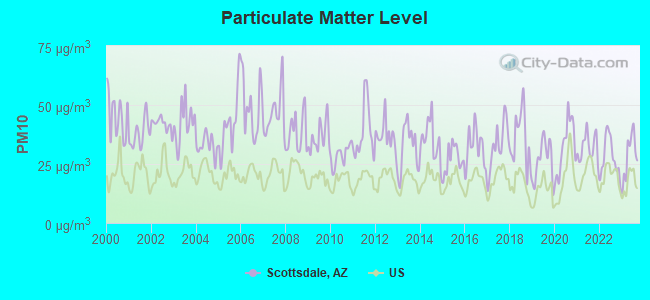
Particulate Matter (PM10) [µg/m3] level in 2023 was 28.4. This is significantly worse than average. Closest monitor was 2.1 miles away from the city center.
| City: | 28.4 |
| U.S.: | 19.2 |
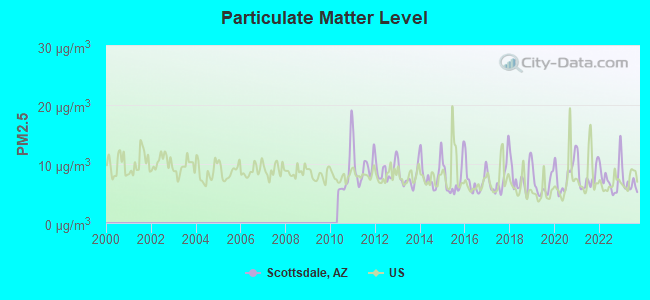
Particulate Matter (PM2.5) [µg/m3] level in 2023 was 6.59. This is better than average. Closest monitor was 7.5 miles away from the city center.
| City: | 6.59 |
| U.S.: | 8.11 |
Earthquake activity:
Scottsdale-area historical earthquake activity is significantly above Arizona state average. It is 2393% greater than the overall U.S. average.On 6/28/1992 at 11:57:34, a magnitude 7.6 (6.2 MB, 7.6 MS, 7.3 MW, Depth: 0.7 mi, Class: Major, Intensity: VIII - XII) earthquake occurred 269.3 miles away from Scottsdale center, causing 3 deaths (1 shaking deaths, 2 other deaths) and 400 injuries, causing $100,000,000 total damage and $40,000,000 insured losses
On 5/19/1940 at 04:36:40, a magnitude 7.2 (7.2 UK) earthquake occurred 220.9 miles away from Scottsdale center, causing $33,000,000 total damage
On 10/16/1999 at 09:46:44, a magnitude 7.4 (6.3 MB, 7.4 MS, 7.2 MW, 7.3 ML) earthquake occurred 267.8 miles away from the city center
On 12/31/1934 at 18:45:56, a magnitude 7.1 (7.1 UK) earthquake occurred 232.4 miles away from Scottsdale center
On 10/15/1979 at 23:16:54, a magnitude 7.0 (5.7 MB, 6.9 MS, 7.0 ML, 6.4 MW) earthquake occurred 223.2 miles away from the city center
On 7/21/1952 at 11:52:14, a magnitude 7.7 (7.7 UK) earthquake occurred 417.4 miles away from Scottsdale center, causing $50,000,000 total damage
Magnitude types: body-wave magnitude (MB), local magnitude (ML), surface-wave magnitude (MS), moment magnitude (MW)
Natural disasters:
The number of natural disasters in Maricopa County (16) is near the US average (15).Major Disasters (Presidential) Declared: 11
Emergencies Declared: 1
Causes of natural disasters: Floods: 10, Storms: 9, Fires: 3, Flash Flood: 1, Heavy Rain: 1, Hurricane: 1, Tornado: 1, Wind: 1, Other: 1 (Note: some incidents may be assigned to more than one category).

Main business address for: MOBILITY ELECTRONICS INC (COMPUTER PERIPHERAL EQUIPMENT, NEC), RURAL METRO CORP /DE/ (LOCAL & SUBURBAN TRANSIT & INTERURBAN HWY PASSENGER TRAINS), CAPITAL TITLE GROUP INC (TITLE INSURANCE), BFI ENERGY SYSTEMS OF BOSTON INC , M B A HOLDINGS INC (SERVICES-BUSINESS SERVICES, NEC), MEDICIS PHARMACEUTICAL CORP (PHARMACEUTICAL PREPARATIONS), GIANT INDUSTRIES INC (PETROLEUM REFINING), SPIRIT FINANCE CORP (REAL ESTATE INVESTMENT TRUSTS) and 10 other public companies.
Hospitals in Scottsdale:
- BARIX CLINICS OF ARIZONA (17500 N PERIMETER DRIVE)
- HEALTHSOUTH SURGERY CENTER SCOTTSDALE- CLOSE CHOW (9522 EAST SAN SALVADOR, SUITE 100 (CLOSED))
- SCOTTSDALE HEALTHCARE-OSBORN MEDICAL CENTER (Proprietary, 7400 EAST OSBORN ROAD)
- SCOTTSDALE HEALTHCARE-SHEA MEDICAL CENTER (Proprietary, 9003 EAST SHEA BOULEVARD)
- SCOTTSDALE HEALTHCARE-THOMPSON PEAK HOSPITAL (Proprietary, 7400 EAST THOMPSON PEAK PARKWAY)
- SCOTTSDALE HOSPICE OF VALLEY (5111 NORTH SCOTTSDALE ROAD, STE 108)
- SOJOURN CARE (7975 NORTH HAYDEN ROAD, SUITE A205)
- VISTACARE OF ARIZONA (4800 NORTH SCOTTSDALE ROAD, SUITE 3500)
Nursing Homes in Scottsdale:
- ADVANCED HEALTH CARE OF SCOTTSDALE (9846 NORTH 95TH STREET)
- AVALON CARE CENTER - SHADOW MOUNTAIN (11150 NORTH 92ND STREET)
- LIFE CARE CENTER OF SCOTTSDALE (9494 EAST BECKER LANE)
- PLAZA HEALTHCARE (1475 NORTH GRANITE REEF ROAD)
- PUEBLO NORTE SENIOR LIVING COMMUNITY (7100 EAST MESCAL STREET)
- SCOTTSDALE HERITAGE COURT (3339 NORTH DRINKWATER BOULEVARD)
- SCOTTSDALE NURSING AND REHAB CTR (3293 NORTH DRINKWATER BOULEVARD)
- SCOTTSDALE VILLAGE SQUARE (2620 NORTH 68TH STREET)
- VI AT GRAYHAWK, A VI AND PLAZA COMPANIES COMMUNITY (7501 EAST THOMPSON PEAK PARKWAY)
- VI AT SILVERSTONE, A VI AND PLAZA COMPANIES COMMUN (22605 NORTH 74TH STREET)
Dialysis Facilities in Scottsdale:
- CAMELBACK DIALYSIS (DVA) (7321 E OSBORN DR)
- DESERT MOUNTAIN DIALYSIS (DVA) (9220 E MOUNTAIN VIEW RD STE 105)
- NORTH SCOTTSDALE DIALYSIS (FMC) (16101 N 82ND ST STE 6-7)
- SALT RIVER DIALYSIS CENTER (FMC) (10301 E OSBORN RD BLDG 14)
- SCOTTSDALE DIALYSIS (FMC) (1495 N HAYDEN STE D1-D4)
- SCOTTSDALE DIALYSIS CENTER (DVA) (4725 N SCOTTSDALE RD STE 100)
Home Health Centers in Scottsdale:
- ALARYS HOME HEALTH, INC (4250 NORTH DRINKWATER BLVD SUITE 100)
- ASSISTED HEALTHCARE SERVICES (8165 EAST INDIAN BEND, # 101)
- ATLANTIC HOME HEALTH CARE LLC (10505 NORTH 69TH STREET, SUITE # 1300)
- DEPENDABLE NURSES OF PHOENIX (8687 EAST VIA DE VENTURA, SUITE 110)
- FOCUS HOME THERAPY AND MEDICAL SERVICES, LLC (10575 NORTH 114TH STREET, SUITE 101)
- LEGACY HOME HEALTHCARE MARICOPA (10619 NORTH HAYDEN ROAD, SUITE A-105)
- MAXIM HEALTHCARE SERVICES, INC (11000 NORTH SCOTTSDALE ROAD, SUITE 215)
- SCOTTSDALE HEALTHCARE HOME HEALTH (5111 NORTH SCOTTSDALE ROAD, SUITE 143)
- WATERMARK AT HOME (6240 EAST THOMAS ROAD, SUITE 203)
Airports and heliports located in Scottsdale:
- Scottsdale Airport (SDL) (Runways: 1, Air Taxi Ops: 14,818, Itinerant Ops: 93,100, Local Ops: 43,850, Military Ops: 800)
- Heliports: 6
Amtrak stations near Scottsdale:
- 13 miles: PHOENIX AIRPORT (PHOENIX, TERMINAL 2) - Bus Station . Services: enclosed waiting area, public restrooms, public payphones, full-service food facilities, paid short-term parking, paid long-term parking, car rental agency, taxi stand, intercity bus service, public transit connection.
- 13 miles: PHOENIX NORTHWEST (PHOENIX, 8101 BLACK CANYON FWY.) - Bus Station . Services: public payphones, call for taxi service.
- 15 miles: PHOENIX (401 W. HARRISON ST.) - Bus Station . Services: ticket office, enclosed waiting area, public restrooms, public payphones, vending machines, free short-term parking, paid long-term parking, taxi stand.
Colleges/Universities in Scottsdale:
- Scottsdale Community College (Full-time enrollment: 6,030; Location: 9000 E Chaparral Rd; Public; Website: www.scottsdalecc.edu)
- Arizona State University-Skysong (Full-time enrollment: 5,445; Location: 1475 N Scottsdale Road - Ste 315; Public; Website: www.asu.edu/; Offers Doctor's degree)
- Le Cordon Bleu College of Culinary Arts-Scottsdale (Full-time enrollment: 2,123; Location: 8100 E Camelback Rd, Suite 1001; Private, for-profit; Website: www.chefs.edu/scottsdale)
- Penrose Academy (Full-time enrollment: 252; Location: 13402 North Scottsdale Road; Suite B160; Private, for-profit; Website: www.penroseacademy.com)
- Arizona Culinary Institute (Full-time enrollment: 170; Location: 10585 N 114th St Ste 401; Private, for-profit; Website: www.azculinary.edu)
- Brillare Hairdressing Academy (Full-time enrollment: 151; Location: 15147 N. Scottsdale Road, Suite H-300; Private, for-profit; Website: www.brillare.com/)
- Cortiva Institute-Scottsdale (Full-time enrollment: 115; Location: 8010 East McDowell Road #214; Private, for-profit; Website: www.cortiva.com/)
- International School of Cosmetology-Toni & Guy Hairdressing Academy (Full-time enrollment: 93; Location: 8939 E Indian Bean Rd Ste B-2; Private, for-profit; Website: toniguy.com/academy/scottsdale_beauty_school/default.aspx)
- Frank Lloyd Wright School of Architecture (Full-time enrollment: 30; Location: Taliesin West; Private, not-for-profit; Website: www.taliesin.edu; Offers Master's degree)
- Classic Cooking Academy (Full-time enrollment: 7; Location: 10411 East McDowell Mtn Ranch Road; Private, not-for-profit; Website: www.ccacademy.edu)
Other colleges/universities with over 2000 students near Scottsdale:
- Paradise Valley Community College (about 8 miles; Phoenix, AZ; Full-time enrollment: 5,259)
- Anthem College-Phoenix (about 12 miles; Phoenix, AZ; FT enrollment: 3,081)
- GateWay Community College (about 12 miles; Phoenix, AZ; FT enrollment: 3,414)
- Arizona State University-Tempe (about 12 miles; Tempe, AZ; FT enrollment: 45,951)
- Argosy University-Phoenix Online Division (about 13 miles; Phoenix, AZ; FT enrollment: 8,840)
- Everest College-Phoenix (about 13 miles; Phoenix, AZ; FT enrollment: 2,008)
- Rio Salado College (about 14 miles; Tempe, AZ; FT enrollment: 14,894)
Private high schools in Scottsdale:
- NOTRE DAME PREPARATORY (Students: 887, Location: 9701 E BELL RD, Grades: 9-12)
- NEW WAY LEARNING ACADEMY (Students: 122, Location: 1300 N 77TH ST, Grades: 1-12)
- VILLE DE MARIE ACADEMY (Students: 63, Location: 6535 E OSBORN RD # 404, Grades: KG-12)
- DEVEREUX (Students: 52, Location: 6436 E SWEETWATER AVE, Grades: T1-12)
- BELLA VISTA PRIVATE SCHOOL (Students: 48, Location: 33016 N 60TH ST, Grades: KG-12)
- GATEWAY ACADEMY (Students: 33, Location: 9659 N HAYDEN RD, Grades: 2-12)
- HOWARD S GRAY EDUCATION PROGRAM (Students: 33, Location: 7575 E EARLL DR, Grades: 4-12)
- THE MARION BURTON SCHOOL (Students: 17, Location: 1200 NTH 77TH ST, Grades: 6-12)
- ARIZONA INTERNATIONAL ACADEMY (Students: 15, Location: 12430 N SCOTTSDALE RD, Grades: 4-9)
Public elementary/middle school in Scottsdale:
Biggest private elementary/middle schools in Scottsdale:
- POPE JOHN XXIII CATHOLIC SCHOOL COMMUNITY (Students: 636, Location: 16235 N 60TH ST, Grades: KG-8)
- RANCHO SOLANO PRIVATE SCHOOLS-GREENWAY CAMPUS (Students: 584, Location: 5656 E GREENWAY RD, Grades: PK-8)
- SHEPHERD OF THE DESERT LUTHERAN SCHOOL (Students: 516, Location: 9590 E SHEA BLVD, Grades: PK-8)
- OUR LADY OF PERPETUAL HELP SCHOOL (Students: 473, Location: 3801 N MILLER RD, Grades: KG-8)
- EL DORADO PRIVATE SCHOOL (Students: 248, Location: 20624 N 76TH ST, Grades: PK-8)
- INTERNATIONAL SCHOOL OF ARIZONA (Students: 215, Location: 9128 E SAN SALVADOR DR STE 100, Grades: PK-5)
- CAMELBACK DESERT SCHOOL (Students: 199, Location: 9606 E KALIL DR, Grades: PK-6)
- THUNDERBIRD CHRISTIAN ELEMENTARY SCHOOL (Students: 78, Location: 7440 E SUTTON DR, Grades: PK-8)
- SCOTTSDALE COUNTRY DAY SCHOOL (Students: 56, Location: 10460 N 56TH ST, Grades: PK-8)
- LEXIS PREPARATORY SCHOOL (Students: 39, Location: 12753 N SCOTTSDALE RD, Grades: KG-8)
Libraries in Scottsdale:
- SCOTTSDALE PUBLIC LIBRARY (Operating income: $11,322,777; Location: 3839 N. DRINKWATER BLVD.; 535,784 books; 51,000 e-books; 80,652 audio materials; 56,030 video materials; 25 local licensed databases; 1 state licensed databases; 23 other licensed databases; 829 print serial subscriptions)
- SALT RIVER TRIBAL LIBRARY (Operating income: $139,784; Location: 1880 N. LONGMORE; 21,897 books; 915 audio materials; 1,107 video materials; 39 state licensed databases; 36 print serial subscriptions; 4 electronic serial subscriptions)
User-submitted facts and corrections:
- Radio Station addition: 101.1FM KNRJ Phoenix,Glendale added by Phil
Points of interest:
Notable locations in Scottsdale: Browns Ranch (A), Water Users Yaqui Camp (B), Desert Mountain Golf Course (C), Carefree Ranch (D), Paradise Valley Substation (E), Indian River Plaza (F), Salt River Power Plant (G), Ironwood Golf Course (H), Scottsdale Country Club (I), Villa Monterey Golf Course (J), Continental Golf Course (K), Coronado Golf Course (L), McCormick Ranch Golf Course (M), Pinnacle Peak Country Club Golf Course (N), Scottsdale Country Club Golf Course (O), Heard Museum North (P), Arabian Library (Q), Miller Road Wastewater Treatment Plant (R), Scottsdale Museum of Contemporary Art (S), Scottsdale Public Library Palomino Branch (T). Display/hide their locations on the map
Shopping Centers: Camelback Mall (1), Camelview Plaza Shopping Center (2), East Gate Shopping Center (3), Frontiertown Plaza Shopping Center (4), Lincoln Plaza Shopping Center (5), Lincoln Village Shopping Center (6), Los Arcos Mall (7), Miller Plaza Shopping Center (8), Orange Tree Shopping Center (9). Display/hide their locations on the map
Main business address in Scottsdale include: MOBILITY ELECTRONICS INC (A), RURAL METRO CORP /DE/ (B), BFI ENERGY SYSTEMS OF BOSTON INC (C), M B A HOLDINGS INC (D), MEDICIS PHARMACEUTICAL CORP (E), GIANT INDUSTRIES INC (F), SPIRIT FINANCE CORP (G). Display/hide their locations on the map
Churches in Scottsdale include: Highlands Church (A), Grace Chapel (B), God's Grace Church (C), Glass and Garden Community Church (D), Freedom Center Christian Church (E), First Church of Christ Scientist (F), First Christian Church (G), First Baptist Church of Scottsdale (H), Desert Life Christian Church (I). Display/hide their locations on the map
Cemeteries: Paradise Memorial Gardens (1), Green Acres Memorial Park (2). Display/hide their locations on the map
Lakes and reservoirs: Marguerite Lake (A), Black Hill Tank (B), Bootlegger Tank (C), Dixie Mine (D), Rock Tank (E). Display/hide their locations on the map
Parks in Scottsdale include: Paradise Park (1), Vista del Camino Park (2), Chestnutt Park (3), Thomas Road Rest Stop (4), Shoshone Park (5), Scottsdale Stadium (6), Scottsdale Horsemens Park (7), Mountain View Park (8), Chaparral Park (9). Display/hide their locations on the map
Tourist attractions: Heard Museum - Shop & Bookstore (34505 North Scottsdale Road) (1), Scottsdale Historical Museum (Cultural Attractions- Events- & Facilities; 7333 East Scottsdale Mall) (2), Studio Alexander (Cultural Attractions- Events- & Facilities; 7510 East Thomas 127) (3), Smoca (Cultural Attractions- Events- & Facilities; 7380 East 2nd Street) (4), Scottsdale Center for the Arts - Box Office (Cultural Attractions- Events- & Facilities; 7380 East 2nd Street) (5), Southwest Wildlife Rehabilitatiucational Foundatin (Recreation Areas; 8711 East Pinnacle Peak Road) (6), Mystery Mansion Dinner Theatre (Amusement & Theme Parks; 4203 North Brown Avenue Suite F) (7), B G Hockey (Amusement & Theme Parks; 9375 East Bell Road) (8), Amf Frontier Lanes (Amusement & Theme Parks; 7300 East Thomas Road) (9). Display/hide their approximate locations on the map
Hotels: Hyatt Regency & Resorts - Hyatt Regency Scottsdale Resort (7500 East Doubletree Ranch Road) (1), Doubletree Paradise Valley (5401 N. Scottsdale Road) (2), Innsuites Hotel-Scottsdale (7707 East McDowell Road) (3), Hawthorn Suites - Scottsdale (7445 E Chaparral Rd) (4), Hilton Garden Inn Scottsdale North Perimeter Center (8550 East Princess Drive) (5), Hotel Waterfront Ivy (7445 East Chaparral Road) (6), Deseo (6902 East Greenway Parkway) (7), Holiday Inn Express Hotel & Suites (3131 North Scottsdale Road) (8), Four Seasons Freight SRVS (7418 East Helm Drive) (9). Display/hide their approximate locations on the map
Courts: Salt River Pima-Maricopa Community Tribal Office - Court (10005 East Osborn Road) (1), Scottsdale City - City Court (3700 North 75th Street) (2), Maricopa County Government - Justice Of The Peace- Northwest Phoenix Justice C (8230 East Butherus Drive) (3). Display/hide their approximate locations on the map
Birthplace of: Emma Stone - Television and film actress, Amanda Blumenherst - Professional golfer, Brian Bannister - Baseball player, Heather Morris - Actress, Lou Marson - Baseball player, Andrew Walter - Football player, Barry Goldwater, Jr. - Politician, Brady Corbet - Actor, Gabrielle Carteris - Television actor, Grey Ruegamer - Football player.
Drinking water stations with addresses in Scottsdale and their reported violations in the past:
JOHNSON UTILITIES (Address: 5230 E SHEA BLVD , Population served: 59,640, Groundwater):Past health violations:OATMAN WATER COMPANY (Address: 9184 N 81ST ST , Population served: 536, Groundwater):Past monitoring violations:
- MCL, Acute (TCR) - In AUG-2012, Contaminant: Coliform. Follow-up actions: St Formal NOV issued (OCT-09-2012), St Compliance achieved (2 times from NOV-05-2012 to APR-15-2013)
- MCL, Single Sample - Between JAN-2012 and DEC-2012, Contaminant: Nitrate. Follow-up actions: State No Longer Subject to Rule (DEC-28-2012)
- MCL, Monthly (TCR) - In NOV-2005, Contaminant: Coliform. Follow-up actions: St Compliance achieved (MAY-25-2007)
- Monitoring, Repeat Major (TCR) - In AUG-2012, Contaminant: Coliform (TCR). Follow-up actions: St Violation/Reminder Notice (OCT-04-2012), St Formal NOV issued (OCT-09-2012), St Compliance achieved (2 times from NOV-05-2012 to APR-15-2013)
- Monitoring, Repeat Major (TCR) - In NOV-2009, Contaminant: Coliform (TCR). Follow-up actions: St Violation/Reminder Notice (JAN-28-2010), St Compliance achieved (MAR-16-2011)
- Monitoring and Reporting (DBP) - Between OCT-2009 and DEC-2009, Contaminant: Chlorine. Follow-up actions: St Compliance achieved (APR-09-2010)
- Monitoring and Reporting (DBP) - Between JUL-2008 and SEP-2008, Contaminant: Chlorine. Follow-up actions: St Violation/Reminder Notice (OCT-20-2008), St Compliance achieved (JAN-14-2009)
- Monitoring and Reporting (DBP) - Between APR-2007 and JUN-2007, Contaminant: TTHM. Follow-up actions: St Compliance achieved (AUG-30-2007)
- 4 minor monitoring violations
- 131 regular monitoring violations
- 16 other older monitoring violations
Past monitoring violations:PARELLI INTL STUDY CENTER (Serves CO, Population served: 519, Groundwater):
- Follow-up Or Routine LCR Tap M/R - In OCT-01-2011, Contaminant: Lead and Copper Rule. Follow-up actions: St Compliance achieved (SEP-27-2012), St Formal NOV issued (MAR-27-2013), St Compliance achieved (JAN-31-2014)
- Follow-up Or Routine LCR Tap M/R - In OCT-01-2008, Contaminant: Lead and Copper Rule. Follow-up actions: St Violation/Reminder Notice (FEB-11-2009), St Compliance achieved (MAR-18-2009)
- Follow-up Or Routine LCR Tap M/R - In OCT-01-2005, Contaminant: Lead and Copper Rule. Follow-up actions: St Compliance achieved (MAR-18-2009)
- One routine major monitoring violation
- 4 minor monitoring violations
- 2 regular monitoring violations
Past health violations:GHR LANDOWNERS ASSN WATER COOP (Address: 11445 E VIA LINDA , Population served: 280, Groundwater):Past monitoring violations:
- MCL, Acute (TCR) - In JUN-2006, Contaminant: Coliform. Follow-up actions: St Public Notif requested (JUL-01-2006), St Boil Water Order (JUL-01-2006), St Violation/Reminder Notice (JUL-01-2006), St Public Notif received (JUL-13-2006), St Compliance achieved (2 times from JAN-11-2007 to APR-10-2008)
- 2 routine major monitoring violations
Past health violations:COUNTRY SQUIRE MOBILE HOME PK (Address: 6991 EAST CAMELBACK ROAD SUITE B-310 , Serves FL, Population served: 240, Groundwater):Past monitoring violations:
- MCL, Monthly (TCR) - In AUG-2012, Contaminant: Coliform. Follow-up actions: St Violation/Reminder Notice (OCT-04-2012), St Compliance achieved (OCT-23-2012)
- Monitoring and Reporting (DBP) - Between OCT-2013 and DEC-2013, Contaminant: Chlorine
- Follow-up Or Routine LCR Tap M/R - In OCT-01-2012, Contaminant: Lead and Copper Rule. Follow-up actions: St Formal NOV issued (MAR-22-2013), St Compliance achieved (2 times from DEC-02-2013 to JAN-10-2014)
- Monitoring and Reporting (DBP) - Between OCT-2012 and DEC-2012, Contaminant: Chlorine. Follow-up actions: St Violation/Reminder Notice (APR-02-2013), St Compliance achieved (DEC-04-2013)
- Monitoring and Reporting (DBP) - Between APR-2012 and JUN-2012, Contaminant: Chlorine. Follow-up actions: St Compliance achieved (MAR-04-2013)
- Monitoring and Reporting (DBP) - Between JAN-2012 and DEC-2012, Contaminant: TTHM. Follow-up actions: St Violation/Reminder Notice (APR-23-2013)
- 8 routine major monitoring violations
- One regular monitoring violation
- 16 other older monitoring violations
Past monitoring violations:RYE BAR AND STEAK HOUSE (Population served: 100, Groundwater):
- Follow-up Or Routine LCR Tap M/R - In JUN-01-2004, Contaminant: Lead and Copper Rule. Follow-up actions: St Compliance achieved (MAY-06-2014)
- One regular monitoring violation
Past health violations:LAUGHLIN RANCH WATER SYSTEM (Population served: 82, Groundwater):Past monitoring violations:
- MCL, Monthly (TCR) - In OCT-2011, Contaminant: Coliform. Follow-up actions: St Violation/Reminder Notice (DEC-06-2011), St Compliance achieved (JUN-29-2012)
- Monitoring, Repeat Major (TCR) - In OCT-2011, Contaminant: Coliform (TCR). Follow-up actions: St Violation/Reminder Notice (DEC-06-2011), St Compliance achieved (JUN-29-2012)
- Monitoring, Source Water (GWR) - In NOV-03-2010, Contaminant: E. COLI. Follow-up actions: St Compliance achieved (OCT-21-2011)
- Monitoring, Repeat Major (TCR) - In NOV-2009, Contaminant: Coliform (TCR). Follow-up actions: St Compliance achieved (JAN-13-2010)
- Monitoring, Repeat Major (TCR) - In JUN-2007, Contaminant: Coliform (TCR). Follow-up actions: St Compliance achieved (MAR-12-2009)
- 8 routine major monitoring violations
- 2 minor monitoring violations
- 3 regular monitoring violations
Past health violations:FOOTHILLS MHP (Address: 3002 N 61ST PL , Population served: 82, Groundwater):Past monitoring violations:
- MCL, Monthly (TCR) - In MAY-2013, Contaminant: Coliform. Follow-up actions: St Violation/Reminder Notice (JUL-09-2013), St Compliance achieved (SEP-12-2013)
- MCL, Monthly (TCR) - In MAY-2012, Contaminant: Coliform. Follow-up actions: St Violation/Reminder Notice (JUL-16-2012), St Compliance achieved (AUG-06-2012)
- MCL, Monthly (TCR) - In APR-2012, Contaminant: Coliform. Follow-up actions: St Violation/Reminder Notice (JUN-04-2012), St Compliance achieved (AUG-06-2012)
- MCL, Monthly (TCR) - In JUN-2011, Contaminant: Coliform. Follow-up actions: St Violation/Reminder Notice (AUG-05-2011), St Compliance achieved (AUG-12-2011)
- MCL, Monthly (TCR) - In MAY-2010, Contaminant: Coliform. Follow-up actions: St Violation/Reminder Notice (JUN-30-2010), St Compliance achieved (OCT-22-2010)
- MCL, Single Sample - Between JUL-2009 and SEP-2009, Contaminant: Arsenic. Follow-up actions: St Compliance achieved (OCT-29-2009)
- 4 other older health violations
- Monitoring, Repeat Major (TCR) - In MAY-2012, Contaminant: Coliform (TCR). Follow-up actions: St Violation/Reminder Notice (JUL-16-2012), St Compliance achieved (AUG-06-2012)
- Monitoring, Repeat Major (TCR) - In MAY-2010, Contaminant: Coliform (TCR). Follow-up actions: St Compliance achieved (JAN-31-2012)
- Initial Tap Sampling for Pb and Cu - In JUL-01-2008, Contaminant: Lead and Copper Rule. Follow-up actions: St Violation/Reminder Notice (2 times from OCT-06-2008 to FEB-11-2009), St Compliance achieved (MAR-25-2009)
- Monitoring, Repeat Major (TCR) - In JUN-2008, Contaminant: Coliform (TCR). Follow-up actions: St Compliance achieved (MAR-12-2009)
- 4 routine major monitoring violations
- One minor monitoring violation
- 3 regular monitoring violations
Past monitoring violations:
- Non-Acute MRDL - Between JUL-2005 and SEP-2005, Contaminant: Chlorine. Follow-up actions: St Compliance achieved (JUL-11-2012)
- Monitoring and Reporting (DBP) - Between JUL-2005 and SEP-2005, Contaminant: Chlorine. Follow-up actions: St Compliance achieved (MAR-23-2007)
- 2 routine major monitoring violations
Drinking water stations with addresses in Scottsdale that have no violations reported:
- RIVERLAND RESORT (Serves CA, Population served: 1,000, Primary Water Source Type: Groundwater)
- X PLICIT SHOW CLUB (Address: 11454 E TROON VISTA DR , Population served: 100, Primary Water Source Type: Groundwater)
- ALEXANDER MOBILE HOME PARK (Serves ND, Population served: 48, Primary Water Source Type: Purch groundwater)
| This city: | 2.1 people |
| Arizona: | 2.6 people |
| This city: | 56.5% |
| Whole state: | 66.2% |
| This city: | 6.1% |
| Whole state: | 7.8% |
Likely homosexual households (counted as self-reported same-sex unmarried-partner households)
- Lesbian couples: 0.3% of all households
- Gay men: 0.5% of all households
People in group quarters in Scottsdale in 2010:
- 622 people in nursing facilities/skilled-nursing facilities
- 205 people in group homes intended for adults
- 153 people in workers' group living quarters and job corps centers
- 52 people in college/university student housing
- 46 people in other noninstitutional facilities
- 24 people in residential treatment centers for juveniles (non-correctional)
- 19 people in group homes for juveniles (non-correctional)
- 19 people in mental (psychiatric) hospitals and psychiatric units in other hospitals
- 17 people in residential treatment centers for adults
- 2 people in correctional residential facilities
People in group quarters in Scottsdale in 2000:
- 653 people in other noninstitutional group quarters
- 485 people in other group homes
- 409 people in nursing homes
- 33 people in other types of correctional institutions
- 23 people in college dormitories (includes college quarters off campus)
- 16 people in mental (psychiatric) hospitals or wards
- 16 people in homes for the mentally retarded
- 16 people in religious group quarters
- 12 people in unknown juvenile institutions
- 9 people in hospitals/wards and hospices for chronically ill
- 9 people in hospices or homes for chronically ill
- 5 people in homes for the mentally ill
Banks with most branches in Scottsdale (2011 data):
- JPMorgan Chase Bank, National Association: 26 branches. Info updated 2011/11/10: Bank assets: $1,811,678.0 mil, Deposits: $1,190,738.0 mil, headquarters in Columbus, OH, positive income, International Specialization, 5577 total offices, Holding Company: Jpmorgan Chase & Co.
- Wells Fargo Bank, National Association: 25 branches. Info updated 2011/04/05: Bank assets: $1,161,490.0 mil, Deposits: $905,653.0 mil, headquarters in Sioux Falls, SD, positive income, 6395 total offices, Holding Company: Wells Fargo & Company
- Bank of America, National Association: 13 branches. Info updated 2009/11/18: Bank assets: $1,451,969.3 mil, Deposits: $1,077,176.8 mil, headquarters in Charlotte, NC, positive income, 5782 total offices, Holding Company: Bank Of America Corporation
- BMO Harris Bank National Association: 7 branches. Info updated 2011/07/14: Bank assets: $97,264.0 mil, Deposits: $75,624.6 mil, headquarters in Chicago, IL, positive income, 717 total offices, Holding Company: Bank Of Montreal
- U.S. Bank National Association: East Greenway Parkway Safeway Branch, Old Town Scottsdale Branch, North Scottsdale Road Safeway Branch, Scottsdale Branch, North Pima Road Safeway Branch. Info updated 2012/01/30: Bank assets: $330,470.8 mil, Deposits: $236,091.5 mil, headquarters in Cincinnati, OH, positive income, 3121 total offices, Holding Company: U.S. Bancorp
- Compass Bank: Pinnacle Peak Branch, Scottsdale Stadium Branch, Scottsdale & Thunderbird Branch, Via Linda/Flw Kbc Branch, Gainey Ranch Branch. Info updated 2011/02/24: Bank assets: $63,107.0 mil, Deposits: $46,232.4 mil, headquarters in Birmingham, AL, negative income in the last year, Commercial Lending Specialization, 720 total offices, Holding Company: Banco Bilbao Vizcaya Argentaria, S.A.
- National Bank of Arizona: Silverstone Branch, North Scottsdale Branch, Gainey Ranch Branch, Thompson Peak Branch. Info updated 2008/09/11: Bank assets: $4,485.6 mil, Deposits: $3,731.3 mil, headquarters in Tucson, AZ, positive income, Commercial Lending Specialization, 73 total offices, Holding Company: Zions Bancorporation
- Comerica Bank: Scottsdale-Greenway Branch, Scottsdale - Riverwalk Branch, Scottsdale-Shea Branch, Scottsdale-Mcdowell Banking Center. Info updated 2011/07/29: Bank assets: $60,970.5 mil, Deposits: $48,300.9 mil, headquarters in Dallas, TX, positive income, Commercial Lending Specialization, 497 total offices, Holding Company: Comerica Incorporated
- Enterprise Bank & Trust: Airpark Branch, North Scottsdale Office, Scottsdale Branch. Info updated 2011/11/08:, headquarters in Clayton, MO, 21 total offices
- 33 other banks with 46 local branches
For population 15 years and over in Scottsdale:
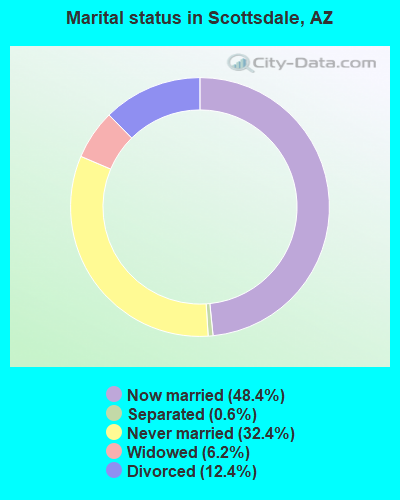
- Never married: 32.4%
- Now married: 48.4%
- Separated: 0.6%
- Widowed: 6.2%
- Divorced: 12.4%
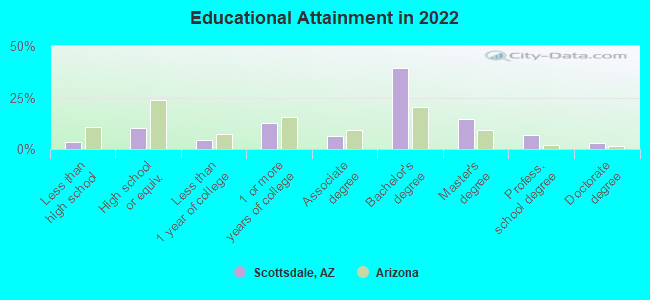
For population 25 years and over in Scottsdale:
- High school or higher: 96.7%
- Bachelor's degree or higher: 63.7%
- Graduate or professional degree: 24.2%
- Unemployed: 3.5%
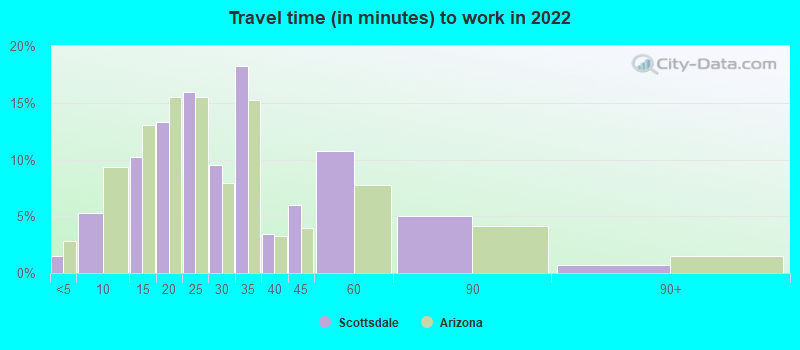
- Mean travel time to work (commute): 14.8 minutes
| Here: | 9.6 |
| Arizona average: | 12.2 |
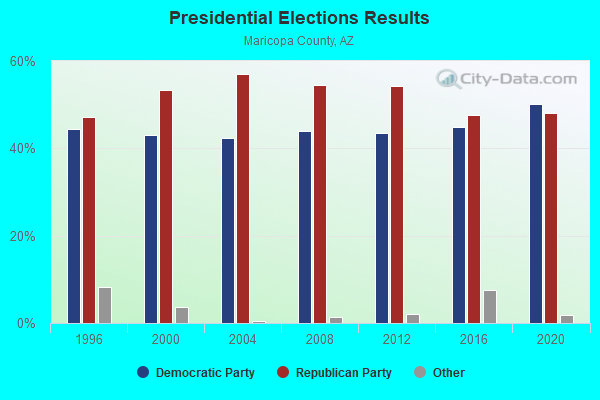
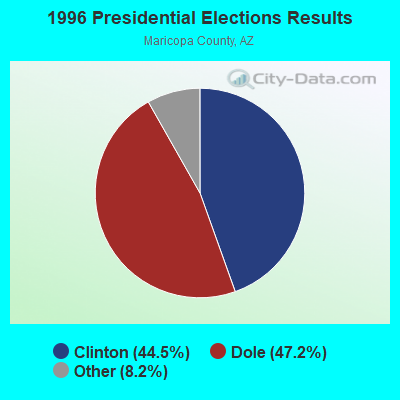
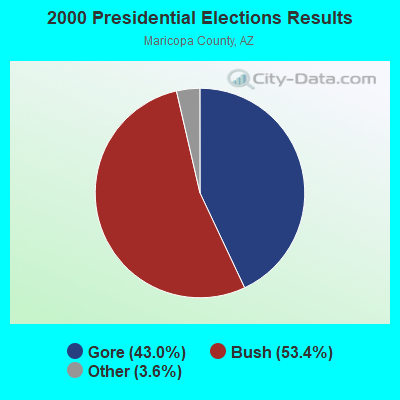
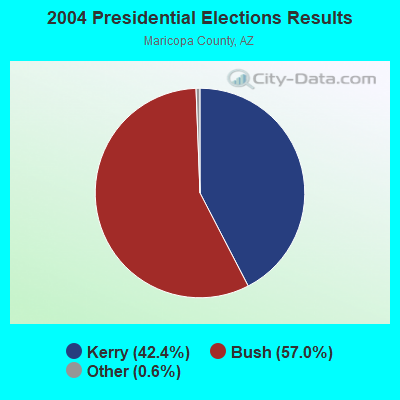
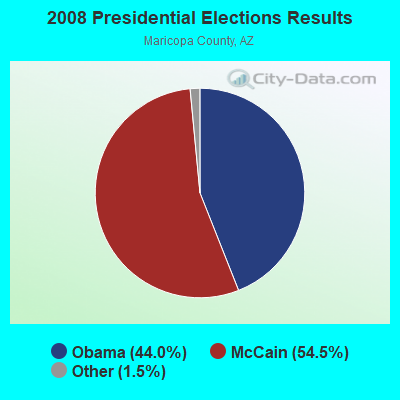
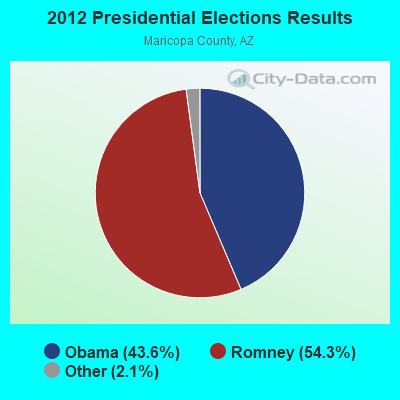
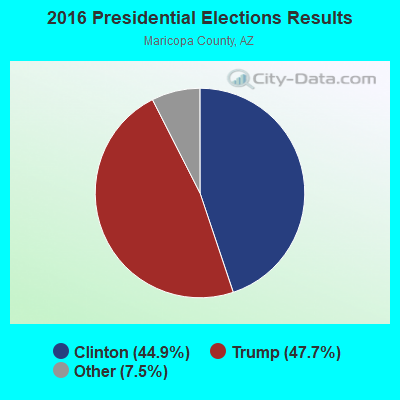
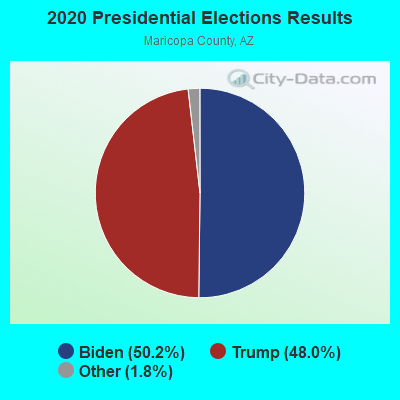
Graphs represent county-level data. Detailed 2008 Election Results
Neighborhoods in Scottsdale:
(Scottsdale, Arizona Neighborhood Map)- Airpark neighborhood
- Boulders neighborhood
- Cactus Corridor neighborhood
- DC Ranch neighborhood
- Desert Foothills neighborhood
- Desert Mountain neighborhood
- Downtown neighborhood
- Dynamite Foothills neighborhood
- East Shea neighborhood
- Granite Mountain neighborhood
- Grayhawk neighborhood
- Horizons neighborhood
- Indian Bend neighborhood
- Legend Trail neighborhood
- McCormick Ranch neighborhood
- McDowell Mountain Preserve neighborhood
- McDowell Mountain Ranch neighborhood
- Monterey Arcadia neighborhood
- Pinnacle Peak Vista neighborhood
- Reatta Pass (Troon) neighborhood
- Resort Corridor neighborhood
- Sonoran Regional Core neighborhood
- Via Linda Corridor neighborhood
- West Cactus neighborhood
Religion statistics for Scottsdale, AZ (based on Maricopa County data)
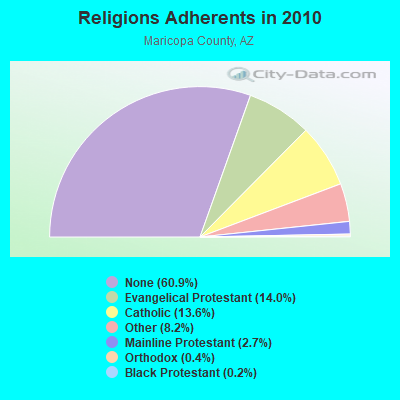
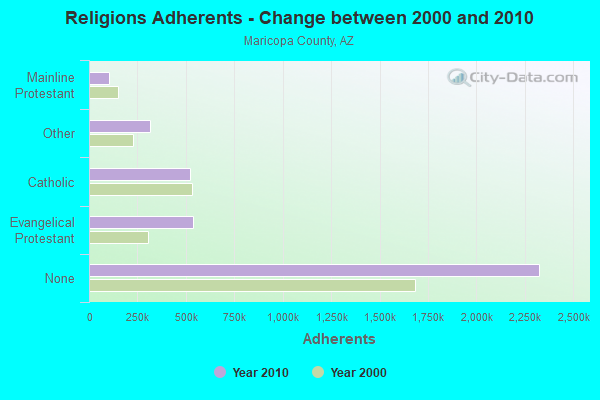
| Religion | Adherents | Congregations |
|---|---|---|
| Evangelical Protestant | 534,453 | 1,206 |
| Catholic | 520,651 | 100 |
| Other | 312,574 | 680 |
| Mainline Protestant | 104,145 | 241 |
| Orthodox | 13,379 | 24 |
| Black Protestant | 6,278 | 48 |
| None | 2,325,637 | - |
Food Environment Statistics:
| Here: | 1.30 / 10,000 pop. |
| State: | 1.36 / 10,000 pop. |
| Maricopa County: | 0.16 / 10,000 pop. |
| Arizona: | 0.14 / 10,000 pop. |
| This county: | 0.57 / 10,000 pop. |
| Arizona: | 0.55 / 10,000 pop. |
| Maricopa County: | 1.99 / 10,000 pop. |
| Arizona: | 2.47 / 10,000 pop. |
| Maricopa County: | 5.86 / 10,000 pop. |
| State: | 6.21 / 10,000 pop. |
| Maricopa County: | 7.7% |
| Arizona: | 8.0% |
| Maricopa County: | 22.5% |
| Arizona: | 22.8% |
| This county: | 14.8% |
| Arizona: | 14.2% |
Health and Nutrition:
| This city: | 54.8% |
| State: | 49.0% |
| This city: | 54.4% |
| Arizona: | 47.3% |
| This city: | 28.1 |
| Arizona: | 28.5 |
| This city: | 18.9% |
| Arizona: | 20.8% |
| Scottsdale: | 8.3% |
| State: | 10.2% |
| Here: | 6.9 |
| State: | 6.8 |
| Scottsdale: | 34.3% |
| Arizona: | 33.5% |
| Scottsdale: | 61.1% |
| Arizona: | 56.1% |
| This city: | 79.9% |
| Arizona: | 79.4% |
More about Health and Nutrition of Scottsdale, AZ Residents
| Local government employment and payroll (March 2022) | |||||
| Function | Full-time employees | Monthly full-time payroll | Average yearly full-time wage | Part-time employees | Monthly part-time payroll |
|---|---|---|---|---|---|
| Police Protection - Officers | 444 | $3,832,906 | $103,592 | 4 | $9,103 |
| Firefighters | 293 | $2,488,483 | $101,917 | 0 | $0 |
| Other Government Administration | 273 | $2,115,002 | $92,967 | 13 | $30,542 |
| Police - Other | 153 | $1,041,328 | $81,673 | 5 | $11,689 |
| Water Supply | 148 | $1,033,438 | $83,792 | 0 | $0 |
| Other and Unallocable | 126 | $818,236 | $77,927 | 0 | $0 |
| Parks and Recreation | 121 | $614,048 | $60,897 | 256 | $260,398 |
| Judicial and Legal | 118 | $878,671 | $89,356 | 12 | $17,668 |
| Financial Administration | 102 | $689,549 | $81,123 | 5 | $19,479 |
| Solid Waste Management | 87 | $442,751 | $61,069 | 0 | $0 |
| Streets and Highways | 85 | $578,803 | $81,713 | 2 | $6,420 |
| Local Libraries | 62 | $330,732 | $64,013 | 58 | $125,300 |
| Sewerage | 51 | $375,851 | $88,436 | 0 | $0 |
| Welfare | 39 | $212,899 | $65,507 | 17 | $38,010 |
| Correction | 31 | $190,486 | $73,737 | 0 | $0 |
| Airports | 15 | $98,283 | $78,626 | 0 | $0 |
| Fire - Other | 11 | $117,063 | $127,705 | 0 | $0 |
| Totals for Government | 2,159 | $15,858,528 | $88,144 | 372 | $518,609 |
Scottsdale government finances - Expenditure in 2021 (per resident):
- Construction - Water Utilities: $39,845,000 ($163.94)
General - Other: $29,476,000 ($121.28)
Parks and Recreation: $25,800,000 ($106.15)
Sewerage: $16,472,000 ($67.77)
Regular Highways: $10,755,000 ($44.25)
Air Transportation: $7,042,000 ($28.97)
Local Fire Protection: $3,988,000 ($16.41)
Solid Waste Management: $399,000 ($1.64)
Police Protection: $398,000 ($1.64)
- Current Operations - General - Other: $106,084,000 ($436.47)
Police Protection: $102,371,000 ($421.19)
Water Utilities: $61,112,000 ($251.44)
Local Fire Protection: $45,177,000 ($185.88)
Sewerage: $33,591,000 ($138.21)
Parks and Recreation: $32,524,000 ($133.82)
Solid Waste Management: $21,846,000 ($89.88)
Regular Highways: $18,314,000 ($75.35)
Judicial and Legal Services: $12,788,000 ($52.61)
Financial Administration: $9,358,000 ($38.50)
Housing and Community Development: $8,343,000 ($34.33)
Central Staff Services: $6,617,000 ($27.22)
Libraries: $6,401,000 ($26.34)
Air Transportation: $3,651,000 ($15.02)
Transit Utilities: $1,947,000 ($8.01)
Protective Inspection and Regulation - Other: $1,390,000 ($5.72)
- General - Interest on Debt: $31,534,000 ($129.74)
- Other Capital Outlay - Police Protection: $3,976,000 ($16.36)
Water Utilities: $3,044,000 ($12.52)
Local Fire Protection: $2,230,000 ($9.18)
Sewerage: $997,000 ($4.10)
Parks and Recreation: $577,000 ($2.37)
Solid Waste Management: $331,000 ($1.36)
Regular Highways: $174,000 ($0.72)
Libraries: $84,000 ($0.35)
Financial Administration: $60,000 ($0.25)
Housing and Community Development: $49,000 ($0.20)
Transit Utilities: $18,000 ($0.07)
Central Staff Services: $18,000 ($0.07)
Air Transportation: $12,000 ($0.05)
Protective Inspection and Regulation - Other: $3,000 ($0.01)
Judicial and Legal Services: $3,000 ($0.01)
- Total Salaries and Wages: $180,966,000 ($744.56)
Scottsdale government finances - Revenue in 2021 (per resident):
- Charges - Sewerage: $54,152,000 ($222.80)
Solid Waste Management: $25,532,000 ($105.05)
Other: $13,206,000 ($54.33)
Parks and Recreation: $12,063,000 ($49.63)
Air Transportation: $7,519,000 ($30.94)
- Federal Intergovernmental - Housing and Community Development: $8,254,000 ($33.96)
Air Transportation: $954,000 ($3.93)
Other: $865,000 ($3.56)
- Local Intergovernmental - Other: $2,428,000 ($9.99)
- Miscellaneous - Interest Earnings: $10,538,000 ($43.36)
Fines and Forfeits: $7,816,000 ($32.16)
Rents: $7,558,000 ($31.10)
Donations From Private Sources: $4,398,000 ($18.10)
- Revenue - Water Utilities: $106,778,000 ($439.33)
- State Intergovernmental - General Local Government Support: $80,068,000 ($329.43)
Other: $24,329,000 ($100.10)
Highways: $18,535,000 ($76.26)
Housing and Community Development: $604,000 ($2.49)
- Tax - General Sales and Gross Receipts: $236,038,000 ($971.15)
Property: $71,655,000 ($294.82)
Other License: $21,106,000 ($86.84)
Other Selective Sales: $18,013,000 ($74.11)
Public Utilities Sales: $12,873,000 ($52.96)
Occupation and Business License - Other: $1,708,000 ($7.03)
Scottsdale government finances - Debt in 2021 (per resident):
- Long Term Debt - Beginning Outstanding - Unspecified Public Purpose: $1,007,542,000 ($4145.41)
Outstanding Unspecified Public Purpose: $982,805,000 ($4043.63)
Retired Unspecified Public Purpose: $399,269,000 ($1642.74)
Issue, Unspecified Public Purpose: $374,532,000 ($1540.97)
Scottsdale government finances - Cash and Securities in 2021 (per resident):
- Bond Funds - Cash and Securities: $34,666,000 ($142.63)
- Other Funds - Cash and Securities: $878,656,000 ($3615.12)
5.80% of this county's 2021 resident taxpayers lived in other counties in 2020 ($92,013 average adjusted gross income)
| Here: | 5.80% |
| Arizona average: | 6.85% |
0.02% of residents moved from foreign countries ($227 average AGI)
Maricopa County: 0.02% Arizona average: 0.03%
Top counties from which taxpayers relocated into this county between 2020 and 2021:
| from Pinal County, AZ | |
| from Los Angeles County, CA | |
| from Pima County, AZ |
5.04% of this county's 2020 resident taxpayers moved to other counties in 2021 ($76,911 average adjusted gross income)
| Here: | 5.04% |
| Arizona average: | 5.72% |
0.02% of residents moved to foreign countries ($234 average AGI)
Maricopa County: 0.02% Arizona average: 0.03%
Top counties to which taxpayers relocated from this county between 2020 and 2021:
| to Pinal County, AZ | |
| to Pima County, AZ | |
| to Yavapai County, AZ |
| Businesses in Scottsdale, AZ | ||||
| Name | Count | Name | Count | |
|---|---|---|---|---|
| 24 Hour Fitness | 2 | Jimmy John's | 3 | |
| 7-Eleven | 3 | JoS. A. Bank | 1 | |
| 99 Cents Only Stores | 1 | Johnny Rockets | 1 | |
| ALDO | 1 | Jones New York | 5 | |
| AMF Bowling | 1 | Journeys | 1 | |
| AT&T | 5 | Juicy Couture | 2 | |
| Abercrombie & Fitch | 1 | Justice | 1 | |
| Abercrombie Kids | 1 | KFC | 1 | |
| Ace Hardware | 6 | Kincaid | 1 | |
| Aeropostale | 1 | Kohl's | 1 | |
| Albertsons | 5 | Kroger | 9 | |
| American Eagle Outfitters | 1 | LA Fitness | 2 | |
| Ann Taylor | 3 | La Quinta | 1 | |
| Apple Store | 1 | La-Z-Boy | 1 | |
| Applebee's | 1 | Lane Furniture | 1 | |
| Arby's | 5 | LensCrafters | 3 | |
| Ashley Furniture | 1 | Little Caesars Pizza | 1 | |
| AutoZone | 2 | Lowe's | 2 | |
| Avenue | 1 | Macy's | 1 | |
| Baja Fresh Mexican Grill | 3 | Marriott | 10 | |
| Banana Republic | 1 | Marshalls | 1 | |
| Barnes & Noble | 2 | MasterBrand Cabinets | 23 | |
| Baskin-Robbins | 1 | McDonald's | 11 | |
| Bath & Body Works | 3 | Men's Wearhouse | 2 | |
| Bebe | 2 | Motel 6 | 1 | |
| Ben & Jerry's | 1 | Motherhood Maternity | 1 | |
| Best Western | 2 | New Balance | 11 | |
| Big O Tires | 1 | Nike | 21 | |
| Blockbuster | 8 | Nissan | 1 | |
| Brookstone | 1 | Nordstrom | 2 | |
| Brunswick Bowling & Billiards | 1 | OfficeMax | 4 | |
| Budget Car Rental | 1 | Old Navy | 1 | |
| Burger King | 4 | Olive Garden | 2 | |
| Buybuy BABY | 1 | Pac Sun | 1 | |
| CVS | 8 | Panda Express | 4 | |
| Cache | 2 | Papa John's Pizza | 2 | |
| Carl\s Jr. | 2 | Payless | 1 | |
| Charlotte Russe | 1 | Penske | 3 | |
| Chevrolet | 1 | PetSmart | 4 | |
| Chick-Fil-A | 1 | Pier 1 Imports | 2 | |
| Chico's | 3 | Pizza Hut | 5 | |
| Chipotle | 5 | Plato's Closet | 1 | |
| Church's Chicken | 1 | Pottery Barn | 1 | |
| Circle K | 19 | Pottery Barn Kids | 1 | |
| Clarion | 1 | Quiznos | 4 | |
| Clarks | 1 | RadioShack | 3 | |
| Cold Stone Creamery | 4 | Red Lobster | 2 | |
| Coldwater Creek | 1 | Red Robin | 1 | |
| Comfort Suites | 1 | SAS Shoes | 1 | |
| Costco | 1 | SONIC Drive-In | 1 | |
| Crate & Barrel | 2 | Safeway | 9 | |
| Cricket Wireless | 4 | Sam's Club | 1 | |
| Curves | 4 | Sears | 2 | |
| Dairy Queen | 3 | Sephora | 1 | |
| Days Inn | 1 | Sheraton | 1 | |
| Decora Cabinetry | 8 | Skechers USA | 1 | |
| Dennys | 4 | Sleep Inn | 1 | |
| Discount Tire | 5 | Soma Intimates | 1 | |
| Domino's Pizza | 4 | Sprint Nextel | 1 | |
| Dunkin Donuts | 4 | Staples | 2 | |
| Eddie Bauer | 1 | Starbucks | 27 | |
| Express | 2 | Subaru | 1 | |
| Extended Stay America | 1 | Subway | 16 | |
| Extended Stay Deluxe | 1 | T-Mobile | 9 | |
| Famous Footwear | 2 | T.J.Maxx | 2 | |
| FedEx | 51 | Taco Bell | 6 | |
| Firestone Complete Auto Care | 2 | Talbots | 2 | |
| Foot Locker | 1 | Target | 3 | |
| Ford | 2 | The Cheesecake Factory | 1 | |
| Forever 21 | 1 | The Limited | 1 | |
| GNC | 3 | The Room Place | 2 | |
| GameStop | 3 | Toyota | 1 | |
| Gap | 1 | Toys"R"Us | 2 | |
| Gymboree | 1 | Trader Joe's | 2 | |
| H&M | 2 | Travelodge | 1 | |
| H&R Block | 7 | U-Haul | 5 | |
| Haagen-Dazs | 1 | UPS | 57 | |
| Haworth | 1 | Urban Outfitters | 1 | |
| Hilton | 7 | Vans | 4 | |
| Hobby Lobby | 1 | Verizon Wireless | 4 | |
| Holiday Inn | 4 | Victoria's Secret | 2 | |
| Hollister Co. | 1 | Village Inn | 2 | |
| Home Depot | 3 | Volkswagen | 1 | |
| HomeTown Buffet | 1 | Vons | 9 | |
| Homestead Studio Suites | 1 | Walgreens | 8 | |
| Honda | 1 | Walmart | 2 | |
| Hot Topic | 1 | Wendy's | 4 | |
| IHOP | 2 | Westin | 2 | |
| J. Jill | 2 | Wet Seal | 1 | |
| J.Crew | 2 | Whole Foods Market | 1 | |
| Jack In The Box | 6 | YMCA | 2 | |
| Jamba Juice | 3 | Z Gallerie | 2 | |
Strongest AM radio stations in Scottsdale:
- KMIK (1580 AM; 50 kW; TEMPE, AZ; Owner: ABC, INC.)
- KFNX (1100 AM; 50 kW; CAVE CREEK, AZ; Owner: NORTH AMERICAN BROADCASTING CO., INC.)
- KFNN (1510 AM; 22 kW; MESA, AZ; Owner: CRC BROADCASTING COMPANY, INC.)
- KPXQ (1360 AM; 50 kW; GLENDALE, AZ; Owner: COMMON GROUND BROADCASTING, INC.)
- KTAR (620 AM; 5 kW; PHOENIX, AZ; Owner: EMMIS RADIO LICENSE CORPORATION)
- KKNT (960 AM; 5 kW; PHOENIX, AZ; Owner: COMMON GROUND BROADCASTING, INC)
- KAZG (1440 AM; 5 kW; SCOTTSDALE, AZ; Owner: CACTUS RADIO, INC.)
- KMIA (710 AM; 50 kW; BLACK CANYON CITY, AZ; Owner: ENTRAVISION HOLDINGS, LLC)
- KFYI (550 AM; 5 kW; PHOENIX, AZ; Owner: AMFM RADIO LICENSES, L.L.C.)
- KXEM (1010 AM; 15 kW; TOLLESON, AZ; Owner: JAMES CRYSTAL ENTERPRISES OF PHOENIX, INC.)
- KXAM (1310 AM; 5 kW; MESA, AZ; Owner: EMBEE BROADCASTING, INC.)
- KGME (910 AM; 5 kW; PHOENIX, AZ; Owner: AMFM RADIO LICENSES, L.L.C.)
- KASA (1540 AM; 10 kW; PHOENIX, AZ; Owner: KASA RADIO HOGAR, INC.)
Strongest FM radio stations in Scottsdale:
- KHOT-FM (105.9 FM; PARADISE VALLEY, AZ; Owner: HBC LICENSE CORPORATION)
- KMLE (107.9 FM; CHANDLER, AZ; Owner: INFINITY RADIO OPERATIONS INC.)
- KNAI (88.3 FM; PHOENIX, AZ; Owner: NATIONAL FARM WORKERS SERVICE CENTER)
- K205CI (88.9 FM; PHOENIX, AZ; Owner: FAMILY STATIONS, INC.)
- K248AL (97.5 FM; PHOENIX, AZ; Owner: ZORBA RESOURCES, INC.)
- KSLX-FM (100.7 FM; SCOTTSDALE, AZ; Owner: CACTUS RADIO, INC.)
- KKLT (98.7 FM; PHOENIX, AZ; Owner: EMMIS RADIO LICENSE CORPORATION)
- KZON (101.5 FM; PHOENIX, AZ; Owner: INFINITY RADIO OPERATIONS INC.)
- KKFR (92.3 FM; GLENDALE, AZ; Owner: EMMIS RADIO LICENSE CORPORATION)
- KESZ (99.9 FM; PHOENIX, AZ; Owner: CLEAR CHANNEL BROADCASTING LICENSES, INC.)
- KOOL-FM (94.5 FM; PHOENIX, AZ; Owner: INFINITY RADIO OPERATIONS INC.)
- KPHF (88.3 FM; PHOENIX, AZ; Owner: FAMILY STATIONS, INC.)
- KNIX-FM (102.5 FM; PHOENIX, AZ; Owner: CLEAR CHANNEL BROADCASTING LICENSES, INC.)
- KUPD (97.9 FM; TEMPE, AZ; Owner: TEMPE RADIO, INC.)
- KFLR-FM (90.3 FM; PHOENIX, AZ; Owner: FAMILY LIFE BROADCASTING, INC.)
- KJZZ (91.5 FM; PHOENIX, AZ; Owner: MARICOPA COUNTY COMM. COLLEGE DIST.)
- KYOT-FM (95.5 FM; PHOENIX, AZ; Owner: AMFM RADIO LICENSES, L.L.C.)
- KMXP (96.9 FM; PHOENIX, AZ; Owner: CITICASTERS LICENSES, L.P.)
- KZZP (104.7 FM; MESA, AZ; Owner: CITICASTERS LICENSES, L.P.)
- KDKB (93.3 FM; MESA, AZ; Owner: MESA RADIO, INC.)
TV broadcast stations around Scottsdale:
- KAET (Channel 8; PHOENIX, AZ; Owner: ARIZONA BOARD OF REGENTS)
- K23BY (Channel 23; SCOTTSDALE, AZ; Owner: KAZT, L.L.C.)
- K55EH (Channel 55; PHOENIX, AZ; Owner: KAZT, L.L.C.)
- KPHO-TV (Channel 5; PHOENIX, AZ; Owner: MEREDITH CORPORATION)
- KTVK (Channel 3; PHOENIX, AZ; Owner: KTVK, INC.)
- KPPX (Channel 51; TOLLESON, AZ; Owner: AMERICA 51, L.P.)
- KUTP (Channel 45; PHOENIX, AZ; Owner: FOX TELEVISION STATIONS, INC.)
- KPNX (Channel 12; MESA, AZ; Owner: MULTIMEDIA HOLDINGS CORPORATION)
- KSAZ-TV (Channel 10; PHOENIX, AZ; Owner: KSAZ LICENSE, INC.)
- K57HX (Channel 57; MESA, AZ; Owner: KAZT, L.L.C.)
- KASW (Channel 61; PHOENIX, AZ; Owner: KASW-TV, INC.)
- K43GV (Channel 43; PHOENIX, AZ; Owner: TELEVISION APOGEO DE PHOENIX, LLC)
- K25DM (Channel 25; PHOENIX, AZ; Owner: KDMA CHANNEL 25, INC.)
- KNXV-TV (Channel 15; PHOENIX, AZ; Owner: SCRIPPS HOWARD BROADCASTING COMPANY)
- KTVW-TV (Channel 33; PHOENIX, AZ; Owner: KTVW LICENSE PARTNERSHIP, G.P.)
- K53GF (Channel 53; PHOENIX, AZ; Owner: SPANISH INDEPENDENT BROADCAST NETWORK, LLC)
- KDRX-CA (Channel 48; PHOENIX, AZ; Owner: NBC TELEMUNDO PHOENIX, INC.)
- KCOS-LP (Channel 28; PHOENIX, AZ; Owner: ARACELIS ORTIZ, EXECUTRIX OF THE ESTATE OF CARLOS ORTIZ)
- National Bridge Inventory (NBI) Statistics
- 372Number of bridges
- 3,868ft / 1,179mTotal length
- $233,000Total costs
- 9,118,503Total average daily traffic
- 627,142Total average daily truck traffic
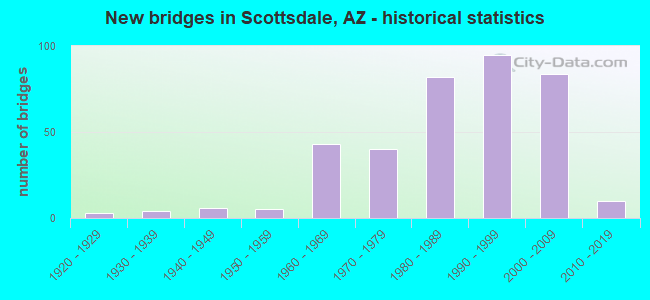
- New bridges - historical statistics
- 31920-1929
- 41930-1939
- 61940-1949
- 51950-1959
- 431960-1969
- 401970-1979
- 821980-1989
- 951990-1999
- 842000-2009
- 102010-2019
FCC Registered Antenna Towers: 850 (See the full list of FCC Registered Antenna Towers)
FCC Registered Commercial Land Mobile Towers: 1 (See the full list of FCC Registered Commercial Land Mobile Towers in Scottsdale, AZ)
FCC Registered Private Land Mobile Towers: 13 (See the full list of FCC Registered Private Land Mobile Towers)
FCC Registered Broadcast Land Mobile Towers: 204 (See the full list of FCC Registered Broadcast Land Mobile Towers)
FCC Registered Microwave Towers: 328 (See the full list of FCC Registered Microwave Towers in this town)
FCC Registered Paging Towers: 14 (See the full list of FCC Registered Paging Towers)
FCC Registered Maritime Coast & Aviation Ground Towers: 19 (See the full list of FCC Registered Maritime Coast & Aviation Ground Towers)
FCC Registered Amateur Radio Licenses: 1,788 (See the full list of FCC Registered Amateur Radio Licenses in Scottsdale)
FAA Registered Aircraft Manufacturers and Dealers: 44 (See the full list of FAA Registered Manufacturers and Dealers in Scottsdale)
FAA Registered Aircraft: 726 (See the full list of FAA Registered Aircraft)
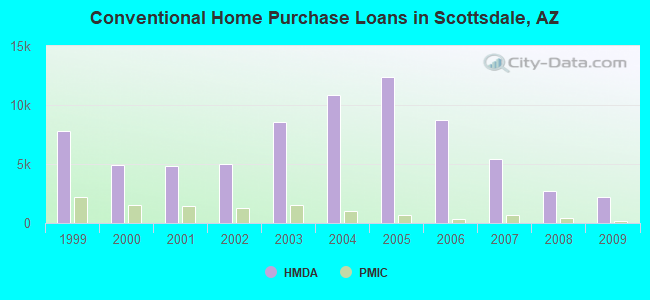
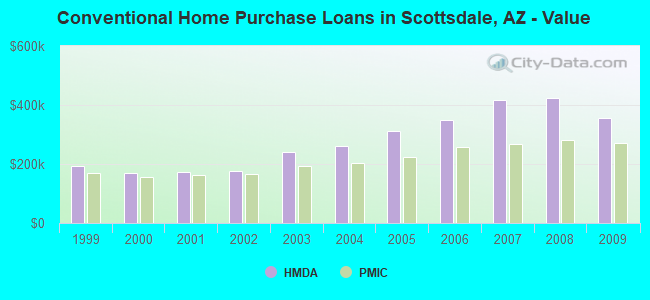
| Home Mortgage Disclosure Act Aggregated Statistics For Year 2009 (Based on 35 full and 5 partial tracts) | ||||||||||||||
| A) FHA, FSA/RHS & VA Home Purchase Loans | B) Conventional Home Purchase Loans | C) Refinancings | D) Home Improvement Loans | E) Loans on Dwellings For 5+ Families | F) Non-occupant Loans on < 5 Family Dwellings (A B C & D) | G) Loans On Manufactured Home Dwelling (A B C & D) | ||||||||
|---|---|---|---|---|---|---|---|---|---|---|---|---|---|---|
| Number | Average Value | Number | Average Value | Number | Average Value | Number | Average Value | Number | Average Value | Number | Average Value | Number | Average Value | |
| LOANS ORIGINATED | 730 | $215,487 | 2,222 | $354,979 | 7,182 | $292,491 | 129 | $253,310 | 6 | $9,806,815 | 1,465 | $299,839 | 17 | $245,797 |
| APPLICATIONS APPROVED, NOT ACCEPTED | 58 | $216,942 | 218 | $373,147 | 732 | $296,746 | 27 | $145,185 | 0 | $0 | 142 | $298,223 | 4 | $143,250 |
| APPLICATIONS DENIED | 125 | $207,615 | 476 | $422,433 | 2,364 | $365,097 | 104 | $182,285 | 2 | $617,500 | 491 | $281,512 | 4 | $58,750 |
| APPLICATIONS WITHDRAWN | 105 | $203,966 | 337 | $427,031 | 1,168 | $319,760 | 55 | $206,574 | 1 | $372,940 | 278 | $305,320 | 1 | $107,800 |
| FILES CLOSED FOR INCOMPLETENESS | 23 | $193,506 | 76 | $357,779 | 311 | $345,029 | 13 | $198,410 | 0 | $0 | 55 | $289,277 | 0 | $0 |
Detailed mortgage data for all 40 tracts in Scottsdale, AZ
| Private Mortgage Insurance Companies Aggregated Statistics For Year 2009 (Based on 34 full and 5 partial tracts) | ||||||
| A) Conventional Home Purchase Loans | B) Refinancings | C) Non-occupant Loans on < 5 Family Dwellings (A & B) | ||||
|---|---|---|---|---|---|---|
| Number | Average Value | Number | Average Value | Number | Average Value | |
| LOANS ORIGINATED | 197 | $272,798 | 59 | $280,092 | 5 | $163,264 |
| APPLICATIONS APPROVED, NOT ACCEPTED | 62 | $297,765 | 32 | $266,526 | 8 | $303,694 |
| APPLICATIONS DENIED | 47 | $255,257 | 20 | $291,727 | 5 | $218,600 |
| APPLICATIONS WITHDRAWN | 17 | $372,274 | 6 | $265,623 | 1 | $264,540 |
| FILES CLOSED FOR INCOMPLETENESS | 10 | $264,734 | 1 | $175,000 | 2 | $182,000 |
2005 - 2018 National Fire Incident Reporting System (NFIRS) incidents
- Fire incident types reported to NFIRS in Scottsdale, AZ
- 1,74938.1%Structure Fires
- 1,39730.4%Outside Fires
- 75716.5%Other
- 68514.9%Mobile Property/Vehicle Fires
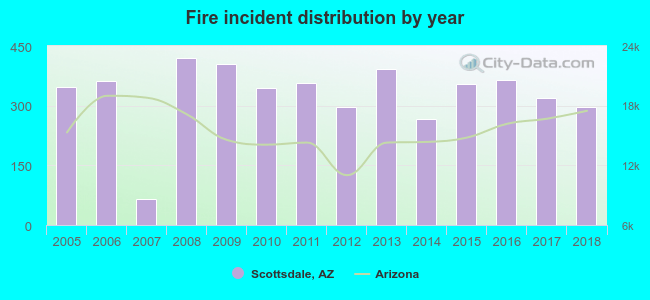 According to the data from the years 2005 - 2018 the average number of fires per year is 328. The highest number of reported fire incidents - 419 took place in 2008, and the least - 65 in 2007. The data has a dropping trend.
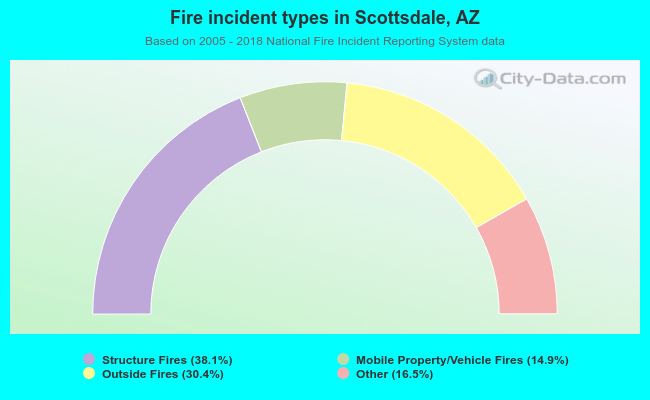 When looking into fire subcategories, the most reports belonged to: Structure Fires (38.1%), and Outside Fires (30.4%).
Fire-safe hotels and motels in Scottsdale, Arizona:
- The Scott Resort & Spa, 4925 N Scottsdale Rd, Scottsdale, Arizona 85251 , Phone: (480) 945-7666, Fax: (480) 946-4056
- Orange Tree Golf Resort, 10601 N 56 St, Scottsdale, Arizona 85254 , Phone: (480) 948-6100
- Millennium Resort Scottsdale, Mccormick Ranch, 7401 N Scottsdale Rd, Scottsdale, Arizona 85253 , Phone: (480) 948-5050, Fax: (480) 367-2488
- Scottsdale Hilton Resort And Spa, 6333 N Scottsdale Rd, Scottsdale, Arizona 85250 , Phone: (480) 948-7750, Fax: (480) 905-8539
- Scottsdale Plaza Resort, 7200 N Scottsdale Rd, Scottsdale, Arizona 85253 , Phone: (480) 948-5000, Fax: (480) 998-5971
- Hotel Scottsdale, 5101 N Scottsdale Rd, Scottsdale, Arizona 85250 , Phone: (480) 945-4392, Fax: (480) 947-3044
- Howard Johnson Scottsdale, 7110 E Indian School Rd, Scottsdale, Arizona 85251 , Phone: (480) 361-6001, Fax: (480) 361-3395
- Hospitality Suite Resort Scottsdale, 409 N Scottsdale Rd, Scottsdale, Arizona 85257 , Phone: (480) 949-5115, Fax: (480) 941-8014
- 34 other hotels and motels
| Most common first names in Scottsdale, AZ among deceased individuals | ||
| Name | Count | Lived (average) |
|---|---|---|
| John | 1,091 | 75.1 years |
| Robert | 903 | 72.7 years |
| Mary | 858 | 81.3 years |
| William | 809 | 75.0 years |
| James | 645 | 72.6 years |
| Helen | 615 | 82.0 years |
| Dorothy | 526 | 81.3 years |
| Charles | 519 | 75.9 years |
| George | 492 | 77.2 years |
| Margaret | 478 | 82.1 years |
| Most common last names in Scottsdale, AZ among deceased individuals | ||
| Last name | Count | Lived (average) |
|---|---|---|
| Smith | 328 | 76.9 years |
| Johnson | 240 | 77.4 years |
| Miller | 191 | 77.2 years |
| Williams | 160 | 77.1 years |
| Brown | 145 | 76.6 years |
| Anderson | 142 | 77.6 years |
| Jones | 135 | 77.1 years |
| Davis | 124 | 77.0 years |
| Wilson | 104 | 76.4 years |
| Clark | 103 | 75.1 years |
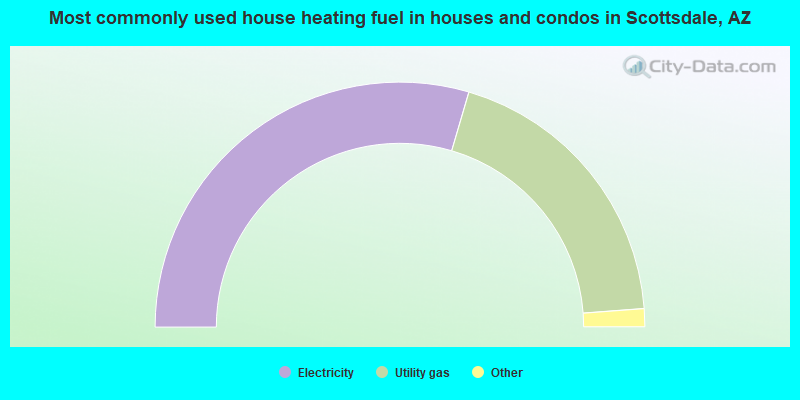
- 59.1%Electricity
- 38.5%Utility gas
- 1.1%Bottled, tank, or LP gas
- 0.8%Solar energy
- 0.3%No fuel used
- 0.2%Other fuel
- 0.1%Wood
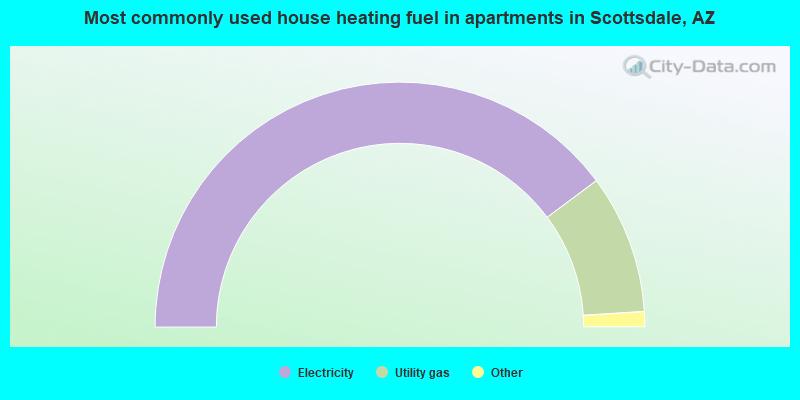
- 79.7%Electricity
- 18.4%Utility gas
- 0.8%Bottled, tank, or LP gas
- 0.4%No fuel used
- 0.3%Other fuel
- 0.2%Fuel oil, kerosene, etc.
- 0.1%Coal or coke
Scottsdale compared to Arizona state average:
- Median house value above state average.
- Unemployed percentage significantly below state average.
- Hispanic race population percentage below state average.
- Median age significantly above state average.
- Percentage of population with a bachelor's degree or higher significantly above state average.
Scottsdale, AZ compared to other similar cities:
Scottsdale on our top lists:
- #10 on the list of "Top 101 cities with the highest average sunshine amount (population 50,000+)"
- #10 on the list of "Top 101 cities with the highest number of days clear of clouds (population 50,000+)"
- #10 on the list of "Top 101 cities with the most people born in other U.S. states (population 50,000+)"
- #10 on the list of "Top 101 cities with the lowest number of days clear of clouds (population 50,000+)"
- #14 on the list of "Top 101 cities with the highest percentage of workers working at home, population 50,000+"
- #15 on the list of "Top 101 cities with the hottest summers (population 50,000+)"
- #16 on the list of "Top 101 cities with largest percentage of males in occupations: sales and related occupations (population 50,000+)"
- #18 on the list of "Top 101 cities with largest percentage of males in industries: real estate and rental and leasing (population 50,000+)"
- #18 on the list of "Top 101 cities with the highest daily high temperatures (population 50,000+)"
- #19 on the list of "Top 101 cities with largest percentage of females in industries: real estate and rental and leasing (population 50,000+)"
- #19 on the list of "Top 101 cities with the lowest minimum monthly morning or afternoon humidity (population 50,000+)"
- #20 on the list of "Top 101 cities with the lowest average humidity (population 50,000+)"
- #20 on the list of "Top 101 cities with the lowest maximum monthly morning or afternoon humidity (population 50,000+)"
- #21 on the list of "Top 100 cities with oldest residents (pop. 50,000+)"
- #22 on the list of "Top 101 cities with the highest cost per building permit(population 50,000+)"
- #26 on the list of "Top 101 cities with largest percentage of males in occupations: business and financial operations occupations (population 50,000+)"
- #42 on the list of "Top 101 cities with the lowest average wind speeds (population 50,000+)"
- #45 on the list of "Top 101 cities with largest percentage of females in occupations: health diagnosing and treating practitioners and other technical occupations (population 50,000+)"
- #47 on the list of "Top 101 cities with the largest city-data.com crime index decrease from 2002 to 2012 (population 50,000+)"
- #48 on the list of "Top 101 cities with the lowest average yearly precipitation (population 50,000+)"
- #2 on the list of "Top 101 counties with the highest Nitrogen Dioxide air pollution readings in 2012 (ppm)"
- #3 on the list of "Top 101 counties with the highest total withdrawal of fresh water for public supply"
- #3 on the list of "Top 101 counties with the highest surface withdrawal of fresh water for public supply"
- #4 on the list of "Top 101 counties with the most Other congregations"
- #5 on the list of "Top 101 counties with the most Evangelical Protestant adherents (pop. 50,000+)"

|
|
Total of 5154 patent applications in 2008-2024.