Scottsdale: Fire Incidents, Arizona (AZ)
Where are fire incidents reported in Scottsdale, AZ
Something went wrong! Please refresh the page.
| Fire incidents reported | |
|---|---|
| Sreet name | Count |
| SCOTTSDALE RD | 508 |
| HAYDEN RD | 384 |
| MCDOWELL RD | 198 |
| A101 | 188 |
| THOMAS RD | 166 |
| CAMELBACK RD | 164 |
| 78TH ST | 160 |
| 68TH ST | 150 |
| 70TH ST | 128 |
| OSBORN RD | 128 |
| MILLER RD | 120 |
| GRANITE REEF RD | 116 |
| 82ND ST | 98 |
| PIMA RD | 90 |
| 74TH ST | 86 |
| 92ND ST | 84 |
| FRANK LLOYD WRIGHT BL | 84 |
| INDIAN SCHOOL RD | 84 |
| VIA LINDA | 76 |
| CHAPARRAL RD | 72 |
| 66TH ST | 68 |
| MCKELLIPS RD | 68 |
| OAK ST | 68 |
| BELLEVIEW ST | 66 |
| SHEA BL | 66 |
| EARLL DR | 60 |
| THOMPSON PEAK PW | 56 |
| MOUNTAIN VIEW RD | 54 |
| 90TH ST | 52 |
| PALM LN | 52 |
| Other | 894 |
2005 - 2018 National Fire Incident Reporting System (NFIRS) incidents
- Incident types reported to NFIRS in Scottsdale, AZ
- 77,65266.7%Rescue & EMS
- 12,10810.4%Service Call
- 11,67510.0%Good Intent Call
- 6,4535.5%False Alarm
- 4,5883.9%Fire
- 3,4242.9%Hazardous Condition
- 4460.4%Special Incident
- Fire incident types reported to NFIRS in Scottsdale, AZ
- 1,74938.1%Structure Fires
- 1,39730.4%Outside Fires
- 75716.5%Other
- 68514.9%Mobile Property/Vehicle Fires
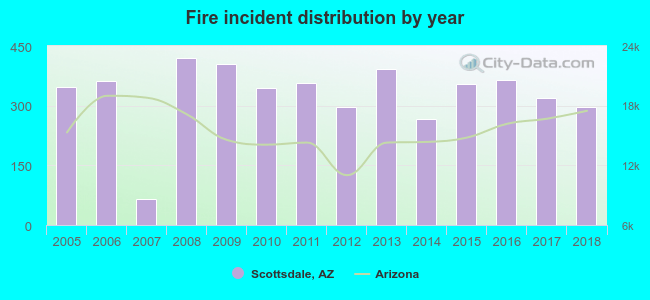 According to the data from the years 2005 - 2018 the average number of fire incidents per year is 328. The highest number of reported fires - 419 took place in 2008, and the least - 65 in 2007. The data has a decreasing trend.
The average number of yearly fire incidents per 10k residents in Scottsdale, AZ compared to nearest cities:
(Note: Based on data for the last 3 years, including only cities with population 5,000 and above)
| Scottsdale: | 14.2 |
| Paradise Valley: | 5.9 |
| Salt River: | 1.1 |
| Phoenix: | 36.2 |
| Tempe: | 29.2 |
| Mesa: | 21.6 |
| Guadalupe: | 9.3 |
| Cave Creek: | 1.9 |
| Glendale: | 0.8 |
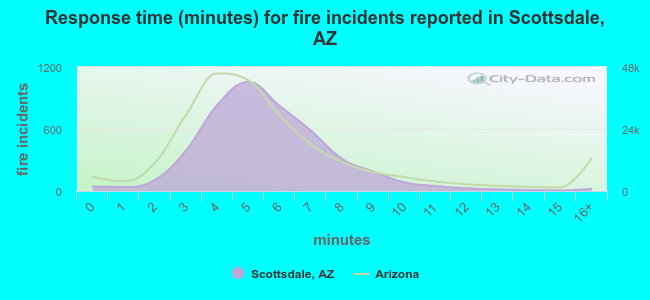 The median response time based on all reported fire incidents is 5 minutes. This is close to the Arizona median value.
The median response time in Scottsdale, AZ compared to nearest cities:
(Note: Based on data for all years, including only cities with at least 500 fire incidents)
| Scottsdale: | 5 minutes |
| Phoenix: | 4 minutes |
| Tempe: | 4 minutes |
| Mesa: | 5 minutes |
| Glendale: | 4 minutes |
| Gilbert: | 5 minutes |
| Chandler: | 5 minutes |
| Peoria: | 5 minutes |
| Sun City: | 4 minutes |
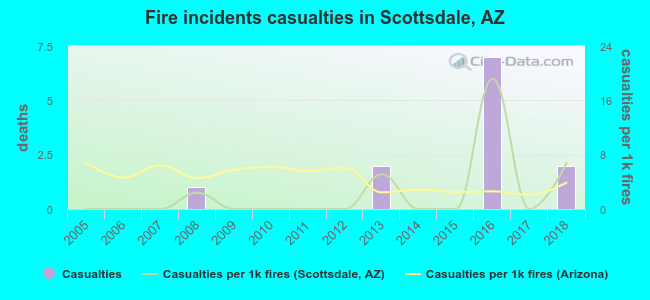 According to the data from the years 2005 - 2018 the average number of fire-related casualties per year is 1. The highest number of reported injuries - 7 took place in 2016, and the lowest - 0 in 2005. The data has a rising trend.
The average number of casualties per 1,000 fires is 2. This indicator was the highest - 19 in 2016, and the lowest 0 in 2005. The trend for injuries per 1,000 incidents is growing. Compared to the Arizona value the number of casualties per 1,000 fire incidents is much lower.
According to the data from the years 2005 - 2018 the average number of fire-related casualties per year is 1. The highest number of reported injuries - 7 took place in 2016, and the lowest - 0 in 2005. The data has a rising trend.
The average number of casualties per 1,000 fires is 2. This indicator was the highest - 19 in 2016, and the lowest 0 in 2005. The trend for injuries per 1,000 incidents is growing. Compared to the Arizona value the number of casualties per 1,000 fire incidents is much lower.
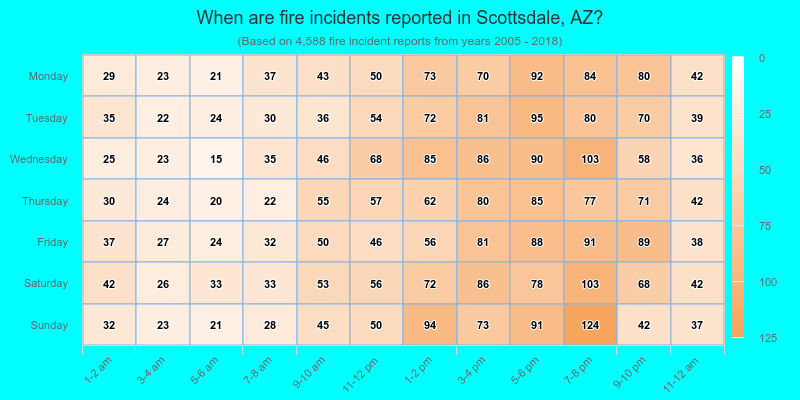
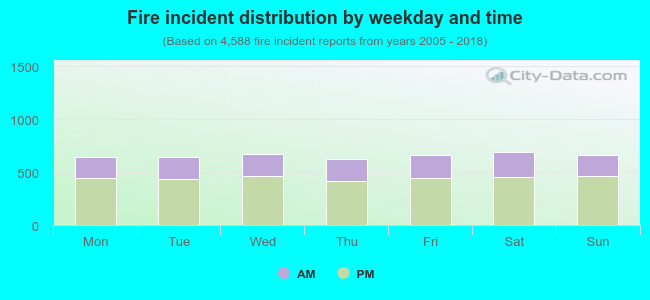 32.3% incidents where reported in the morning and 67.7% in the evening. The most fires (15.1%) took place on Saturday, and the least (13.6%) on Thursday.
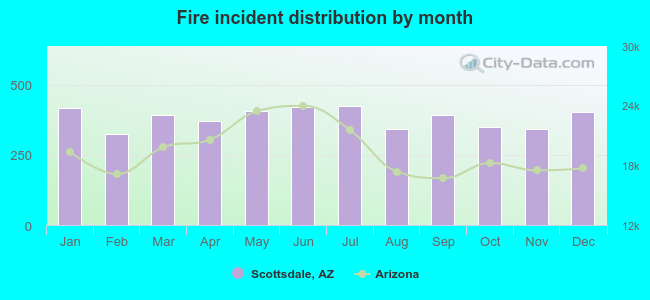 According to the 4,588 fires from years 2005 - 2018 most fires (9.3%) took place during July, and the least (7.1%) in February.
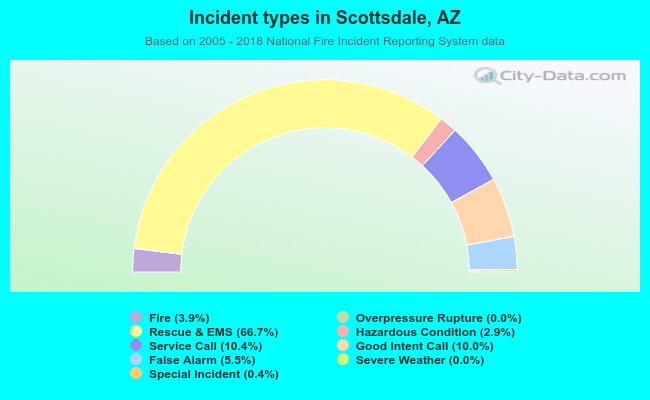 Out of all 116,372 cases reported during the years 2005 - 2018, the most belonged to the categories: Rescue & EMS (66.7%), Service Call (10.4%), and Good Intent Call (10.0%).
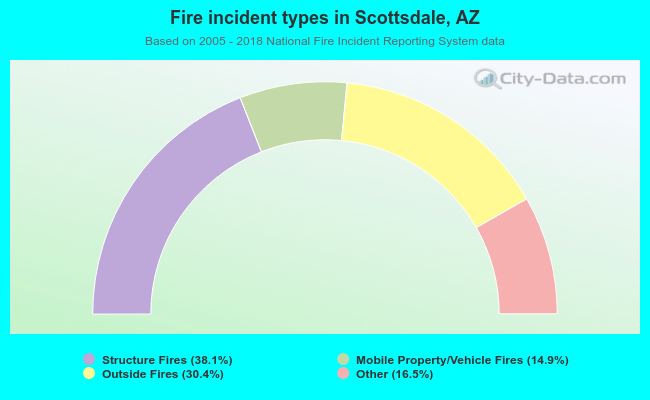 When looking into fire subcategories, the most reports belonged to: Structure Fires (38.1%), and Outside Fires (30.4%).