Peoria: Fire Incidents, Arizona (AZ)
Where are fire incidents reported in Peoria, AZ
Something went wrong! Please refresh the page.
| Fire incidents reported | |
|---|---|
| Sreet name | Count |
| A101 | 150 |
| 75TH AV | 148 |
| BELL RD | 138 |
| 83RD AVE | 130 |
| THUNDERBIRD RD | 126 |
| 83RD AV | 124 |
| 91ST AV | 118 |
| PEORIA AV | 116 |
| 67TH AV | 100 |
| 87TH AV | 98 |
| LAKE PLEASANT RD | 80 |
| 99TH AV | 78 |
| PEORIA AVE | 78 |
| 91ST AVE | 76 |
| CACTUS RD | 72 |
| 87TH AVE | 68 |
| UNION HILLS DR | 64 |
| A74 | 62 |
| 85TH AV | 58 |
| OLIVE AV | 58 |
| 71ST AV | 56 |
| 75TH AVE | 56 |
| 79TH AV | 56 |
| OLIVE AVE | 52 |
| MONROE ST | 50 |
| CASTLE HOT SPRINGS RD | 46 |
| CAREFREE HW | 44 |
| CHOLLA ST | 44 |
| NORTHERN AV | 44 |
| 79TH AVE | 42 |
| Other | 757 |
2003 - 2018 National Fire Incident Reporting System (NFIRS) incidents
- Incident types reported to NFIRS in Peoria, AZ
- 12,27859.8%Rescue & EMS
- 3,18915.5%Fire
- 2,09610.2%Good Intent Call
- 1,0185.0%Service Call
- 8694.2%False Alarm
- 8384.1%Hazardous Condition
- 2351.1%Special Incident
- Fire incident types reported to NFIRS in Peoria, AZ
- 1,03032.3%Other
- 99031.0%Outside Fires
- 70122.0%Structure Fires
- 46814.7%Mobile Property/Vehicle Fires
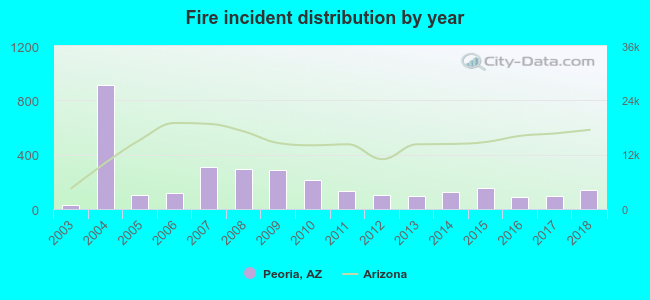 Based on the data from the years 2003 - 2018 the average number of fire incidents per year is 199. The highest number of fires - 910 took place in 2004, and the least - 30 in 2003. The data has a rising trend.
The average number of yearly fire incidents per 10k residents in Peoria, AZ compared to nearest cities:
(Note: Based on data for the last 3 years, including only cities with population 5,000 and above)
| Peoria: | 6.5 |
| Sun City: | 22.6 |
| Youngtown: | 53.5 |
| El Mirage: | 32.0 |
| Glendale: | 0.8 |
| Sun City West: | 17.7 |
| Surprise: | 18.8 |
| Litchfield Park: | 17.9 |
| Phoenix: | 36.2 |
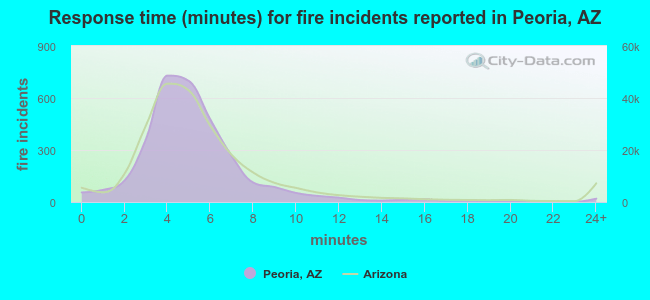 The median response time based on all reported fire incidents is 5 minutes. This is about the same as the Arizona median value.
The median response time in Peoria, AZ compared to nearest cities:
(Note: Based on data for all years, including only cities with at least 500 fire incidents)
| Peoria: | 5 minutes |
| Sun City: | 4 minutes |
| El Mirage: | 5 minutes |
| Glendale: | 4 minutes |
| Surprise: | 5 minutes |
| Phoenix: | 4 minutes |
| Avondale: | 5 minutes |
| Goodyear: | 6 minutes |
| Scottsdale: | 5 minutes |
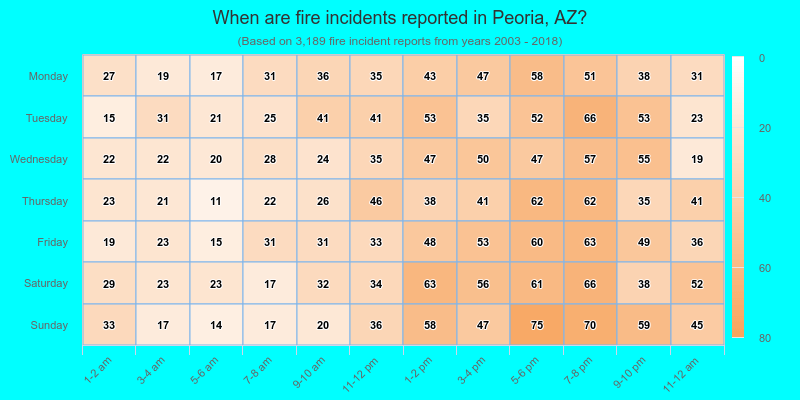
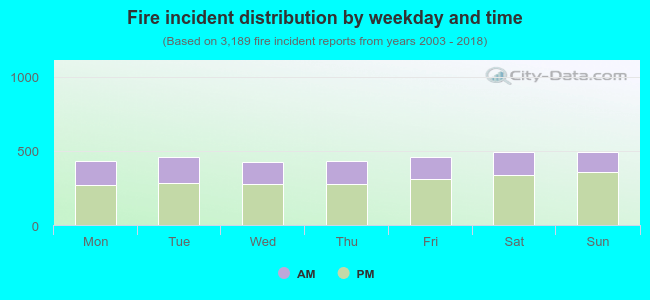 34.1% incidents where reported in the morning and 65.9% in the evening. The most fires (15.5%) took place on Saturday, and the least (13.4%) on Wednesday.
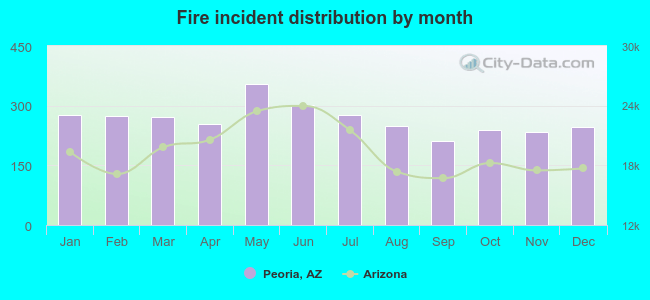 According to the 3,189 fires from years 2003 - 2018 most fires (11.1%) took place during May, and the least (6.6%) in September.
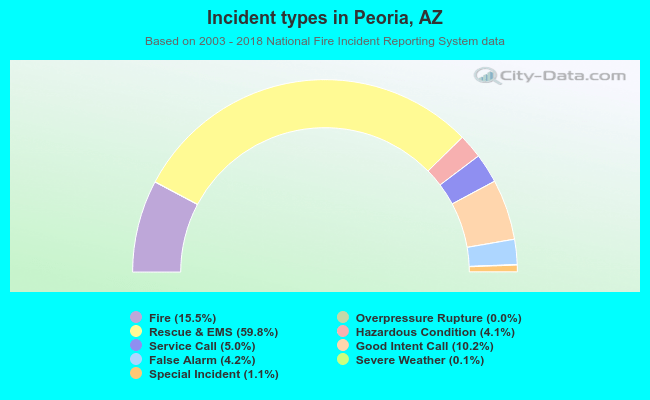 Out of all 20,539 cases reported during the years 2003 - 2018, the most belonged to the categories: Rescue & EMS (59.8%), Fire (15.5%), and Good Intent Call (10.2%).
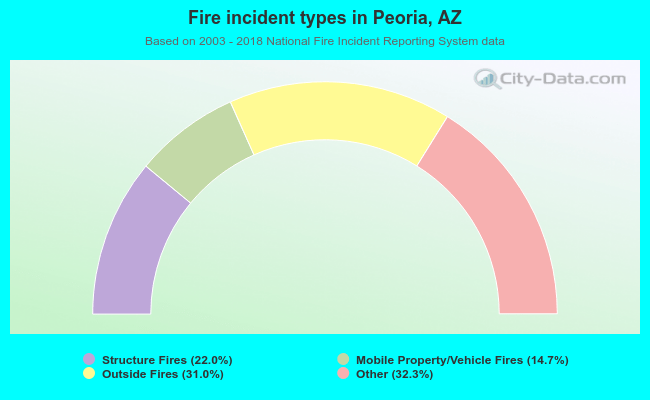 When looking into fire subcategories, the most incidents belonged to: Other (32.3%), and Outside Fires (31.0%).