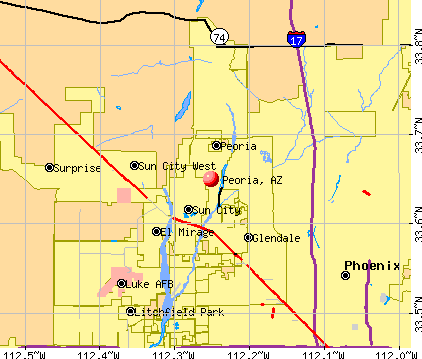
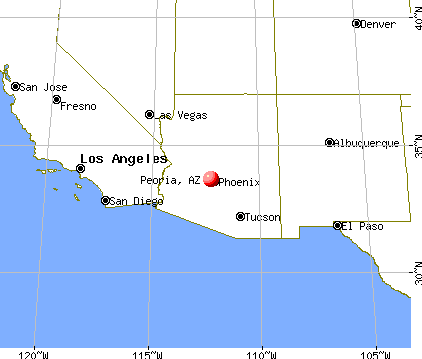
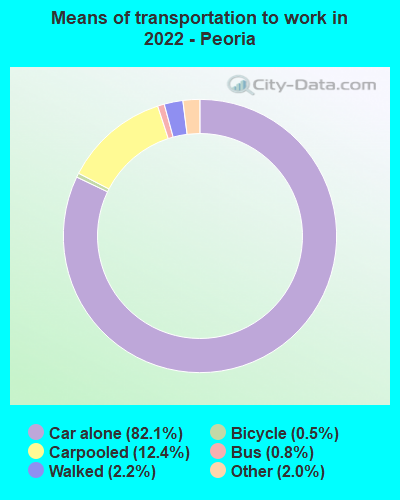
Peoria, Arizona
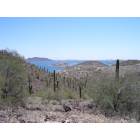
Peoria: Lake Pleasant in the desert
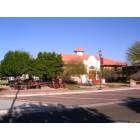
Peoria: Peoria Historical Society Museum
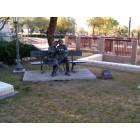
Peoria: Old Woman and Old Man-Peoria, Arizona
Peoria: SkyZone Trampoline Park will open in Peoria this month (December)
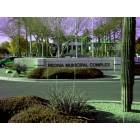
Peoria: Peoria Municipal Complex

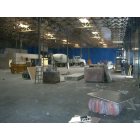
Peoria: Seattle Marine Spring Training Building in Peoria
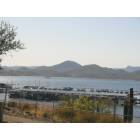
Peoria: Lake Pleasant, Peora Arizona

Peoria: Hot Air Balloon over Peoria
- add
your
Submit your own pictures of this city and show them to the world
- OSM Map
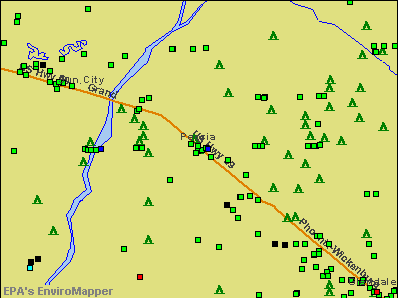
- General Map
- Google Map
- MSN Map
Population change since 2000: +82.6%
| Males: 95,415 | |
| Females: 102,451 |
| Median resident age: | 41.0 years |
| Arizona median age: | 38.8 years |
Zip codes: 85351, 85373, 85387.
Peoria Zip Code Map| Peoria: | $86,948 |
| AZ: | $74,568 |
Estimated per capita income in 2022: $41,944 (it was $22,726 in 2000)
Peoria city income, earnings, and wages data
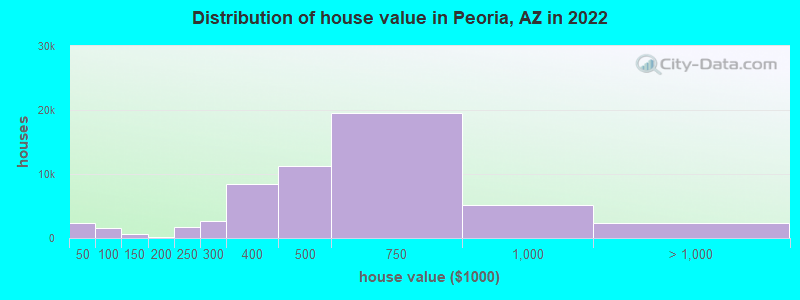
Estimated median house or condo value in 2022: $493,400 (it was $121,100 in 2000)
| Peoria: | $493,400 |
| AZ: | $402,800 |
Mean prices in 2022: all housing units: $526,562; detached houses: $563,426; townhouses or other attached units: $509,293; in 2-unit structures: $261,754; in 3-to-4-unit structures: $242,893; in 5-or-more-unit structures: $248,567; mobile homes: $56,592; occupied boats, rvs, vans, etc.: $35,223
Median gross rent in 2022: $1,860.
(6.1% for White Non-Hispanic residents, 14.4% for Black residents, 12.1% for Hispanic or Latino residents, 7.2% for American Indian residents, 20.5% for Native Hawaiian and other Pacific Islander residents, 19.4% for other race residents, 9.2% for two or more races residents)
Detailed information about poverty and poor residents in Peoria, AZ


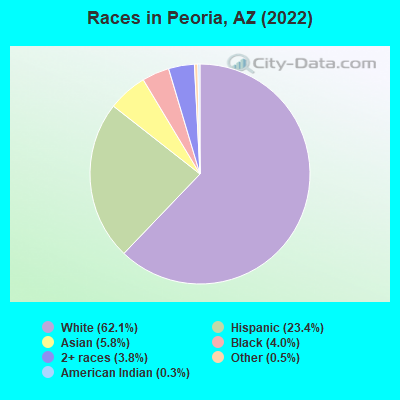
- 122,89462.1%White alone
- 46,34623.4%Hispanic
- 11,5255.8%Asian alone
- 7,9134.0%Black alone
- 7,6093.8%Two or more races
- 9760.5%Other race alone
- 5020.3%American Indian alone
- 970.05%Native Hawaiian and Other
Pacific Islander alone
According to our research of Arizona and other state lists, there were 112 registered sex offenders living in Peoria, Arizona as of April 27, 2024.
The ratio of all residents to sex offenders in Peoria is 1,466 to 1.
The ratio of registered sex offenders to all residents in this city is lower than the state average.
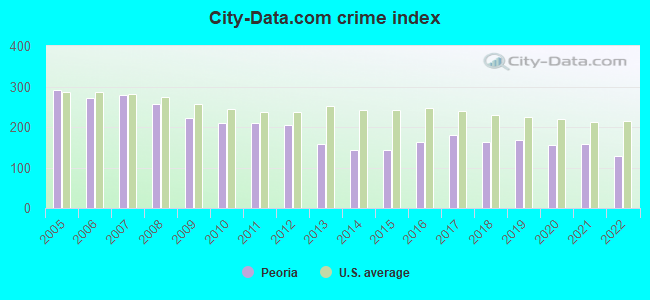
The City-Data.com crime index weighs serious crimes and violent crimes more heavily. Higher means more crime, U.S. average is 246.1. It adjusts for the number of visitors and daily workers commuting into cities.
- means the value is smaller than the state average.- means the value is about the same as the state average.
- means the value is bigger than the state average.
Crime rate in Peoria detailed stats: murders, rapes, robberies, assaults, burglaries, thefts, arson
Full-time law enforcement employees in 2021, including police officers: 286 (189 officers - 166 male; 23 female).
| Officers per 1,000 residents here: | 0.97 |
| Arizona average: | 1.75 |
 Recent articles from our blog. Our writers, many of them Ph.D. graduates or candidates, create easy-to-read articles on a wide variety of topics.

 | Moving to Queen Creek vs Peoria, Arizona (23 replies) |
| Living in Glendale Westgate area vs Peoria (11 replies) |
| Innovative robo-ride in Peoria (3 replies) |
| Peoria ranked #1 place to live in AZ by Money Magazine! (42 replies) |
| how about some observations on Peoria? (40 replies) |
| Is Peoria too far to commute if working in Tempe (ASU)? (29 replies) |
Latest news from Peoria, AZ collected exclusively by city-data.com from local newspapers, TV, and radio stations
Peoria, AZ City Guides:
Ancestries: German (9.3%), American (7.5%), English (7.2%), Irish (5.3%), Italian (4.3%), European (3.2%).
Current Local Time: MST (no DST) time zone
Incorporated in 1954
Elevation: 1142 feet
Land area: 138.2 square miles.
Population density: 1,432 people per square mile (low).
21,558 residents are foreign born (5.0% Asia, 3.7% Latin America, 1.5% Europe).
| This city: | 11.0% |
| Arizona: | 13.0% |
Median real estate property taxes paid for housing units with mortgages in 2022: $2,107 (0.4%)
Median real estate property taxes paid for housing units with no mortgage in 2022: $1,800 (0.4%)
Nearest city with pop. 200,000+: Glendale, AZ  (5.6 miles , pop. 218,812).
Nearest city with pop. 1,000,000+: Phoenix, AZ (13.1 miles , pop. 1,321,045).
Nearest cities:
), ), Latitude: 33.65 N, Longitude: 112.25 W
Daytime population change due to commuting: -22,172 (-11.2%)
Workers who live and work in this city: 35,133 (37.1%)
Property values in Peoria, AZ
Peoria tourist attractions:
Peoria, Arizona accommodation & food services, waste management - Economy and Business Data
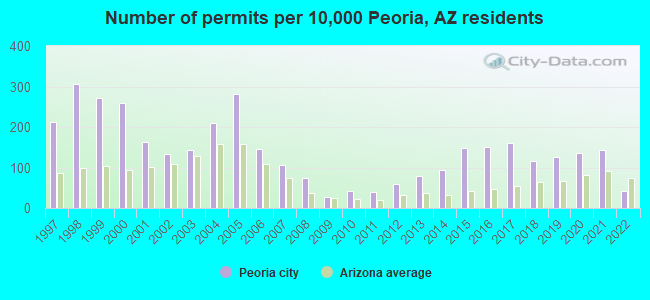
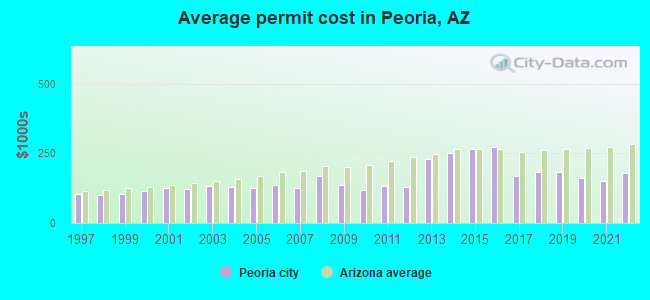
Single-family new house construction building permits:
- 2022: 466 buildings, average cost: $181,200
- 2021: 1562 buildings, average cost: $149,400
- 2020: 1474 buildings, average cost: $161,700
- 2019: 1363 buildings, average cost: $181,800
- 2018: 1245 buildings, average cost: $182,300
- 2017: 1731 buildings, average cost: $167,500
- 2016: 1636 buildings, average cost: $273,100
- 2015: 1589 buildings, average cost: $266,200
- 2014: 1033 buildings, average cost: $252,000
- 2013: 870 buildings, average cost: $229,700
- 2012: 642 buildings, average cost: $130,200
- 2011: 430 buildings, average cost: $131,900
- 2010: 442 buildings, average cost: $120,300
- 2009: 302 buildings, average cost: $138,000
- 2008: 794 buildings, average cost: $169,600
- 2007: 1148 buildings, average cost: $123,900
- 2006: 1572 buildings, average cost: $136,000
- 2005: 3042 buildings, average cost: $125,900
- 2004: 2271 buildings, average cost: $128,300
- 2003: 1544 buildings, average cost: $132,200
- 2002: 1452 buildings, average cost: $122,000
- 2001: 1752 buildings, average cost: $124,500
- 2000: 2806 buildings, average cost: $115,000
- 1999: 2939 buildings, average cost: $104,900
- 1998: 3300 buildings, average cost: $99,700
- 1997: 2309 buildings, average cost: $103,100
| Here: | 3.0% |
| Arizona: | 3.8% |
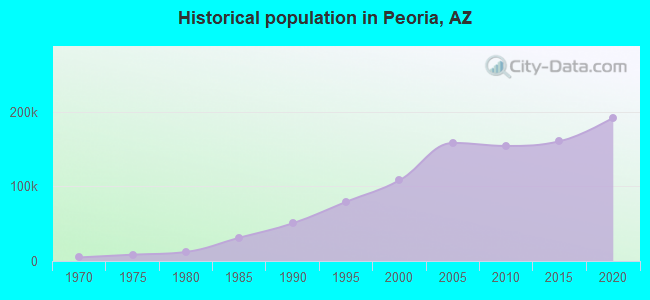
Population change in the 1990s: +57,028 (+111.1%).
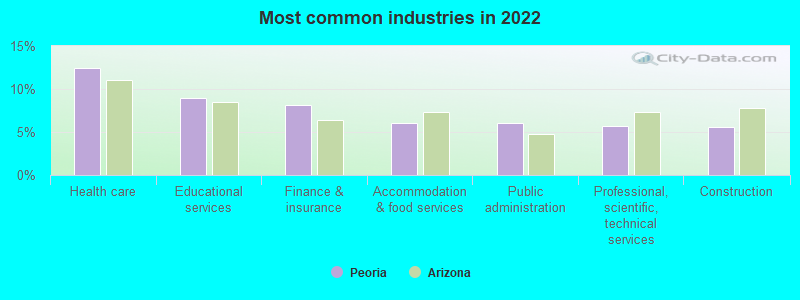
- Health care (12.4%)
- Educational services (9.0%)
- Finance & insurance (8.1%)
- Accommodation & food services (6.1%)
- Public administration (6.1%)
- Professional, scientific, technical services (5.6%)
- Construction (5.6%)
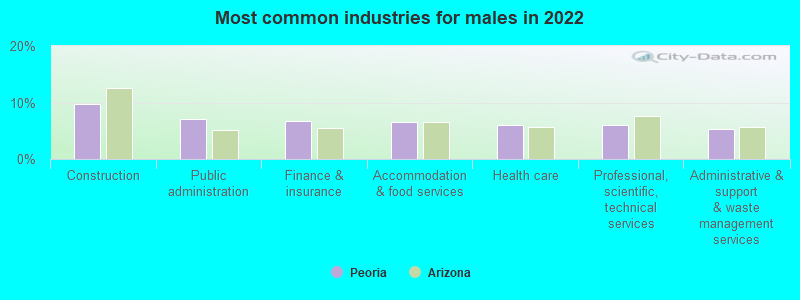
- Construction (9.7%)
- Public administration (7.1%)
- Finance & insurance (6.6%)
- Accommodation & food services (6.5%)
- Health care (6.1%)
- Professional, scientific, technical services (6.0%)
- Administrative & support & waste management services (5.4%)
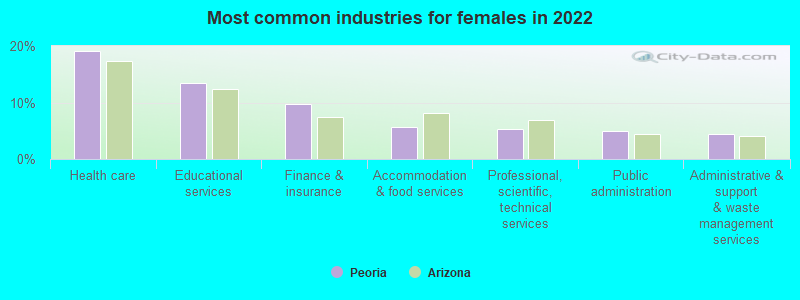
- Health care (19.2%)
- Educational services (13.5%)
- Finance & insurance (9.6%)
- Accommodation & food services (5.7%)
- Professional, scientific, technical services (5.3%)
- Public administration (4.9%)
- Administrative & support & waste management services (4.5%)
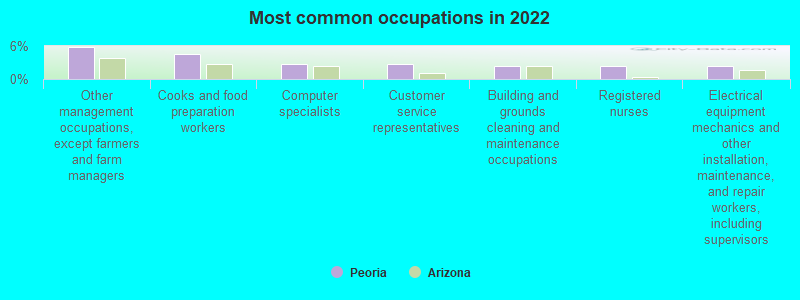
- Other management occupations, except farmers and farm managers (5.8%)
- Cooks and food preparation workers (4.6%)
- Computer specialists (2.7%)
- Customer service representatives (2.7%)
- Building and grounds cleaning and maintenance occupations (2.4%)
- Registered nurses (2.3%)
- Electrical equipment mechanics and other installation, maintenance, and repair workers, including supervisors (2.3%)
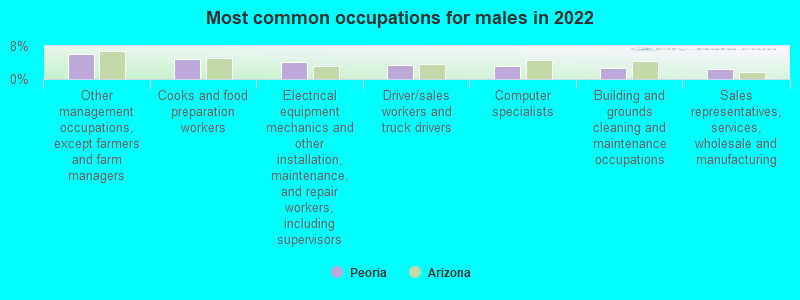
- Other management occupations, except farmers and farm managers (6.2%)
- Cooks and food preparation workers (4.7%)
- Electrical equipment mechanics and other installation, maintenance, and repair workers, including supervisors (4.2%)
- Driver/sales workers and truck drivers (3.4%)
- Computer specialists (3.2%)
- Building and grounds cleaning and maintenance occupations (2.7%)
- Sales representatives, services, wholesale and manufacturing (2.4%)
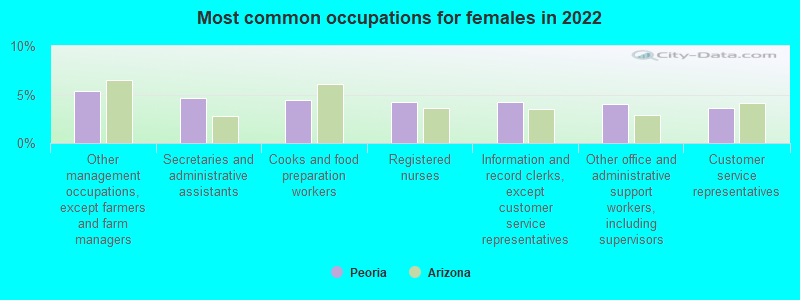
- Other management occupations, except farmers and farm managers (5.4%)
- Secretaries and administrative assistants (4.6%)
- Cooks and food preparation workers (4.5%)
- Registered nurses (4.2%)
- Information and record clerks, except customer service representatives (4.2%)
- Other office and administrative support workers, including supervisors (4.0%)
- Customer service representatives (3.6%)
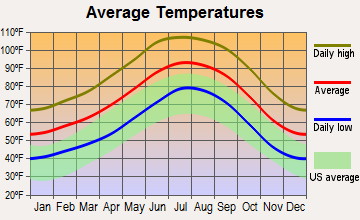
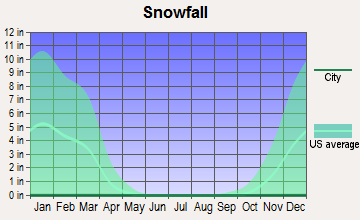
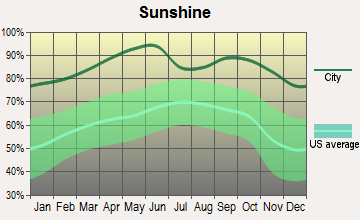
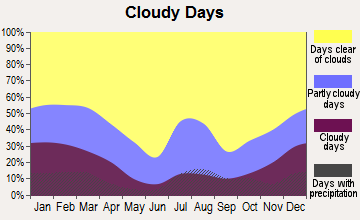
Average climate in Peoria, Arizona
Based on data reported by over 4,000 weather stations
|
|

(lower is better)
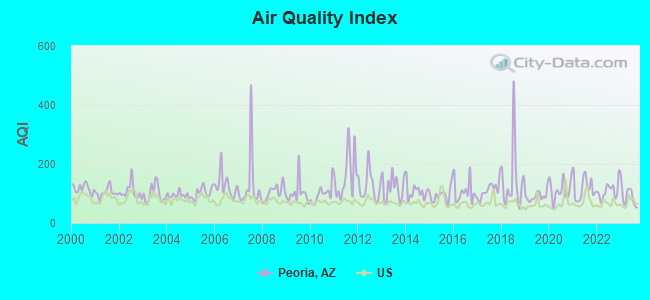
Air Quality Index (AQI) level in 2023 was 90.9. This is worse than average.
| City: | 90.9 |
| U.S.: | 72.6 |
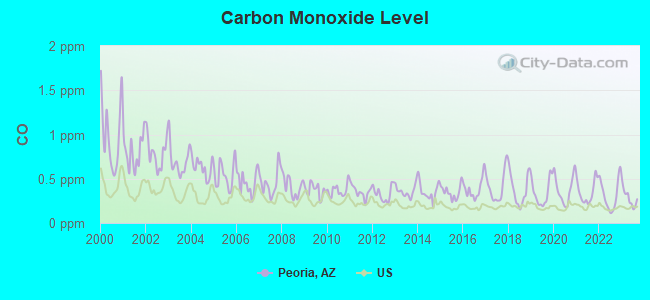
Carbon Monoxide (CO) [ppm] level in 2023 was 0.287. This is about average. Closest monitor was 2.5 miles away from the city center.
| City: | 0.287 |
| U.S.: | 0.251 |
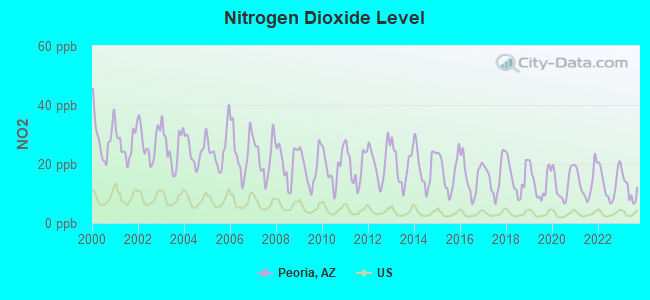
Nitrogen Dioxide (NO2) [ppb] level in 2023 was 11.4. This is significantly worse than average. Closest monitor was 2.5 miles away from the city center.
| City: | 11.4 |
| U.S.: | 5.1 |
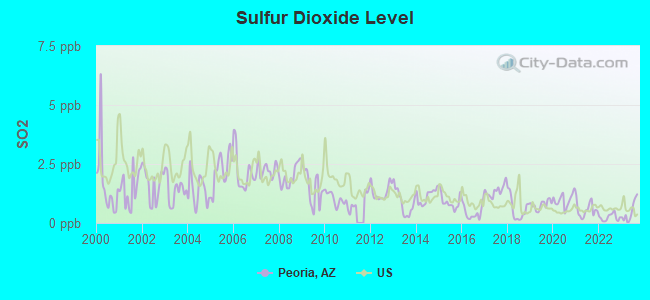
Sulfur Dioxide (SO2) [ppb] level in 2023 was 0.478. This is significantly better than average. Closest monitor was 6.2 miles away from the city center.
| City: | 0.478 |
| U.S.: | 1.515 |
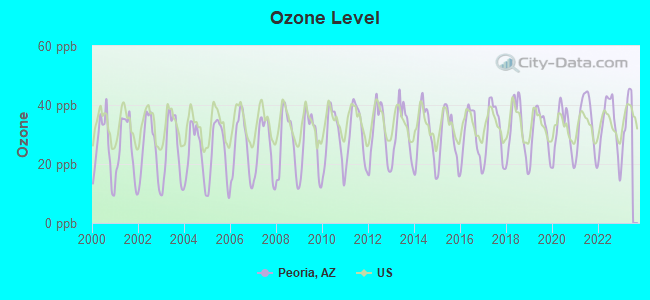
Ozone [ppb] level in 2022 was 32.9. This is about average. Closest monitor was 3.4 miles away from the city center.
| City: | 32.9 |
| U.S.: | 33.3 |
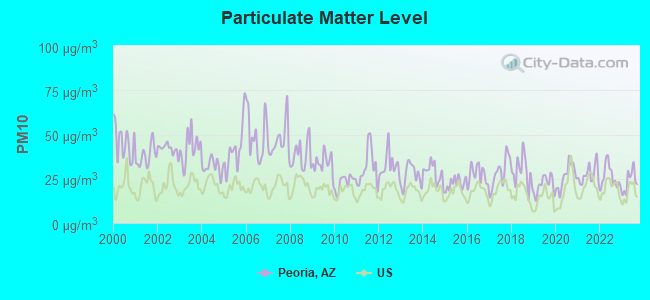
Particulate Matter (PM10) [µg/m3] level in 2023 was 23.7. This is worse than average. Closest monitor was 3.6 miles away from the city center.
| City: | 23.7 |
| U.S.: | 19.2 |
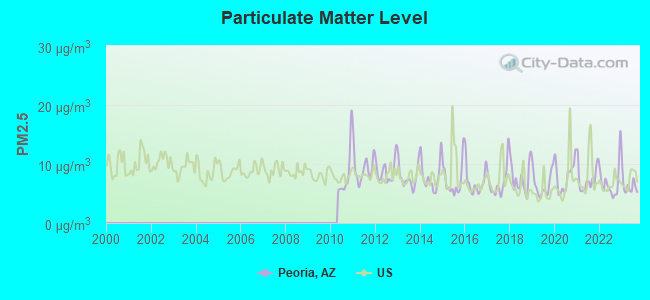
Particulate Matter (PM2.5) [µg/m3] level in 2023 was 6.31. This is better than average. Closest monitor was 6.2 miles away from the city center.
| City: | 6.31 |
| U.S.: | 8.11 |
Earthquake activity:
Peoria-area historical earthquake activity is significantly above Arizona state average. It is 2656% greater than the overall U.S. average.On 6/28/1992 at 11:57:34, a magnitude 7.6 (6.2 MB, 7.6 MS, 7.3 MW, Depth: 0.7 mi, Class: Major, Intensity: VIII - XII) earthquake occurred 248.4 miles away from the city center, causing 3 deaths (1 shaking deaths, 2 other deaths) and 400 injuries, causing $100,000,000 total damage and $40,000,000 insured losses
On 5/19/1940 at 04:36:40, a magnitude 7.2 (7.2 UK) earthquake occurred 201.0 miles away from the city center, causing $33,000,000 total damage
On 10/16/1999 at 09:46:44, a magnitude 7.4 (6.3 MB, 7.4 MS, 7.2 MW, 7.3 ML) earthquake occurred 247.0 miles away from Peoria center
On 12/31/1934 at 18:45:56, a magnitude 7.1 (7.1 UK) earthquake occurred 213.9 miles away from Peoria center
On 10/15/1979 at 23:16:54, a magnitude 7.0 (5.7 MB, 6.9 MS, 7.0 ML, 6.4 MW) earthquake occurred 204.3 miles away from Peoria center
On 7/21/1952 at 11:52:14, a magnitude 7.7 (7.7 UK) earthquake occurred 396.5 miles away from Peoria center, causing $50,000,000 total damage
Magnitude types: body-wave magnitude (MB), local magnitude (ML), surface-wave magnitude (MS), moment magnitude (MW)
Natural disasters:
The number of natural disasters in Maricopa County (16) is near the US average (15).Major Disasters (Presidential) Declared: 11
Emergencies Declared: 1
Causes of natural disasters: Floods: 10, Storms: 9, Fires: 3, Flash Flood: 1, Heavy Rain: 1, Hurricane: 1, Tornado: 1, Wind: 1, Other: 1 (Note: some incidents may be assigned to more than one category).
Hospitals in Peoria:
- HOSPICE OF THE VALLEY - WEST (9720 W. PEORIA AVE, SUITE 128)
- SUN HEALTH HOSPICE (12740 N. PLAZA DEL RIO BLVD, SUITE A)
Nursing Homes in Peoria:
- FORUM AT DESERT HARBOR, THE (13840 NORTH DESERT HARBOR DRIVE)
- FREEDOM PLAZA CARE CENTER (13714 NORTH PLAZA DEL RIO BLVD)
- GOOD SAMARITAN SOCIETY-PEORIA GOOD SHEPHERD (10323 WEST OLIVE AVENUE)
- IMMANUEL CAMPUS OF CARE (11301 NORTH 99TH AVENUE)
- PLAZA DEL RIO CARE CENTER (13215 NORTH 94TH DRIVE)
- SIERRA WINDS (17300 NORTH 88TH AVE)
- SUN GROVE VILLAGE CARE CENTER (20625 NORTH LAKE PLEASANT ROAD)
Dialysis Facilities in Peoria:
Home Health Centers in Peoria:
Airports located in Peoria:
- Pleasant Valley Airport (P48) (Runways: 4, Itinerant Ops: 15,000, Local Ops: 40,000)
Amtrak stations near Peoria:
- 11 miles: PHOENIX NORTHWEST (PHOENIX, 8101 BLACK CANYON FWY.) - Bus Station . Services: public payphones, call for taxi service.
- 18 miles: PHOENIX (401 W. HARRISON ST.) - Bus Station . Services: ticket office, enclosed waiting area, public restrooms, public payphones, vending machines, free short-term parking, paid long-term parking, taxi stand.
College/University in Peoria:
Colleges/universities with over 2000 students nearest to Peoria:
- Arizona State University-West (about 7 miles; Glendale, AZ; Full-time enrollment: 3,454)
- Glendale Community College (about 7 miles; Glendale, AZ; FT enrollment: 12,533)
- Universal Technical Institute of Arizona Inc-Motorcycle Mechanics Institute Division (about 8 miles; Phoenix, AZ; FT enrollment: 2,976)
- Everest College-Phoenix (about 10 miles; Phoenix, AZ; FT enrollment: 2,008)
- Argosy University-Phoenix Online Division (about 11 miles; Phoenix, AZ; FT enrollment: 8,840)
- Grand Canyon University (about 12 miles; Phoenix, AZ; FT enrollment: 44,186)
- Estrella Mountain Community College (about 13 miles; Avondale, AZ; FT enrollment: 4,932)
Private elementary/middle schools in Peoria:
- RANCHO SOLANO PRIVATE SCHOOLS-HILLCREST CAMPUS (Students: 369, Location: 7877 W HILLCREST BLVD, Grades: PK-8)
- MONTESSORI KINGDOM OF LEARNING (Students: 97, Location: 13111 N 94TH DR, Grades: PK-8)
- CROSS OF GLORY LUTHERAN SCHOOL (Students: 96, Location: 10111 W JOMAX RD, Grades: PK-6)
- ZION'S DAYCARE & LEARNING CENTER (Students: 34, Location: 7643 W ACOMA DR, Grades: UG-4)
Points of interest:
Notable locations in Peoria: Lake Carl Pleasant (A), Peoria Substation (B), Lake Pleasant Inn (C), Agua Fria Steam Plant (D), Country Meadows Golf Course (E), Salt River Project Agua Fria Power Plant (F), Maricopa County Community Services (G), Peoria Public Library Sunrise Mountain Branch (H), Peoria Public Library Main Branch (I), Greenway Sports Complex (J), Peoria Town Hall (K), Peoria Fire Department Station 199 Pleasant Harbor Marina (L), Peoria Fire Department Station 197 (M), Peoria Fire Department Station 195 (N), Peoria Fire Department Station 194 (O), Peoria Fire Department Station 193 (P), Peoria Fire Department Station 192 (Q), Peoria Fire Department Station 191 (R), Peoria Police Department (S). Display/hide their locations on the map
Shopping Centers: Arrowhead Mall (1), Plaza de Alamos Shopping Center (2), Pueblo Plaza Shopping Center (3), Wagoner Plaza Shopping Center (4), Arrowhead Crossing Shopping Center (5), North Valley Power Center Shopping Center (6), Peoria Station Shopping Center (7), Peoria Town Center Shopping Center (8). Display/hide their locations on the map
Churches in Peoria include: Harvest Church Assembly of God (A), First Presbyterian Church of Peoria (B), Emmanuel Pentecostal Holiness Church (C), Discovery Pointe Church (D), Covenant Christian Center (E), Church at Cactus (F), Christ Church of the Valley (G), Celebration Lutheran Church (H), Calvary Baptist Church (I). Display/hide their locations on the map
Reservoirs: Lower Lake (A), Lake Pleasant (B), Bobs Tank (C), Caterpillar Tank (D). Display/hide their locations on the map
Streams, rivers, and creeks: Coles Wash (A), Morgan City Wash (B), Garfias Wash (C), French Creek (D), Castle Creek (E), Cottonwood Creek (F), Skunk Creek (G), Humbug Creek (H), Weir Wash (I). Display/hide their locations on the map
Parks in Peoria include: Varney Park (1), Murphy Park (2), Central Park (3), Braewood Park (4), Lake Pleasant Regional Park (5). Display/hide their locations on the map
Tourist attractions: Challenger Space Center (Museums; 21200 North 83rd Avenue) (1), Peoria Arizona Historical Society Inc (Museums; 10304 North 83rd Avenue) (2), Polar Ice (Amusement & Theme Parks; 15829 North 83rd Avenue) (3), Rollerplex (Amusement & Theme Parks; 16083 North 75th Avenue) (4), LAN Speed Games (Amusement & Theme Parks; 6750 West Peoria Avenue) (5), Desert Schools Coyotes Center (Amusement & Theme Parks; 15829 North 83rd Avenue) (6), Arizona Hot Air Repair (8355 West Camino De Oro) (7), Fox3Simulation (Arcades & Amusements; 9526 W. Hatcher) (8). Display/hide their approximate locations on the map
Hotels: La Quinta Phoenix Inn And Suites Peoria (16321 N 83rd Ave) (1), Hampton Inn Glendale-Peoria (8408 W Paradise Ln) (2), FlyHwnTrvl (6832 West Country Gables Drive) (3), Old Town Bed & Breakfast (8276 West Monroe Street) (4), Grand Inn Hotel (8955 West Grand Avenue) (5), Holiday Inn Express Hotel & Suites (16771 North 84th Avenue) (6), Extended Stay America - Peoria (7515 W Bell Rd) (7), Baymont Inns & Suites (16771 N 84th Ave) (8), Comfort Suites Peoria Sports Complex (8473 West Paradise Lane) (9). Display/hide their approximate locations on the map
Court: Peoria City - Courts- City Of Peoria Municipal Court (8401 West Monroe Street) (1). Display/hide its approximate location on the map
Birthplace of: Kyle Kosier - 2005 NFL player (Detroit Lions, born: Nov 27, 1978), Mary Peters (Secretary of Transportation) - 15th Secretary of Transportation, Tyler Schmitt - Football player.
Drinking water stations with addresses in Peoria and their reported violations in the past:
PEORIA CITY OF (Address: 8401 W MONROE ST , Population served: 124,500, Surface water):Past health violations:NEW RIVER UTILITY COMPANY INC (Address: 7839 W DEER VALLEY RD , Population served: 11,475, Groundwater):Past monitoring violations:
- MCL, Average - Between JUL-2005 and SEP-2005, Contaminant: Total Haloacetic Acids (HAA5). Follow-up actions: St Compliance achieved (DEC-06-2006)
- MCL, Average - Between APR-2005 and JUN-2005, Contaminant: Total Haloacetic Acids (HAA5). Follow-up actions: St Compliance achieved (DEC-06-2006)
- Monitoring and Reporting (DBP) - Between JAN-2009 and MAR-2009, Contaminant: Chlorine. Follow-up actions: St Compliance achieved (APR-30-2009)
- Monitoring and Reporting (DBP) - Between OCT-2008 and DEC-2008, Contaminant: Chlorine. Follow-up actions: St Compliance achieved (FEB-10-2009)
- Monitoring and Reporting (DBP) - Between JUL-2008 and SEP-2008, Contaminant: Chlorine. Follow-up actions: St Violation/Reminder Notice (OCT-20-2008), St Compliance achieved (NOV-07-2008)
- Monitoring and Reporting (DBP) - Between JAN-2008 and MAR-2008, Contaminant: Chlorine. Follow-up actions: St Compliance achieved (JUL-08-2008), St Violation/Reminder Notice (JUL-14-2008), St Compliance achieved (JUL-14-2008)
- Monitoring and Reporting (DBP) - Between OCT-2007 and DEC-2007, Contaminant: Chlorine. Follow-up actions: St Compliance achieved (MAR-20-2008)
- One minor monitoring violation
- 147 regular monitoring violations
- 9 other older monitoring violations
Past health violations:WILD HORSE WEST (Address: 8415 W CAREFREE HWY , Population served: 174, Groundwater):Past monitoring violations:
- MCL, Average - Between JUL-2010 and SEP-2010, Contaminant: Arsenic. Follow-up actions: St Compliance achieved (DEC-03-2010)
- MCL, Average - Between APR-2010 and JUN-2010, Contaminant: Arsenic. Follow-up actions: St Compliance achieved (DEC-03-2010)
- MCL, Average - Between JAN-2010 and MAR-2010, Contaminant: Arsenic. Follow-up actions: St AO (w/penalty) issued (JUN-17-2010), St Compliance achieved (DEC-03-2010)
- MCL, Average - Between OCT-2009 and DEC-2009, Contaminant: Arsenic. Follow-up actions: St AO (w/penalty) issued (JUN-17-2010), St Compliance achieved (DEC-03-2010)
- MCL, Single Sample - Between OCT-2009 and DEC-2009, Contaminant: Nitrite. Follow-up actions: St Compliance achieved (MAY-26-2010)
- MCL, Average - Between JUL-2009 and SEP-2009, Contaminant: Arsenic. Follow-up actions: St AO (w/penalty) issued (JUN-17-2010), St Compliance achieved (DEC-03-2010)
- 7 other older health violations
- Monitoring and Reporting (DBP) - Between JAN-2013 and MAR-2013, Contaminant: Chlorine. Follow-up actions: St Violation/Reminder Notice (AUG-19-2013)
- Monitoring and Reporting (DBP) - Between JAN-2010 and DEC-2010, Contaminant: TTHM. Follow-up actions: St Compliance achieved (OCT-17-2012)
- Monitoring and Reporting (DBP) - Between JAN-2010 and DEC-2010, Contaminant: Total Haloacetic Acids (HAA5). Follow-up actions: St Compliance achieved (OCT-17-2012)
- Monitoring and Reporting (DBP) - Between OCT-2009 and DEC-2009, Contaminant: Chlorine. Follow-up actions: St Violation/Reminder Notice (FEB-01-2010), St Compliance achieved (FEB-05-2010)
- Monitoring and Reporting (DBP) - Between JAN-2009 and DEC-2009, Contaminant: TTHM. Follow-up actions: St Compliance achieved (OCT-17-2012)
- 8 routine major monitoring violations
- 8 minor monitoring violations
- 80 regular monitoring violations
- 10 other older monitoring violations
Past monitoring violations:
- One regular monitoring violation
| This city: | 2.7 people |
| Arizona: | 2.6 people |
| This city: | 70.7% |
| Whole state: | 66.2% |
| This city: | 6.7% |
| Whole state: | 7.8% |
Likely homosexual households (counted as self-reported same-sex unmarried-partner households)
- Lesbian couples: 0.4% of all households
- Gay men: 0.3% of all households
People in group quarters in Peoria in 2010:
- 826 people in nursing facilities/skilled-nursing facilities
- 167 people in group homes intended for adults
- 108 people in other noninstitutional facilities
- 58 people in workers' group living quarters and job corps centers
- 42 people in group homes for juveniles (non-correctional)
- 26 people in residential treatment centers for adults
People in group quarters in Peoria in 2000:
- 855 people in nursing homes
- 365 people in other group homes
- 242 people in other noninstitutional group quarters
- 34 people in homes or halfway houses for drug/alcohol abuse
- 18 people in hospitals/wards and hospices for chronically ill
- 18 people in hospices or homes for chronically ill
Banks with most branches in Peoria (2011 data):
- JPMorgan Chase Bank, National Association: 12 branches. Info updated 2011/11/10: Bank assets: $1,811,678.0 mil, Deposits: $1,190,738.0 mil, headquarters in Columbus, OH, positive income, International Specialization, 5577 total offices, Holding Company: Jpmorgan Chase & Co.
- U.S. Bank National Association: North 83rd Avenue Safeway Branch, West Peoria Safeway Branch, Vistancia Boulevard Safeway Branch, Lake Pleasant Fry's Branch, Happy Valley & Lake Pleasant. Info updated 2012/01/30: Bank assets: $330,470.8 mil, Deposits: $236,091.5 mil, headquarters in Cincinnati, OH, positive income, 3121 total offices, Holding Company: U.S. Bancorp
- Compass Bank: 107th & Olive Branch, Lake Pleasant & Beardsley Branch, 75th & Thunderbird Branch, 83rd/Deer Valley Kbc Branch. Info updated 2011/02/24: Bank assets: $63,107.0 mil, Deposits: $46,232.4 mil, headquarters in Birmingham, AL, negative income in the last year, Commercial Lending Specialization, 720 total offices, Holding Company: Banco Bilbao Vizcaya Argentaria, S.A.
- Wells Fargo Bank, National Association: 83rd & Lake Pleasant Branch, 99th And Beardsley Branch, 75th & Cactus Branch, Happy Valley & Lake Pleasant Branch. Info updated 2011/04/05: Bank assets: $1,161,490.0 mil, Deposits: $905,653.0 mil, headquarters in Sioux Falls, SD, positive income, 6395 total offices, Holding Company: Wells Fargo & Company
- Meridian Bank, National Association: Arrowhead Branch at 7655 West Thunderbird Road, branch established on 1982/08/02. Info updated 2011/04/29: Bank assets: $971.9 mil, Deposits: $709.7 mil, headquarters in Wickenburg, AZ, positive income, Commercial Lending Specialization, 7 total offices, Holding Company: Marquette Financial Companies
- MidFirst Bank: Lake Pleasant Branch at 24810 North Lake Pleasant Parkway, branch established on 2009/04/06. Info updated 2011/07/21: Bank assets: $9,790.2 mil, Deposits: $6,308.2 mil, headquarters in Oklahoma City, OK, positive income, Commercial Lending Specialization, 77 total offices
- Bank of America, National Association: Lake Pleasant Towne Center Branch at 25260 North Lake Pleasant Pkwy, branch established on 2007/12/21. Info updated 2009/11/18: Bank assets: $1,451,969.3 mil, Deposits: $1,077,176.8 mil, headquarters in Charlotte, NC, positive income, 5782 total offices, Holding Company: Bank Of America Corporation
- TCF National Bank: 75th & Cactus Road Branch at 7570 West Cactus Road, branch established on 2007/10/23. Info updated 2009/11/23: Bank assets: $19,007.0 mil, Deposits: $12,377.0 mil, headquarters in Sioux Falls, SD, positive income, Commercial Lending Specialization, 441 total offices, Holding Company: Tcf Financial Corporation
- Gold Canyon Bank: Olive Business Park Branch at 9299 W. Olive Ave., Suite #601, branch established on 2007/11/05. Info updated 2006/05/04: Bank assets: $59.9 mil, Deposits: $57.3 mil, headquarters in Gold Canyon, AZ, negative income in the last year, Commercial Lending Specialization, 2 total offices
- 4 other banks with 4 local branches
For population 15 years and over in Peoria:
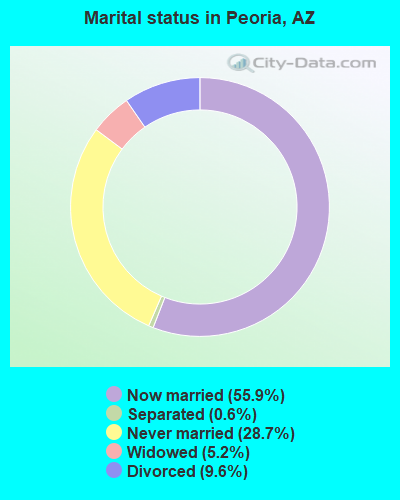
- Never married: 28.7%
- Now married: 55.9%
- Separated: 0.6%
- Widowed: 5.2%
- Divorced: 9.6%
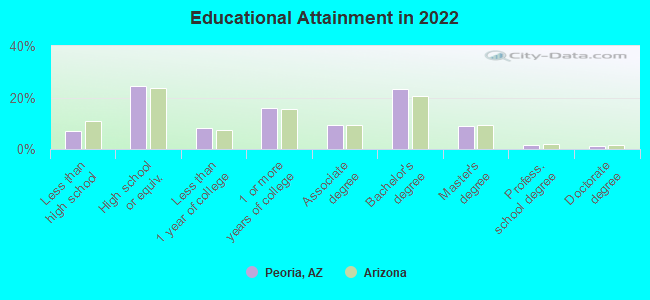
For population 25 years and over in Peoria:
- High school or higher: 93.2%
- Bachelor's degree or higher: 35.2%
- Graduate or professional degree: 11.8%
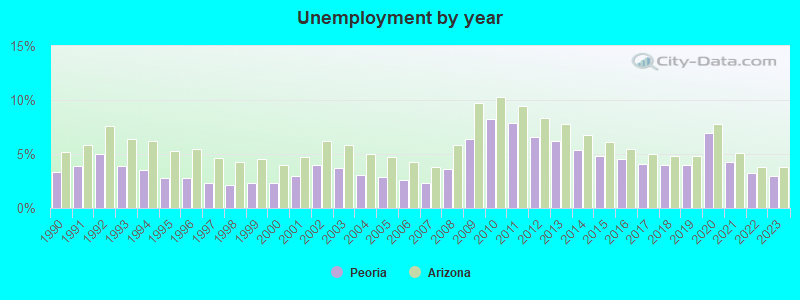
- Unemployed: 3.9%
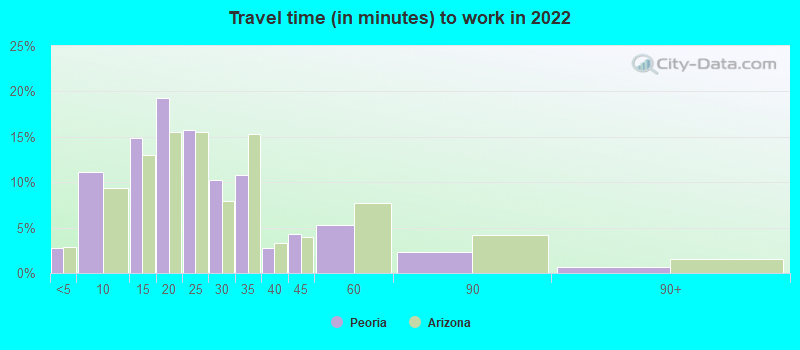
- Mean travel time to work (commute): 21.5 minutes
| Here: | 10.8 |
| Arizona average: | 12.2 |
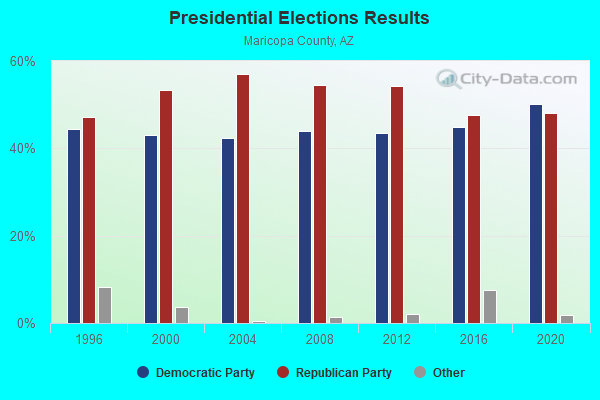
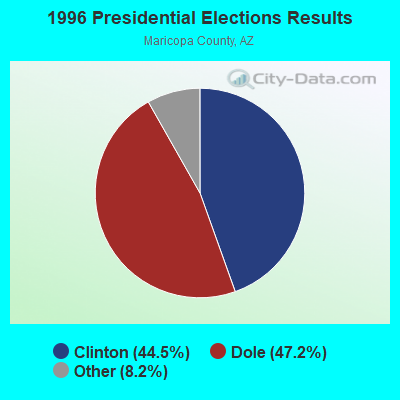
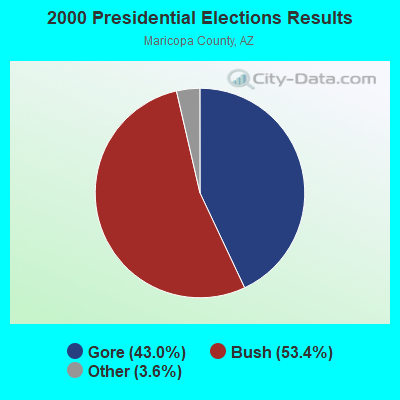
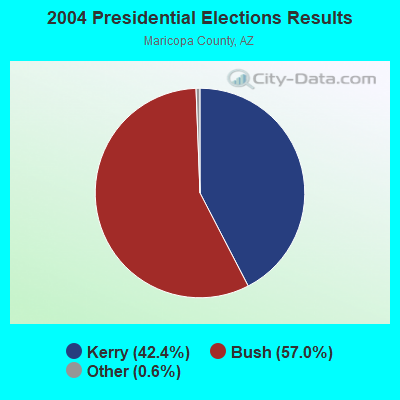
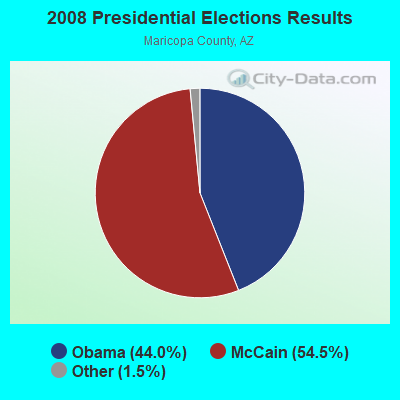
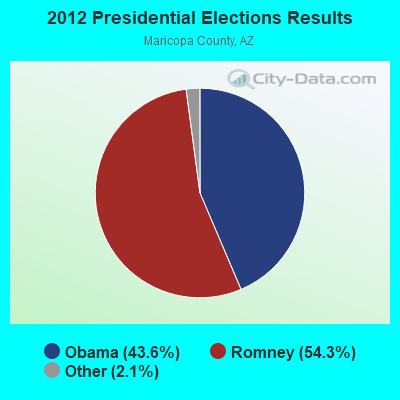
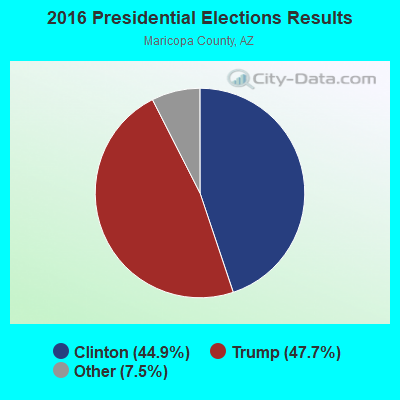
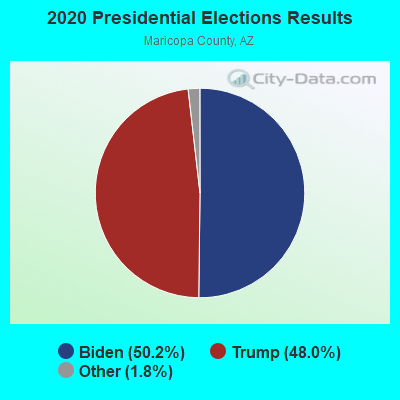
Graphs represent county-level data. Detailed 2008 Election Results
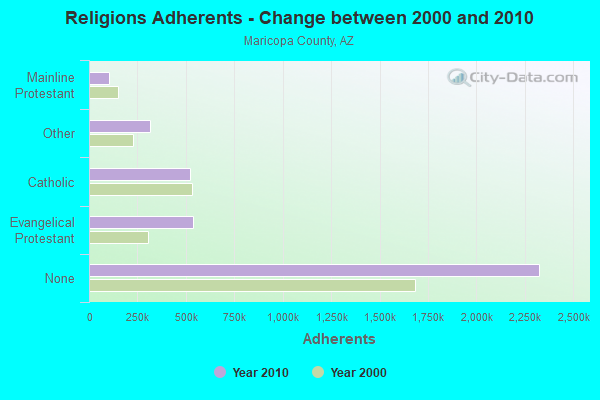
Religion statistics for Peoria, AZ (based on Maricopa County data)
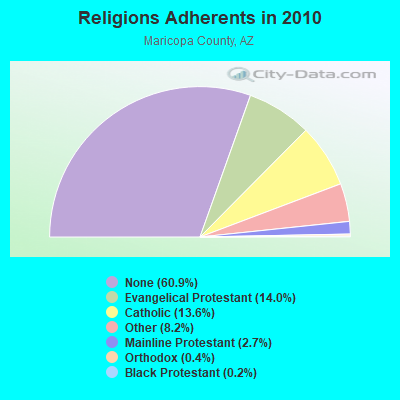
| Religion | Adherents | Congregations |
|---|---|---|
| Evangelical Protestant | 534,453 | 1,206 |
| Catholic | 520,651 | 100 |
| Other | 312,574 | 680 |
| Mainline Protestant | 104,145 | 241 |
| Orthodox | 13,379 | 24 |
| Black Protestant | 6,278 | 48 |
| None | 2,325,637 | - |
Food Environment Statistics:
| This county: | 1.30 / 10,000 pop. |
| State: | 1.36 / 10,000 pop. |
| Maricopa County: | 0.16 / 10,000 pop. |
| State: | 0.14 / 10,000 pop. |
| This county: | 0.57 / 10,000 pop. |
| Arizona: | 0.55 / 10,000 pop. |
| Maricopa County: | 1.99 / 10,000 pop. |
| Arizona: | 2.47 / 10,000 pop. |
| Here: | 5.86 / 10,000 pop. |
| Arizona: | 6.21 / 10,000 pop. |
| Maricopa County: | 7.7% |
| Arizona: | 8.0% |
| This county: | 22.5% |
| Arizona: | 22.8% |
| Maricopa County: | 14.8% |
| State: | 14.2% |
Health and Nutrition:
| Peoria: | 51.4% |
| State: | 49.0% |
| This city: | 50.1% |
| Arizona: | 47.3% |
| Peoria: | 28.6 |
| Arizona: | 28.5 |
| Here: | 20.0% |
| Arizona: | 20.8% |
| Peoria: | 9.9% |
| Arizona: | 10.2% |
| This city: | 6.8 |
| Arizona: | 6.8 |
| Peoria: | 34.9% |
| State: | 33.5% |
| Peoria: | 58.1% |
| Arizona: | 56.1% |
| Peoria: | 79.8% |
| Arizona: | 79.4% |
More about Health and Nutrition of Peoria, AZ Residents
| Local government employment and payroll (March 2022) | |||||
| Function | Full-time employees | Monthly full-time payroll | Average yearly full-time wage | Part-time employees | Monthly part-time payroll |
|---|---|---|---|---|---|
| Police Protection - Officers | 210 | $1,716,985 | $98,113 | 0 | $0 |
| Firefighters | 209 | $1,798,408 | $103,258 | 1 | $3,211 |
| Parks and Recreation | 124 | $645,486 | $62,466 | 277 | $249,097 |
| Other Government Administration | 114 | $803,756 | $84,606 | 9 | $27,742 |
| Financial Administration | 105 | $665,266 | $76,030 | 0 | $0 |
| Police - Other | 85 | $630,315 | $88,986 | 0 | $0 |
| Streets and Highways | 68 | $480,582 | $84,809 | 0 | $0 |
| Water Supply | 67 | $416,942 | $74,676 | 0 | $0 |
| Solid Waste Management | 59 | $288,260 | $58,629 | 0 | $0 |
| Judicial and Legal | 48 | $320,766 | $80,192 | 2 | $5,378 |
| Other and Unallocable | 47 | $224,637 | $57,354 | 0 | $0 |
| Sewerage | 34 | $204,936 | $72,330 | 0 | $0 |
| Local Libraries | 29 | $140,935 | $58,318 | 10 | $11,392 |
| Transit | 11 | $47,690 | $52,025 | 1 | $407 |
| Fire - Other | 7 | $44,177 | $75,732 | 0 | $0 |
| Totals for Government | 1,217 | $8,429,140 | $83,114 | 300 | $297,227 |
Peoria government finances - Expenditure in 2021 (per resident):
- Construction - Water Utilities: $25,710,000 ($129.94)
Regular Highways: $17,314,000 ($87.50)
Sewerage: $8,173,000 ($41.31)
Parks and Recreation: $3,101,000 ($15.67)
Solid Waste Management: $2,984,000 ($15.08)
General - Other: $1,969,000 ($9.95)
- Current Operations - Police Protection: $56,415,000 ($285.12)
Local Fire Protection: $36,208,000 ($182.99)
Regular Highways: $33,928,000 ($171.47)
Parks and Recreation: $30,810,000 ($155.71)
Water Utilities: $28,352,000 ($143.29)
General - Other: $16,428,000 ($83.03)
Sewerage: $15,599,000 ($78.84)
Solid Waste Management: $14,262,000 ($72.08)
Financial Administration: $13,482,000 ($68.14)
Central Staff Services: $11,786,000 ($59.57)
Judicial and Legal Services: $6,913,000 ($34.94)
Libraries: $5,705,000 ($28.83)
General Public Buildings: $5,112,000 ($25.84)
Protective Inspection and Regulation - Other: $3,551,000 ($17.95)
- General - Interest on Debt: $1,381,000 ($6.98)
- Other Capital Outlay - General - Other: $253,000 ($1.28)
- Total Salaries and Wages: $39,279,000 ($198.51)
Peoria government finances - Revenue in 2021 (per resident):
- Charges - Other: $35,743,000 ($180.64)
Sewerage: $25,722,000 ($130.00)
Solid Waste Management: $14,202,000 ($71.78)
Parks and Recreation: $11,293,000 ($57.07)
Regular Highways: $416,000 ($2.10)
- Miscellaneous - Interest Earnings: $3,499,000 ($17.68)
General Revenue - Other: $2,874,000 ($14.52)
Fines and Forfeits: $1,532,000 ($7.74)
Rents: $803,000 ($4.06)
Special Assessments: $335,000 ($1.69)
- Revenue - Water Utilities: $47,055,000 ($237.81)
- State Intergovernmental - General Local Government Support: $47,857,000 ($241.87)
Other: $18,425,000 ($93.12)
Highways: $12,034,000 ($60.82)
- Tax - General Sales and Gross Receipts: $113,380,000 ($573.01)
Property: $29,318,000 ($148.17)
Public Utilities Sales: $6,372,000 ($32.20)
Other License: $5,826,000 ($29.44)
Peoria government finances - Debt in 2021 (per resident):
- Long Term Debt - Beginning Outstanding - Public Debt for Private Purpose: $35,315,000 ($178.48)
Outstanding Nonguaranteed - Industrial Revenue: $32,685,000 ($165.19)
Retired Nonguaranteed - Public Debt for Private Purpose: $2,630,000 ($13.29)
Peoria government finances - Cash and Securities in 2021 (per resident):
- Bond Funds - Cash and Securities: $78,463,000 ($396.55)
- Other Funds - Cash and Securities: $392,138,000 ($1981.84)
- Sinking Funds - Cash and Securities: $126,928,000 ($641.48)
5.80% of this county's 2021 resident taxpayers lived in other counties in 2020 ($92,013 average adjusted gross income)
| Here: | 5.80% |
| Arizona average: | 6.85% |
0.02% of residents moved from foreign countries ($227 average AGI)
Maricopa County: 0.02% Arizona average: 0.03%
Top counties from which taxpayers relocated into this county between 2020 and 2021:
| from Pinal County, AZ | |
| from Los Angeles County, CA | |
| from Pima County, AZ |
5.04% of this county's 2020 resident taxpayers moved to other counties in 2021 ($76,911 average adjusted gross income)
| Here: | 5.04% |
| Arizona average: | 5.72% |
0.02% of residents moved to foreign countries ($234 average AGI)
Maricopa County: 0.02% Arizona average: 0.03%
Top counties to which taxpayers relocated from this county between 2020 and 2021:
| to Pinal County, AZ | |
| to Pima County, AZ | |
| to Yavapai County, AZ |
| Businesses in Peoria, AZ | ||||
| Name | Count | Name | Count | |
|---|---|---|---|---|
| 7-Eleven | 1 | LA Fitness | 2 | |
| 99 Cents Only Stores | 1 | La Quinta | 1 | |
| AMF Bowling | 1 | Lane Bryant | 1 | |
| Albertsons | 2 | Lane Furniture | 1 | |
| Applebee's | 1 | LensCrafters | 1 | |
| Arby's | 2 | Little Caesars Pizza | 1 | |
| Audi | 1 | Long John Silver's | 2 | |
| AutoZone | 3 | Lowe's | 2 | |
| Barnes & Noble | 1 | Marriott | 1 | |
| Baskin-Robbins | 2 | Marshalls | 1 | |
| Bath & Body Works | 2 | MasterBrand Cabinets | 5 | |
| Bed Bath & Beyond | 1 | Mazda | 1 | |
| Big O Tires | 1 | McDonald's | 8 | |
| Blockbuster | 4 | Men's Wearhouse | 3 | |
| Burger King | 3 | New Balance | 6 | |
| CVS | 6 | Nike | 5 | |
| Carl\s Jr. | 2 | Nissan | 1 | |
| Catherines | 1 | Nordstrom | 1 | |
| Chevrolet | 1 | OfficeMax | 1 | |
| Chick-Fil-A | 1 | Old Navy | 1 | |
| Chico's | 1 | Olive Garden | 1 | |
| Chipotle | 2 | On The Border | 1 | |
| Church's Chicken | 1 | Panda Express | 5 | |
| Circle K | 13 | Papa John's Pizza | 1 | |
| Cold Stone Creamery | 2 | Payless | 2 | |
| Comfort Suites | 1 | Penske | 2 | |
| Cracker Barrel | 1 | PetSmart | 2 | |
| Cricket Wireless | 2 | Pier 1 Imports | 2 | |
| Curves | 2 | Pizza Hut | 2 | |
| Dairy Queen | 2 | Popeyes | 1 | |
| Dennys | 2 | Quiznos | 1 | |
| Discount Tire | 4 | RadioShack | 3 | |
| Domino's Pizza | 3 | Ramada | 1 | |
| DressBarn | 1 | Red Lobster | 1 | |
| Dressbarn | 1 | Red Robin | 1 | |
| Dunkin Donuts | 2 | SONIC Drive-In | 3 | |
| El Pollo Loco | 1 | Safeway | 4 | |
| Extended Stay America | 1 | Sears | 1 | |
| Famous Footwear | 2 | Staples | 2 | |
| Fashion Bug | 1 | Starbucks | 7 | |
| FedEx | 10 | Subaru | 1 | |
| Firestone Complete Auto Care | 1 | Subway | 11 | |
| Ford | 1 | T-Mobile | 8 | |
| GNC | 2 | T.J.Maxx | 1 | |
| GameStop | 2 | Taco Bell | 5 | |
| H&R Block | 8 | Target | 2 | |
| Hilton | 1 | The Cheesecake Factory | 1 | |
| Hobby Lobby | 1 | Toyota | 1 | |
| Holiday Inn | 1 | U-Haul | 5 | |
| Home Depot | 2 | UPS | 13 | |
| Honda | 1 | Vans | 1 | |
| IHOP | 2 | Verizon Wireless | 2 | |
| JCPenney | 1 | Victoria's Secret | 1 | |
| Jack In The Box | 5 | Village Inn | 1 | |
| Jamba Juice | 1 | Volkswagen | 1 | |
| Jones New York | 1 | Vons | 4 | |
| Justice | 1 | Walgreens | 8 | |
| KFC | 4 | Walmart | 2 | |
| Kohl's | 1 | Wendy's | 1 | |
| Kroger | 4 | |||
Strongest AM radio stations in Peoria:
- KPXQ (1360 AM; 50 kW; GLENDALE, AZ; Owner: COMMON GROUND BROADCASTING, INC.)
- KFNX (1100 AM; 50 kW; CAVE CREEK, AZ; Owner: NORTH AMERICAN BROADCASTING CO., INC.)
- KXEM (1010 AM; 15 kW; TOLLESON, AZ; Owner: JAMES CRYSTAL ENTERPRISES OF PHOENIX, INC.)
- KMIA (710 AM; 50 kW; BLACK CANYON CITY, AZ; Owner: ENTRAVISION HOLDINGS, LLC)
- KFNN (1510 AM; 22 kW; MESA, AZ; Owner: CRC BROADCASTING COMPANY, INC.)
- KGME (910 AM; 5 kW; PHOENIX, AZ; Owner: AMFM RADIO LICENSES, L.L.C.)
- KMIK (1580 AM; 50 kW; TEMPE, AZ; Owner: ABC, INC.)
- KKNT (960 AM; 5 kW; PHOENIX, AZ; Owner: COMMON GROUND BROADCASTING, INC)
- KTAR (620 AM; 5 kW; PHOENIX, AZ; Owner: EMMIS RADIO LICENSE CORPORATION)
- KMYL (1190 AM; 5 kW; TOLLESON, AZ; Owner: INTERSTATE B/C SYSTEM OF AZ, INC.)
- KFYI (550 AM; 5 kW; PHOENIX, AZ; Owner: AMFM RADIO LICENSES, L.L.C.)
- KASA (1540 AM; 10 kW; PHOENIX, AZ; Owner: KASA RADIO HOGAR, INC.)
- KXEG (1280 AM; 2 kW; PHOENIX, AZ; Owner: MORTENSON BROADCASTING COMPANY OF ARIZONA, LLC)
Strongest FM radio stations in Peoria:
- KOMR (106.3 FM; SUN CITY, AZ; Owner: HBC LICENSE CORPORATION)
- KMLE (107.9 FM; CHANDLER, AZ; Owner: INFINITY RADIO OPERATIONS INC.)
- KLNZ (103.5 FM; GLENDALE, AZ; Owner: ENTRAVISION HOLDINGS, LLC)
- KNAI (88.3 FM; PHOENIX, AZ; Owner: NATIONAL FARM WORKERS SERVICE CENTER)
- KBAQ (89.5 FM; PHOENIX, AZ; Owner: MARICOPA COUNTY COMMUNITY COLLEGE DISTRICT)
- K205CI (88.9 FM; PHOENIX, AZ; Owner: FAMILY STATIONS, INC.)
- K248AL (97.5 FM; PHOENIX, AZ; Owner: ZORBA RESOURCES, INC.)
- KSLX-FM (100.7 FM; SCOTTSDALE, AZ; Owner: CACTUS RADIO, INC.)
- KKLT (98.7 FM; PHOENIX, AZ; Owner: EMMIS RADIO LICENSE CORPORATION)
- KZON (101.5 FM; PHOENIX, AZ; Owner: INFINITY RADIO OPERATIONS INC.)
- KKFR (92.3 FM; GLENDALE, AZ; Owner: EMMIS RADIO LICENSE CORPORATION)
- KESZ (99.9 FM; PHOENIX, AZ; Owner: CLEAR CHANNEL BROADCASTING LICENSES, INC.)
- KOOL-FM (94.5 FM; PHOENIX, AZ; Owner: INFINITY RADIO OPERATIONS INC.)
- KNIX-FM (102.5 FM; PHOENIX, AZ; Owner: CLEAR CHANNEL BROADCASTING LICENSES, INC.)
- KUPD (97.9 FM; TEMPE, AZ; Owner: TEMPE RADIO, INC.)
- KPHF (88.3 FM; PHOENIX, AZ; Owner: FAMILY STATIONS, INC.)
- KJZZ (91.5 FM; PHOENIX, AZ; Owner: MARICOPA COUNTY COMM. COLLEGE DIST.)
- KFLR-FM (90.3 FM; PHOENIX, AZ; Owner: FAMILY LIFE BROADCASTING, INC.)
- KYOT-FM (95.5 FM; PHOENIX, AZ; Owner: AMFM RADIO LICENSES, L.L.C.)
- KMXP (96.9 FM; PHOENIX, AZ; Owner: CITICASTERS LICENSES, L.P.)
TV broadcast stations around Peoria:
- K43GV (Channel 43; PHOENIX, AZ; Owner: TELEVISION APOGEO DE PHOENIX, LLC)
- KAET (Channel 8; PHOENIX, AZ; Owner: ARIZONA BOARD OF REGENTS)
- K55EH (Channel 55; PHOENIX, AZ; Owner: KAZT, L.L.C.)
- KPHO-TV (Channel 5; PHOENIX, AZ; Owner: MEREDITH CORPORATION)
- KPPX (Channel 51; TOLLESON, AZ; Owner: AMERICA 51, L.P.)
- K25DM (Channel 25; PHOENIX, AZ; Owner: KDMA CHANNEL 25, INC.)
- KUTP (Channel 45; PHOENIX, AZ; Owner: FOX TELEVISION STATIONS, INC.)
- KPNX (Channel 12; MESA, AZ; Owner: MULTIMEDIA HOLDINGS CORPORATION)
- KSAZ-TV (Channel 10; PHOENIX, AZ; Owner: KSAZ LICENSE, INC.)
- KASW (Channel 61; PHOENIX, AZ; Owner: KASW-TV, INC.)

- National Bridge Inventory (NBI) Statistics
- 177Number of bridges
- 2,395ft / 730mTotal length
- $44,000Total costs
- 3,315,078Total average daily traffic
- 243,584Total average daily truck traffic
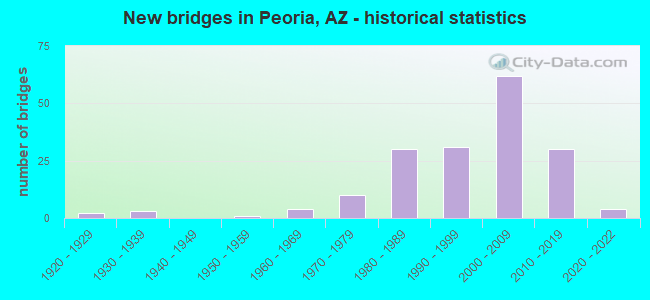
- New bridges - historical statistics
- 21920-1929
- 31930-1939
- 11950-1959
- 41960-1969
- 101970-1979
- 301980-1989
- 311990-1999
- 622000-2009
- 302010-2019
- 42020-2022
FCC Registered Antenna Towers: 286 (See the full list of FCC Registered Antenna Towers)
FCC Registered Private Land Mobile Towers: 1 (See the full list of FCC Registered Private Land Mobile Towers in Peoria, AZ)
FCC Registered Broadcast Land Mobile Towers: 70 (See the full list of FCC Registered Broadcast Land Mobile Towers)
FCC Registered Microwave Towers: 97 (See the full list of FCC Registered Microwave Towers in this town)
FCC Registered Paging Towers: 3 (See the full list of FCC Registered Paging Towers)
FCC Registered Maritime Coast & Aviation Ground Towers: 5 (See the full list of FCC Registered Maritime Coast & Aviation Ground Towers)
FCC Registered Amateur Radio Licenses: 862 (See the full list of FCC Registered Amateur Radio Licenses in Peoria)
FAA Registered Aircraft Manufacturers and Dealers: 1 (See the full list of FAA Registered Manufacturers and Dealers in Peoria)
FAA Registered Aircraft: 169 (See the full list of FAA Registered Aircraft)
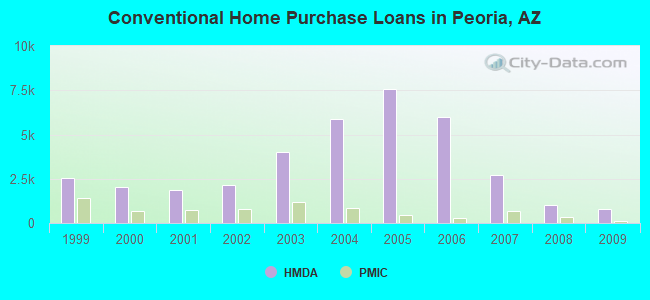
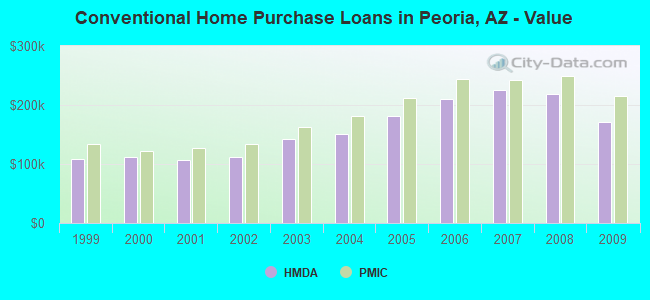
| Home Mortgage Disclosure Act Aggregated Statistics For Year 2009 (Based on 15 full and 14 partial tracts) | ||||||||||||||
| A) FHA, FSA/RHS & VA Home Purchase Loans | B) Conventional Home Purchase Loans | C) Refinancings | D) Home Improvement Loans | E) Loans on Dwellings For 5+ Families | F) Non-occupant Loans on < 5 Family Dwellings (A B C & D) | G) Loans On Manufactured Home Dwelling (A B C & D) | ||||||||
|---|---|---|---|---|---|---|---|---|---|---|---|---|---|---|
| Number | Average Value | Number | Average Value | Number | Average Value | Number | Average Value | Number | Average Value | Number | Average Value | Number | Average Value | |
| LOANS ORIGINATED | 1,298 | $160,407 | 805 | $170,418 | 2,262 | $183,781 | 53 | $92,337 | 1 | $19,092,090 | 384 | $132,281 | 18 | $116,162 |
| APPLICATIONS APPROVED, NOT ACCEPTED | 70 | $155,684 | 72 | $162,207 | 272 | $187,816 | 16 | $80,708 | 0 | $0 | 32 | $133,200 | 7 | $39,071 |
| APPLICATIONS DENIED | 186 | $161,778 | 139 | $189,958 | 1,064 | $209,751 | 76 | $54,853 | 0 | $0 | 113 | $146,447 | 15 | $63,926 |
| APPLICATIONS WITHDRAWN | 137 | $166,519 | 110 | $198,643 | 585 | $197,195 | 19 | $112,322 | 0 | $0 | 55 | $148,916 | 7 | $103,109 |
| FILES CLOSED FOR INCOMPLETENESS | 33 | $140,115 | 20 | $197,058 | 114 | $196,913 | 5 | $104,950 | 0 | $0 | 8 | $135,702 | 0 | $0 |
Detailed mortgage data for all 29 tracts in Peoria, AZ
| Private Mortgage Insurance Companies Aggregated Statistics For Year 2009 (Based on 15 full and 11 partial tracts) | ||||||
| A) Conventional Home Purchase Loans | B) Refinancings | C) Non-occupant Loans on < 5 Family Dwellings (A & B) | ||||
|---|---|---|---|---|---|---|
| Number | Average Value | Number | Average Value | Number | Average Value | |
| LOANS ORIGINATED | 140 | $214,492 | 36 | $228,455 | 9 | $185,870 |
| APPLICATIONS APPROVED, NOT ACCEPTED | 42 | $225,650 | 17 | $219,223 | 2 | $202,360 |
| APPLICATIONS DENIED | 25 | $236,948 | 14 | $229,696 | 3 | $260,390 |
| APPLICATIONS WITHDRAWN | 7 | $150,914 | 5 | $209,328 | 1 | $93,440 |
| FILES CLOSED FOR INCOMPLETENESS | 6 | $213,907 | 2 | $163,820 | 2 | $146,230 |
2003 - 2018 National Fire Incident Reporting System (NFIRS) incidents
- Fire incident types reported to NFIRS in Peoria, AZ
- 1,03032.3%Other
- 99031.0%Outside Fires
- 70122.0%Structure Fires
- 46814.7%Mobile Property/Vehicle Fires
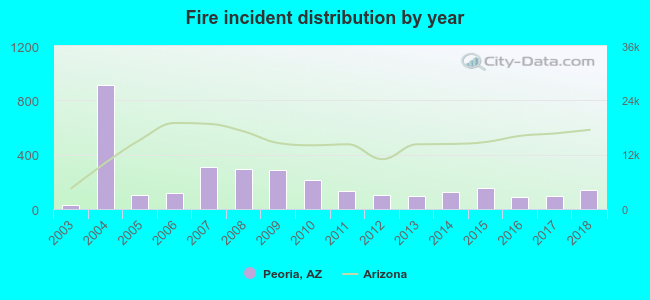 Based on the data from the years 2003 - 2018 the average number of fires per year is 199. The highest number of fires - 910 took place in 2004, and the least - 30 in 2003. The data has a rising trend.
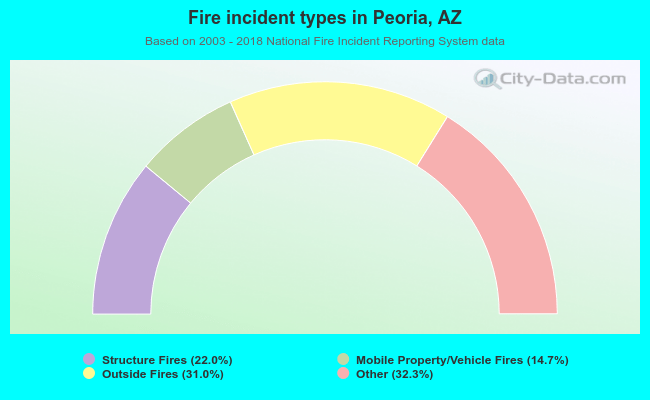 When looking into fire subcategories, the most reports belonged to: Other (32.3%), and Outside Fires (31.0%).
Fire-safe hotels and motels in Peoria, Arizona:
- La Quinta Inn & Suites-peoria, 16321 N 83RD St, Peoria, Arizona 85044 , Phone: (602) 487-1900
- Comfort Suites Peoria, 8473 W Paradise Ln, Peoria, Arizona 85382 , Phone: (623) 334-3993
- Extended Stay America - Phoenix - Peoria, 7345 W Bell Rd, Peoria, Arizona 85382 , Phone: (623) 487-0020, Fax: (623) 487-0022
- Holiday Inn Express & Suites Peoria/North Glendale, 16771 N 84th Ave, Peoria, Arizona 85382 , Phone: (623) 853-1313, Fax: (623) 853-8888
- Value Place Peoria, 8949 W Sweetwater Ave, Peoria, Arizona 85381 , Phone: (623) 486-2345
- Days Hotel Peoria, 8955 NW Grand Ave, Peoria, Arizona 85345 , Phone: (623) 979-7200, Fax: (623) 979-7705
- Cibola Vista Resort And Spa, 27501 N Lk Pleasant Pkwy, Peoria, Arizona 85383 , Phone: (623) 889-6700
| Most common first names in Peoria, AZ among deceased individuals | ||
| Name | Count | Lived (average) |
|---|---|---|
| Robert | 354 | 75.1 years |
| John | 351 | 77.1 years |
| Mary | 347 | 82.3 years |
| William | 298 | 76.8 years |
| James | 245 | 74.6 years |
| Helen | 221 | 84.6 years |
| Dorothy | 217 | 81.9 years |
| Charles | 203 | 76.3 years |
| Margaret | 167 | 81.2 years |
| George | 164 | 78.5 years |
| Most common last names in Peoria, AZ among deceased individuals | ||
| Last name | Count | Lived (average) |
|---|---|---|
| Smith | 152 | 79.5 years |
| Johnson | 116 | 77.3 years |
| Brown | 88 | 77.8 years |
| Williams | 71 | 76.6 years |
| Wilson | 64 | 78.0 years |
| Miller | 64 | 79.9 years |
| Jones | 58 | 78.6 years |
| Anderson | 53 | 81.1 years |
| Davis | 50 | 78.9 years |
| Taylor | 44 | 74.1 years |
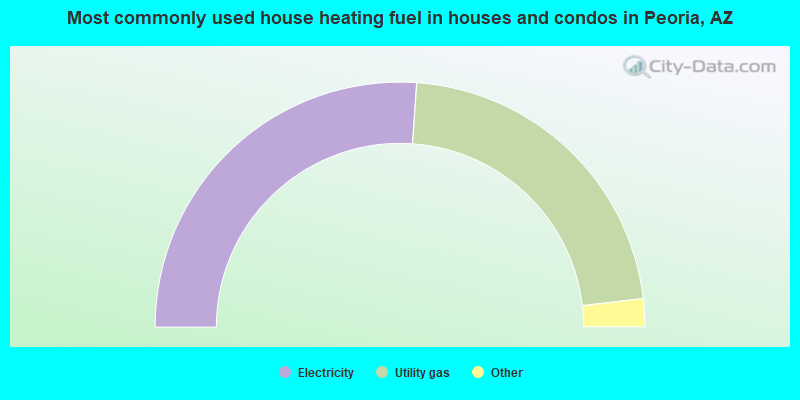
- 52.2%Electricity
- 44.1%Utility gas
- 1.6%Solar energy
- 1.3%Bottled, tank, or LP gas
- 0.5%No fuel used
- 0.3%Other fuel
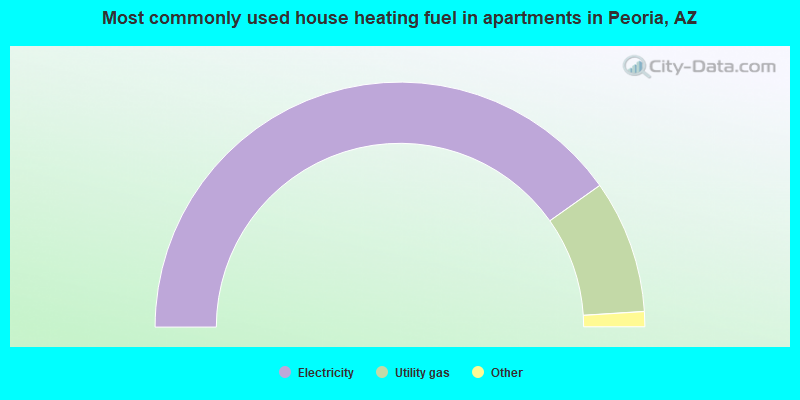
- 80.4%Electricity
- 17.6%Utility gas
- 1.4%No fuel used
- 0.4%Bottled, tank, or LP gas
- 0.1%Solar energy
Peoria compared to Arizona state average:
- Unemployed percentage significantly below state average.
- Median age above state average.
- Foreign-born population percentage above state average.
- Length of stay since moving in below state average.
- House age below state average.
- Percentage of population with a bachelor's degree or higher above state average.
Peoria, AZ compared to other similar cities:
Peoria on our top lists:
- #2 on the list of "Top 101 cities with the hottest summers (population 50,000+)"
- #6 on the list of "Top 101 cities with the highest daily high temperatures (population 50,000+)"
- #7 on the list of "Top 101 cities with the highest number of days clear of clouds (population 50,000+)"
- #7 on the list of "Top 101 cities with the lowest number of days clear of clouds (population 50,000+)"
- #7 on the list of "Top 101 cities with the highest average sunshine amount (population 50,000+)"
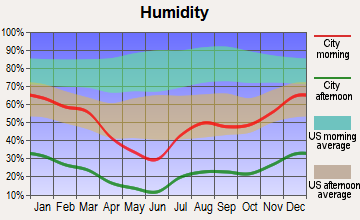
- #15 on the list of "Top 101 cities with the lowest minimum monthly morning or afternoon humidity (population 50,000+)"
- #16 on the list of "Top 101 cities with the lowest average humidity (population 50,000+)"
- #22 on the list of "Top 100 high-educated but low-earning cities (pop. 50,000+)"
- #26 on the list of "Top 101 cities with largest percentage population increases in the 1990s) (population 50,000+)"
- #29 on the list of "Top 101 cities with the lowest maximum monthly morning or afternoon humidity (population 50,000+)"
- #32 on the list of "Top 101 cities with largest percentage of males in occupations: sales and related occupations (population 50,000+)"
- #38 on the list of "Top 101 cities that people commute from (largest negative percentage daily daytime population change due to commuting) (population 50,000+)"
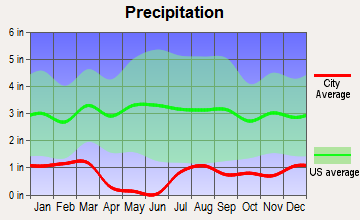
- #40 on the list of "Top 101 cities with the lowest average yearly precipitation (population 50,000+)"
- #42 on the list of "Top 101 cities with the smallest racial income disparities between White and Black householders (with at least 2,000 householders)"
- #44 on the list of "Top 101 cities with largest percentage of females in occupations: office and administrative support occupations (population 50,000+)"
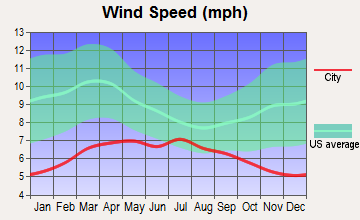
- #46 on the list of "Top 101 cities with the lowest average wind speeds (population 50,000+)"
- #48 on the list of "Top 100 cities with newest houses (pop. 50,000+)"
- #50 on the list of "Top 101 cities with the smallest precipitation differences during a year (population 50,000+)"
- #50 on the list of "Top 101 cities with largest percentage of females in industries: finance and insurance (population 50,000+)"
- #51 on the list of "Top 101 cities with the most people born in other U.S. states (population 50,000+)"
- #3 (85351) on the list of "Top 101 zip codes with the smallest percentage of returns reporting salary or wage in 2012 (pop 5,000+)"
- #2 on the list of "Top 101 counties with the highest Nitrogen Dioxide air pollution readings in 2012 (ppm)"
- #3 on the list of "Top 101 counties with the highest total withdrawal of fresh water for public supply"
- #3 on the list of "Top 101 counties with the highest surface withdrawal of fresh water for public supply"
- #4 on the list of "Top 101 counties with the most Other congregations"
- #5 on the list of "Top 101 counties with the most Evangelical Protestant adherents (pop. 50,000+)"

|
|
Total of 845 patent applications in 2008-2024.