Glendale, Arizona
Glendale: Jobing.com Arena - Home of the Phoenix Coyotes (July 2006; 112F)
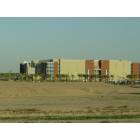
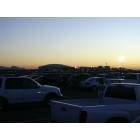
Glendale: I think this is in Glendale

Glendale: Glitter and Glow
Glendale: Glendale Community college
Glendale: Summer Sky outside the new Cardinals stadium, Glendale AZ
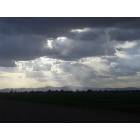
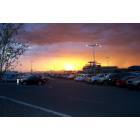
Glendale: Looking west over glenale at sunset
Glendale: Glendale's 'Westgate' sports/entertainment district.

Glendale: Univeristy of Phoenix Stadium, Gate 2
Glendale: 67th Avenue & Bethany Home
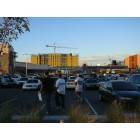
Glendale: Westgate Construction
Glendale: From a Rooftop in Glendale
- add
your
Submit your own pictures of this city and show them to the world
- OSM Map
- General Map
- Google Map
- MSN Map
Population change since 2000: +15.2%
 |
| Males: 124,228 | |
| Females: 127,908 |
| Median resident age: | 33.9 years |
| Arizona median age: | 38.8 years |
Zip codes: 85031, 85033, 85301, 85302, 85303, 85304, 85305, 85306, 85308, 85309, 85310, 85345, 85381, 85382, 85383.
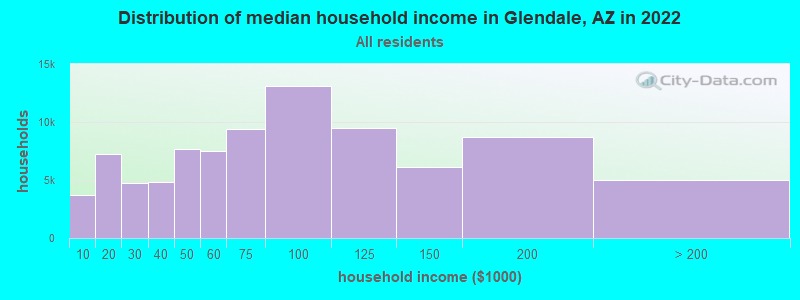
Glendale Zip Code Map| Glendale: | $72,411 |
| AZ: | $74,568 |
Estimated per capita income in 2022: $31,503 (it was $19,124 in 2000)
Glendale city income, earnings, and wages data
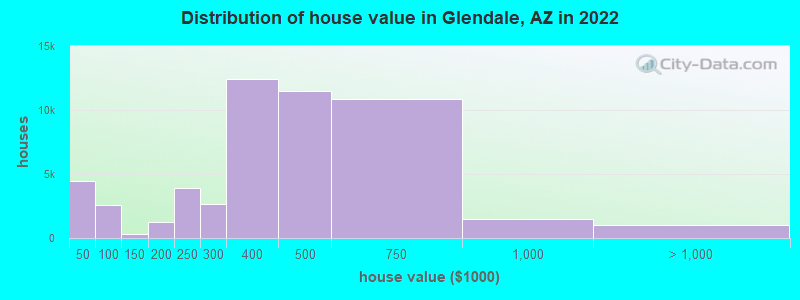
Estimated median house or condo value in 2022: $389,900 (it was $113,300 in 2000)
| Glendale: | $389,900 |
| AZ: | $402,800 |
Mean prices in 2022: all housing units: $418,073; detached houses: $459,652; townhouses or other attached units: $277,939; in 2-unit structures: $391,197; in 3-to-4-unit structures: $178,592; in 5-or-more-unit structures: $321,052; mobile homes: $78,935; occupied boats, rvs, vans, etc.: $4,999
Median gross rent in 2022: $1,413.
(11.1% for White Non-Hispanic residents, 20.3% for Black residents, 17.0% for Hispanic or Latino residents, 22.7% for American Indian residents, 21.6% for Native Hawaiian and other Pacific Islander residents, 22.5% for other race residents, 17.9% for two or more races residents)
Detailed information about poverty and poor residents in Glendale, AZ


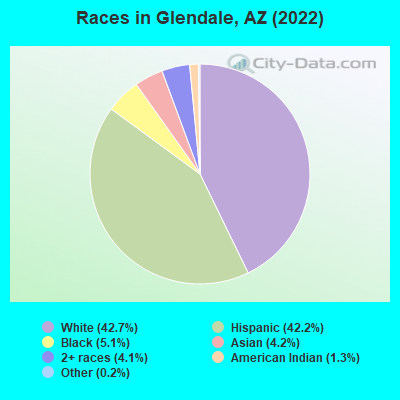
- 107,67142.7%White alone
- 106,47042.2%Hispanic
- 12,9625.1%Black alone
- 10,5954.2%Asian alone
- 10,4014.1%Two or more races
- 3,2091.3%American Indian alone
- 6150.2%Other race alone
- 2180.09%Native Hawaiian and Other
Pacific Islander alone
According to our research of Arizona and other state lists, there were 373 registered sex offenders living in Glendale, Arizona as of April 27, 2024.
The ratio of all residents to sex offenders in Glendale is 659 to 1.
The ratio of registered sex offenders to all residents in this city is near the state average.
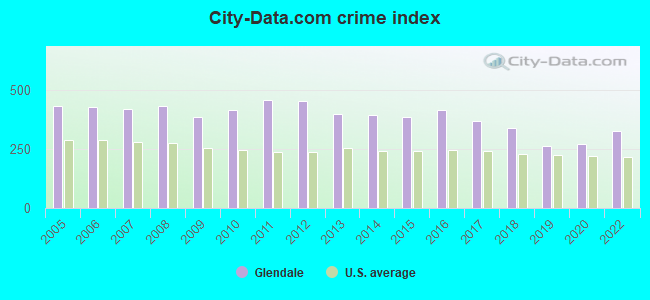
The City-Data.com crime index weighs serious crimes and violent crimes more heavily. Higher means more crime, U.S. average is 246.1. It adjusts for the number of visitors and daily workers commuting into cities.
- means the value is smaller than the state average.- means the value is about the same as the state average.
- means the value is bigger than the state average.
- means the value is much bigger than the state average.
Crime rate in Glendale detailed stats: murders, rapes, robberies, assaults, burglaries, thefts, arson
Full-time law enforcement employees in 2021, including police officers: 540 (409 officers - 357 male; 52 female).
| Officers per 1,000 residents here: | 1.62 |
| Arizona average: | 1.75 |
 Recent articles from our blog. Our writers, many of them Ph.D. graduates or candidates, create easy-to-read articles on a wide variety of topics.


Latest news from Glendale, AZ collected exclusively by city-data.com from local newspapers, TV, and radio stations
Ancestries: German (5.2%), American (3.9%), English (3.5%), Irish (3.1%), Italian (2.1%), European (1.7%).
Current Local Time: MST (no DST) time zone
Incorporated in 1910
Elevation: 1153 feet
Land area: 55.7 square miles.
Population density: 4,528 people per square mile (average).
42,703 residents are foreign born (10.5% Latin America, 3.7% Asia).
| This city: | 16.8% |
| Arizona: | 13.0% |
Median real estate property taxes paid for housing units with mortgages in 2022: $1,526 (0.4%)
Median real estate property taxes paid for housing units with no mortgage in 2022: $1,261 (0.4%)
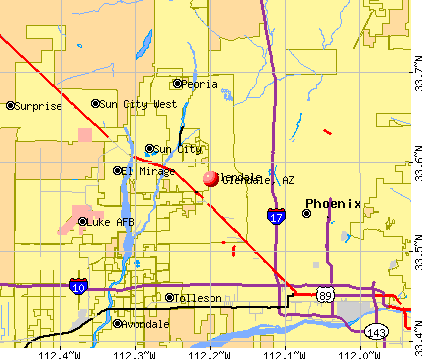
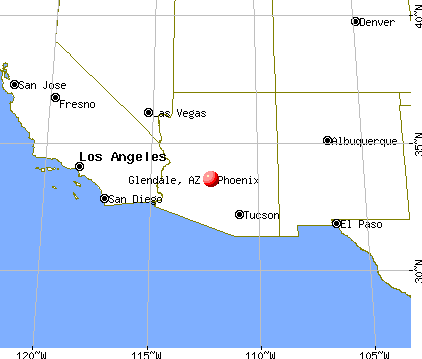
Nearest city with pop. 1,000,000+: Phoenix, AZ  (8.0 miles , pop. 1,321,045).
Nearest cities:
), ), ), )Latitude: 33.58 N, Longitude: 112.20 W
Daytime population change due to commuting: -21,075 (-8.4%)
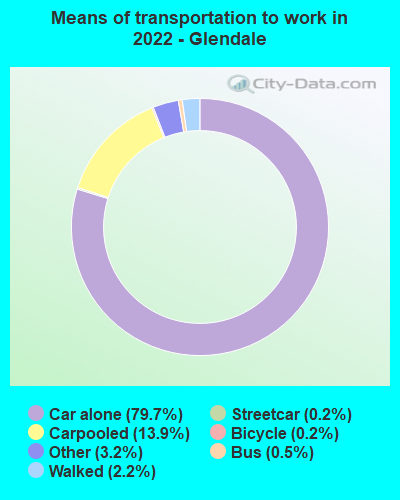
Workers who live and work in this city: 41,970 (33.4%)
Property values in Glendale, AZ
Glendale tourist attractions:
- Arrowhead Towne Center - Glendale, Arizona - Shopping Center
- Jobing.com Arena Glendale, Arizona
- Katydid Museum - Glendale, AZ - a museum dedicated to insects
- Bellair Golf Club - Glendale, AZ - an 18 hole golf course open since 1972
- The Bead Museum - Glendale, AZ - a museum founded in 1984 dedicated to beads
- Camelback Ranch - Glendale, AZ - a baseball training facility
- Caitlin Court - Glendale, AZ - a multipurpose event facility
- Foothills Park - Glendale, AZ - a park offering various amenities and nearby relaxation facilities
- Foothills Recreation and Aquatics Center - Glendale, AZ - a facility meeting all of the Glendale areas recreation needs
- Foothills SK8 Court Plaza - Glendale, AZ - a park dedicated to skate boarding
- Glendale Arena at Westgate City Center - Glendale, AZ - a sports arena that is part of a large facility
- Glendale Community College - Glendale, AZ - a college that changes as the needs of the community change
- Glendale Historic District - Glendale, AZ - downtown Glendale's history preserved
- University of Phoenix Stadium - Glendale, Arizona - home of the NFL's Arizona Cardinals
Glendale, Arizona accommodation & food services, waste management - Economy and Business Data
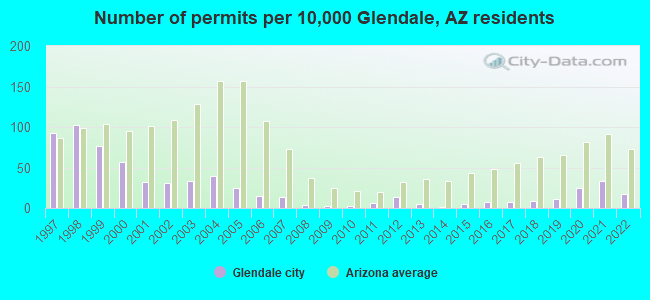
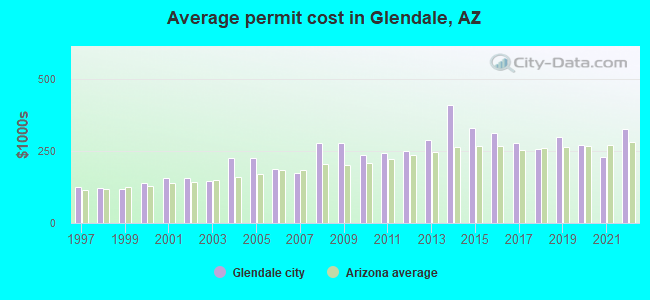
Single-family new house construction building permits:
- 2022: 379 buildings, average cost: $328,900
- 2021: 713 buildings, average cost: $229,700
- 2020: 546 buildings, average cost: $271,400
- 2019: 246 buildings, average cost: $297,800
- 2018: 191 buildings, average cost: $257,400
- 2017: 172 buildings, average cost: $277,100
- 2016: 173 buildings, average cost: $312,300
- 2015: 109 buildings, average cost: $330,600
- 2014: 21 buildings, average cost: $411,500
- 2013: 119 buildings, average cost: $289,800
- 2012: 281 buildings, average cost: $252,000
- 2011: 141 buildings, average cost: $245,200
- 2010: 74 buildings, average cost: $236,000
- 2009: 50 buildings, average cost: $279,700
- 2008: 78 buildings, average cost: $278,800
- 2007: 298 buildings, average cost: $174,100
- 2006: 318 buildings, average cost: $187,600
- 2005: 538 buildings, average cost: $224,500
- 2004: 875 buildings, average cost: $227,200
- 2003: 722 buildings, average cost: $147,700
- 2002: 670 buildings, average cost: $158,200
- 2001: 703 buildings, average cost: $158,000
- 2000: 1251 buildings, average cost: $138,700
- 1999: 1661 buildings, average cost: $119,600
- 1998: 2257 buildings, average cost: $122,100
- 1997: 2019 buildings, average cost: $123,600
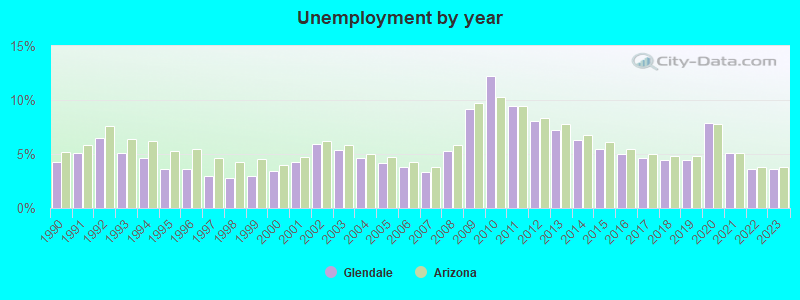
| Here: | 3.6% |
| Arizona: | 3.8% |
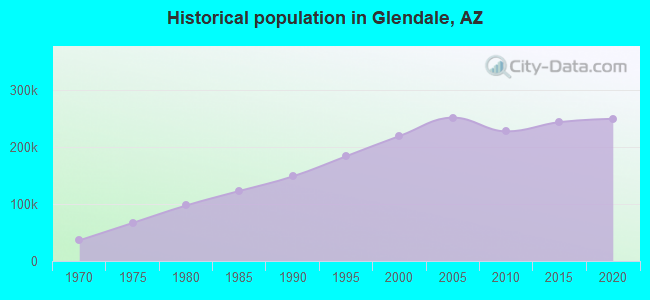
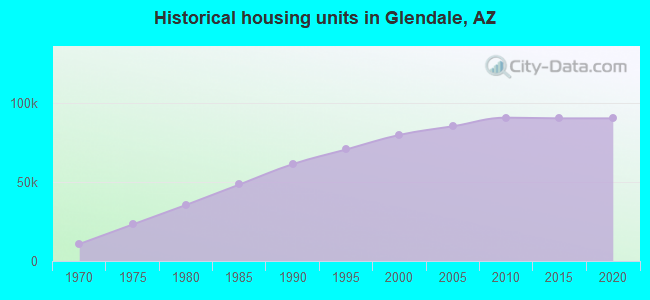
Population change in the 1990s: +67,406 (+44.5%).
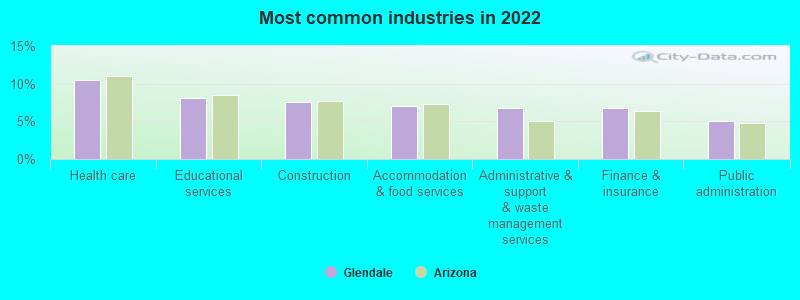
- Health care (10.5%)
- Educational services (8.2%)
- Construction (7.5%)
- Accommodation & food services (7.0%)
- Administrative & support & waste management services (6.8%)
- Finance & insurance (6.8%)
- Public administration (5.0%)
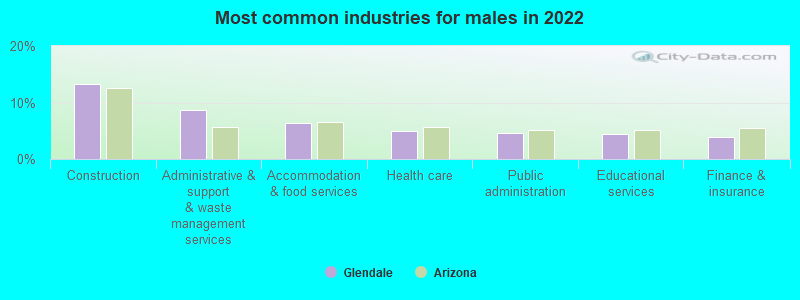
- Construction (13.3%)
- Administrative & support & waste management services (8.7%)
- Accommodation & food services (6.3%)
- Health care (5.0%)
- Public administration (4.6%)
- Educational services (4.5%)
- Finance & insurance (3.9%)
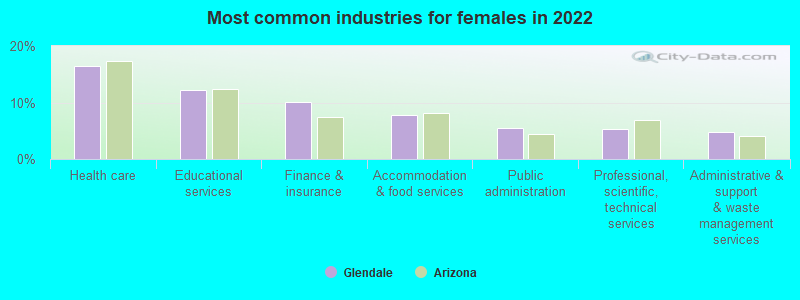
- Health care (16.5%)
- Educational services (12.2%)
- Finance & insurance (10.0%)
- Accommodation & food services (7.8%)
- Public administration (5.5%)
- Professional, scientific, technical services (5.3%)
- Administrative & support & waste management services (4.8%)
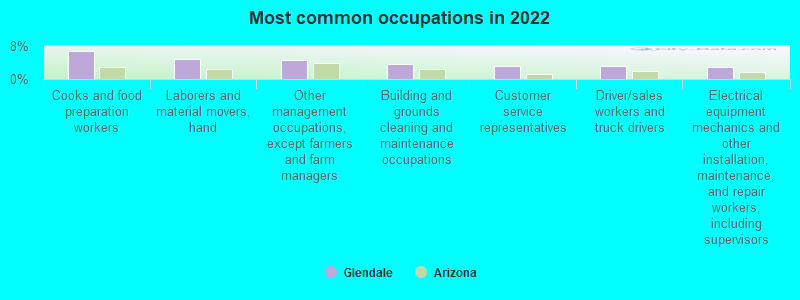
- Cooks and food preparation workers (6.8%)
- Laborers and material movers, hand (4.9%)
- Other management occupations, except farmers and farm managers (4.5%)
- Building and grounds cleaning and maintenance occupations (3.7%)
- Customer service representatives (3.3%)
- Driver/sales workers and truck drivers (3.1%)
- Electrical equipment mechanics and other installation, maintenance, and repair workers, including supervisors (2.8%)
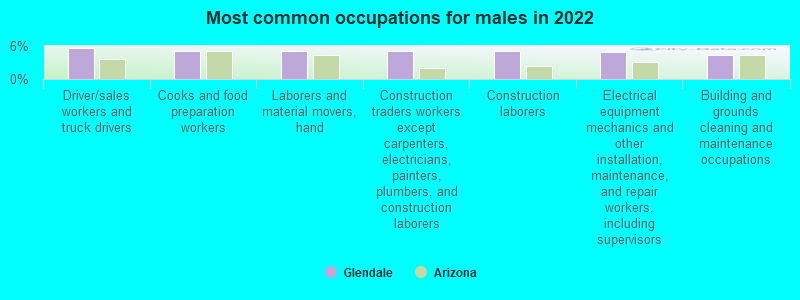
- Driver/sales workers and truck drivers (5.7%)
- Cooks and food preparation workers (5.2%)
- Laborers and material movers, hand (5.1%)
- Construction traders workers except carpenters, electricians, painters, plumbers, and construction laborers (5.0%)
- Construction laborers (5.0%)
- Electrical equipment mechanics and other installation, maintenance, and repair workers, including supervisors (4.9%)
- Building and grounds cleaning and maintenance occupations (4.3%)
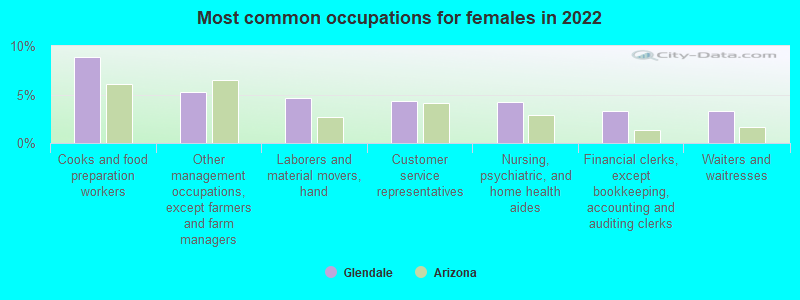
- Cooks and food preparation workers (8.9%)
- Other management occupations, except farmers and farm managers (5.3%)
- Laborers and material movers, hand (4.6%)
- Customer service representatives (4.3%)
- Nursing, psychiatric, and home health aides (4.2%)
- Financial clerks, except bookkeeping, accounting and auditing clerks (3.3%)
- Waiters and waitresses (3.3%)
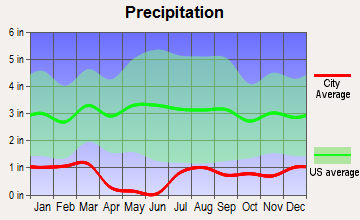
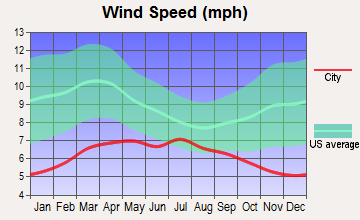
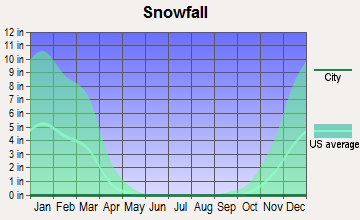
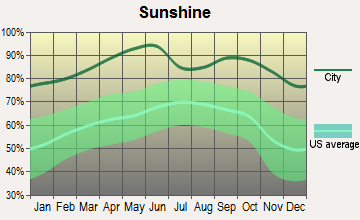
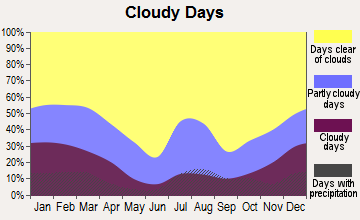
Average climate in Glendale, Arizona
Based on data reported by over 4,000 weather stations


|
|

(lower is better)
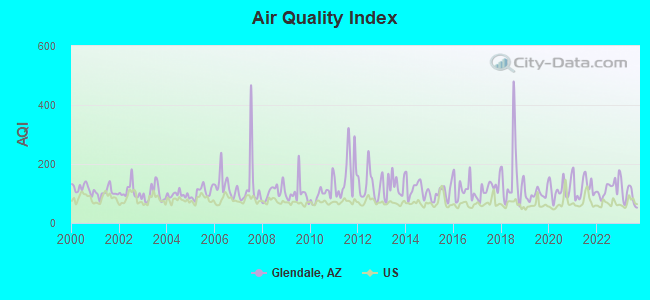
Air Quality Index (AQI) level in 2023 was 93.2. This is worse than average.
| City: | 93.2 |
| U.S.: | 72.6 |
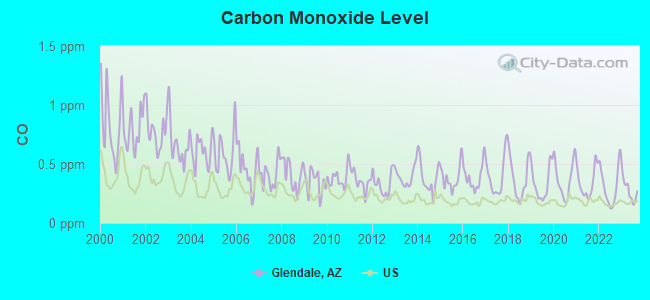
Carbon Monoxide (CO) [ppm] level in 2023 was 0.279. This is about average. Closest monitor was 0.6 miles away from the city center.
| City: | 0.279 |
| U.S.: | 0.251 |
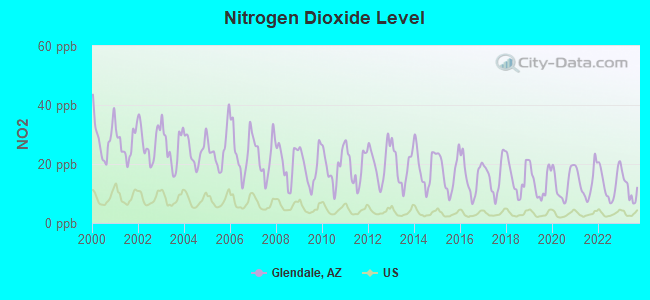
Nitrogen Dioxide (NO2) [ppb] level in 2023 was 11.4. This is significantly worse than average. Closest monitor was 6.6 miles away from the city center.
| City: | 11.4 |
| U.S.: | 5.1 |
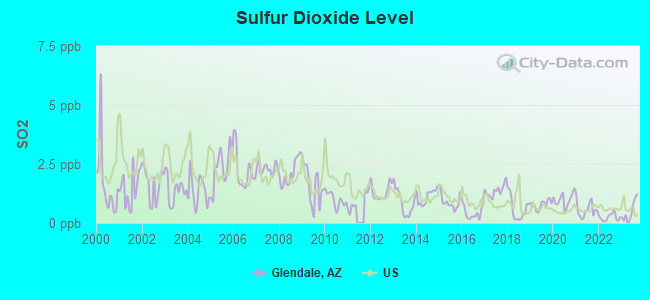
Sulfur Dioxide (SO2) [ppb] level in 2023 was 0.478. This is significantly better than average. Closest monitor was 0.6 miles away from the city center.
| City: | 0.478 |
| U.S.: | 1.515 |
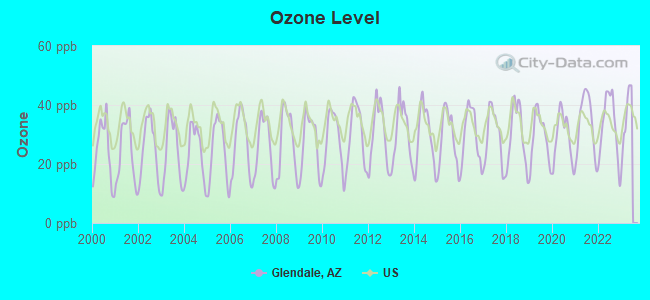
Ozone [ppb] level in 2022 was 32.9. This is about average. Closest monitor was 0.6 miles away from the city center.
| City: | 32.9 |
| U.S.: | 33.3 |
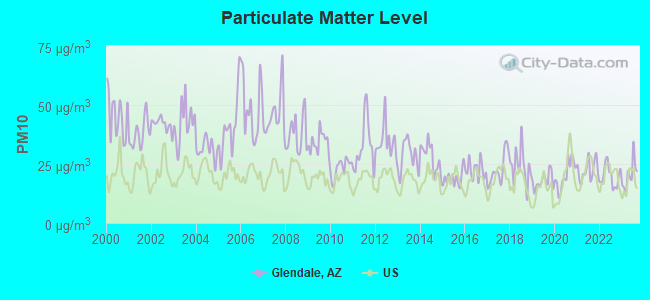
Particulate Matter (PM10) [µg/m3] level in 2023 was 20.3. This is about average. Closest monitor was 0.6 miles away from the city center.
| City: | 20.3 |
| U.S.: | 19.2 |
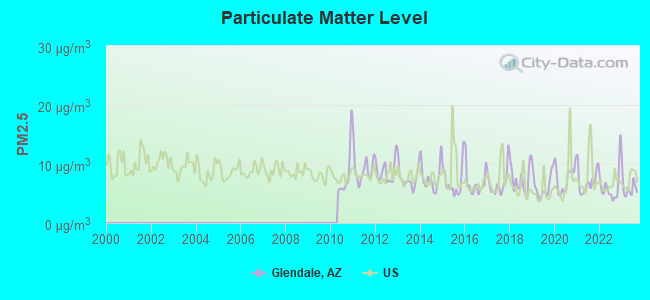
Particulate Matter (PM2.5) [µg/m3] level in 2023 was 5.95. This is better than average. Closest monitor was 0.6 miles away from the city center.
| City: | 5.95 |
| U.S.: | 8.11 |
Earthquake activity:
Glendale-area historical earthquake activity is significantly above Arizona state average. It is 2599% greater than the overall U.S. average.On 6/28/1992 at 11:57:34, a magnitude 7.6 (6.2 MB, 7.6 MS, 7.3 MW, Depth: 0.7 mi, Class: Major, Intensity: VIII - XII) earthquake occurred 252.2 miles away from the city center, causing 3 deaths (1 shaking deaths, 2 other deaths) and 400 injuries, causing $100,000,000 total damage and $40,000,000 insured losses
On 5/19/1940 at 04:36:40, a magnitude 7.2 (7.2 UK) earthquake occurred 203.5 miles away from the city center, causing $33,000,000 total damage
On 10/16/1999 at 09:46:44, a magnitude 7.4 (6.3 MB, 7.4 MS, 7.2 MW, 7.3 ML) earthquake occurred 251.2 miles away from the city center
On 12/31/1934 at 18:45:56, a magnitude 7.1 (7.1 UK) earthquake occurred 215.4 miles away from Glendale center
On 10/15/1979 at 23:16:54, a magnitude 7.0 (5.7 MB, 6.9 MS, 7.0 ML, 6.4 MW) earthquake occurred 206.0 miles away from the city center
On 7/21/1952 at 11:52:14, a magnitude 7.7 (7.7 UK) earthquake occurred 400.7 miles away from Glendale center, causing $50,000,000 total damage
Magnitude types: body-wave magnitude (MB), local magnitude (ML), surface-wave magnitude (MS), moment magnitude (MW)
Natural disasters:
The number of natural disasters in Maricopa County (16) is near the US average (15).Major Disasters (Presidential) Declared: 11
Emergencies Declared: 1
Causes of natural disasters: Floods: 10, Storms: 9, Fires: 3, Flash Flood: 1, Heavy Rain: 1, Hurricane: 1, Tornado: 1, Wind: 1, Other: 1 (Note: some incidents may be assigned to more than one category).

Hospitals in Glendale:
- ARROWHEAD HOSPITAL (Proprietary, provides emergency services, 18701 NORTH 67TH AVENUE)
- AURORA BEHAVIORAL HEALTH SYSTEM (6015 WEST PEORIA AVENUE)
- BANNER THUNDERBIRD MEDICAL CENTER (Government - Hospital District or Authority, 5555 WEST THUNDERBIRD ROAD)
- CAMELBACK SAM BEHAV H CNTR WEST VALLEY (provides emergency services, 5625 WEST THUNDERBIRD)
- GLENDALE SAMARITAN SURGICENTER (5757 W THUNDERBIRD RD SUITE E-150)
- HEALTHSOUTH VALLEY OF THE SUN REHABILITATION (13460 N 67TH AVENUE)
Nursing Homes in Glendale:
- ADVANCED HEALTH CARE OF GLENDALE (16825 NORTH 63RD AVENUE)
- BELLA VITA HEALTH AND REHABILITATION CENTER (5125 NORTH 58TH AVE)
- GLENDALE CARE CENTER (4704 WEST DIANA AVENUE)
- LIFE CARE CENTER OF NORTH GLENDALE (13620 NORTH 55TH AVENUE)
- PROVIDENCE PLACE AT GLENCROFT (8641 NORTH 67TH AVE)
Dialysis Facilities in Glendale:
- ARROWHEAD DIALYSIS (FMC) (16844 N 59TH AVE)
- BROOKWOOD DIALYSIS CLINIC (DVA) (8910 N 43RD AVE STE 107)
- DIALYSIS CENTER OF GLENDALE (FMC) (5957 W NORTHERN AVE STE 108)
- GLENDALE FAMILY HEALTH CENTER - DIALYSIS (5141 W LAMAR RD)
- SOUTHWEST KIDNEY DIALYSIS - ARROWHEAD LAKES (DVA) (20325 N 51ST AVE STE 186 BLDG 11)
- THUNDERBIRD DIALYSIS (FMC) (5750 W THUNDERBIRD RD BLDG G #750)
Home Health Centers in Glendale:
Airports, heliports and other landing facilities located in Glendale:
- Luke Afb Airport (LUF) (Runways: 2, Military Ops: 100,000)
- Glendale Municipal Airport (GEU) (Runways: 1, Air Taxi Ops: 912, Itinerant Ops: 41,688, Local Ops: 22,345, Military Ops: 141)
- Banner Thunderbird Medical Center Heliport (77AZ)
- Boulais Heliport (1AZ1)
- Airscrew Performance Flightpark Ultralight (AZ79)
Amtrak stations near Glendale:
- 6 miles: PHOENIX NORTHWEST (PHOENIX, 8101 BLACK CANYON FWY.) - Bus Station . Services: public payphones, call for taxi service.
- 12 miles: PHOENIX (401 W. HARRISON ST.) - Bus Station . Services: ticket office, enclosed waiting area, public restrooms, public payphones, vending machines, free short-term parking, paid long-term parking, taxi stand.
- 15 miles: PHOENIX AIRPORT (PHOENIX, TERMINAL 2) - Bus Station . Services: enclosed waiting area, public restrooms, public payphones, full-service food facilities, paid short-term parking, paid long-term parking, car rental agency, taxi stand, intercity bus service, public transit connection.
Colleges/Universities in Glendale:
- Glendale Community College (Full-time enrollment: 12,533; Location: 6000 W Olive Ave; Public; Website: www.gccaz.edu)
- Arizona State University-West (Full-time enrollment: 3,454; Location: 4701 W Thunderbird Road; Public; Website: www.asu.edu/; Offers Doctor's degree)
- Arizona College-Glendale (Full-time enrollment: 1,188; Location: 4425 W Olive Avenue Suite 300; Private, for-profit; Website: www.arizonacollege.edu)
- Arizona Automotive Institute (Full-time enrollment: 1,146; Location: 6829 N 46th Ave; Private, for-profit; Website: www.aai.edu)
- Midwestern University-Glendale (Full-time enrollment: 1,100; Location: 19555 N 59th Ave; Private, not-for-profit; Website: www.midwestern.edu; Offers Doctor's degree)
- Thunderbird School of Global Management (Full-time enrollment: 963; Location: 1 Global Place; Private, not-for-profit; Website: www.thunderbird.edu; Offers Master's degree)
- Empire Beauty School-NW Phoenix (Full-time enrollment: 231; Location: 2727 W. Glendale Ave. #200; Private, for-profit; Website: www.empire.edu)
Other colleges/universities with over 2000 students near Glendale:
- Everest College-Phoenix (about 5 miles; Phoenix, AZ; Full-time enrollment: 2,008)
- Argosy University-Phoenix Online Division (about 6 miles; Phoenix, AZ; FT enrollment: 8,840)
- Grand Canyon University (about 7 miles; Phoenix, AZ; FT enrollment: 44,186)
- Universal Technical Institute of Arizona Inc-Motorcycle Mechanics Institute Division (about 9 miles; Phoenix, AZ; FT enrollment: 2,976)
- Phoenix College (about 10 miles; Phoenix, AZ; FT enrollment: 7,001)
- Universal Technical Institute of Arizona Inc (about 11 miles; Avondale, AZ; FT enrollment: 3,860)
- Anthem College-Phoenix (about 11 miles; Phoenix, AZ; FT enrollment: 3,081)
Private high schools in Glendale:
Private elementary/middle schools in Glendale:
- ST LOUIS THE KING SCHOOL (Students: 214, Location: 4331 W MARYLAND AVE, Grades: PK-8)
- OUR LADY OF PERPETUAL HELP (Students: 175, Location: 7521 N 57TH AVE, Grades: PK-8)
- GRACE LUTHERAN SCHOOL (Students: 155, Location: 5600 W PALMAIRE AVE, Grades: PK-8)
- ATONEMENT LUTHERAN (Students: 154, Location: 4001 W BEARDSLEY RD, Grades: PK-6)
Library in Glendale:
- GLENDALE PUBLIC LIBRARY (Operating income: $9,012,853; Location: 5959 W BROWN ST; 258,383 books; 40,009 e-books; 28,234 audio materials; 20,171 video materials; 24 local licensed databases; 2 state licensed databases; 16 other licensed databases; 1,078 print serial subscriptions; 6,758 electronic serial subscriptions)
User-submitted facts and corrections:
- Our Lady of Perpetual Help School is located at 7521 N. 57th Avenue in Glendale, AZ. The zip code is 85301-13399
The current enrollment is 367 students. That does qualify for your large private middle schools category. OLPH provides curriculum for pre- kindergarten through 8th grades. The current principal is Mrs. Cecilia Frakes is you have any further questions. She can be reached at 623-931-7288.
- Our Lady of Perpetual Help School is located at 7521 N. 57th Avenue in Glendale, AZ. The zip code is 85301-13399 The current enrollment is 367 students. That does qualify for your large private middle schools category. OLPH provides curriculum for pre- kindergarten through 8th grades. The current principal is Mrs. Cecilia Frakes is you have any further questions. She can be reached at 623-931-7288.
Points of interest:
Notable locations in Glendale: Glendale Plaza (A), Glendale Water Tank Triangulation Station (B), Grasmoen Substation (C), Maryvale Substation (D), Glen Lakes Golf Course (E), Southwest Poultry Experiment Station (F), City of Glendale Landfill (G), Escuda Office Park (H), Fifty - One Bells Business Park (I), Glen Harbor Business Park (J), Glen Harbor Commerce Park (K), Glendale Corporate Center (L), The Bead Museum (M), Glendale Public Library Velma Teague Branch (N), Glendale Public Library Main Branch (O), Glendale Public Library Foothills Branch (P), Glendale Family Health Center (Q), Glendale Care Center (R), Glendale City Hall (S), Glendale Fire Department Station 159 (T). Display/hide their locations on the map
Shopping Centers: Bethany West Plaza Shopping Center (1), Glen Fairs Shopping Center (2), Glendale Plaza Shopping Center (3), Glendale Shopping Center (4), Glenwood Plaza Shopping Center (5), Grandview Plaza Shopping Center (6), Olive Plaza Shopping Center (7), Olive Village Shopping Center (8), Plaza Sixtyseven Shopping Center (9). Display/hide their locations on the map
Main business address in Glendale: AZCO MINING INC (A). Display/hide its location on the map
Churches in Glendale include: Heritage Presbyterian Church (A), Grace Evangelical Lutheran Church (B), Glendale Church of the Nazarene (C), Glendale Church of Christ (D), Glendale Christian Church (E), Free Methodist Church of Glendale (F), First United Methodist Church (G), First Church of Christ Scientist (H), First Christian Church (I). Display/hide their locations on the map
Cemeteries: Resthaven Park West Cemetery (1), Russian Molokan Cemetery (2), Glendale Memorial Park (3). Display/hide their locations on the map
River: New River (A). Display/hide its location on the map
Parks in Glendale include: Windsor Park (1), W J Murphy Park (2), Sunset Park (3), Myrtle Park (4), Chapparal Park (5), Lawrence Park (6), Mission Park (7), Rovey Park (8), Horizon Park (9). Display/hide their locations on the map
Tourist attractions: Bead Museum (5754 West Glenn Drive) (1), A Vault of the Ages at Coury House (Museums; 5802 West Palmaire Avenue) (2), Deer Valley Rock Art Center (Museums; 3711 West Deer Valley Road) (3), Glendale Arizona Historical Society (Historical Places & Services; 9802 North 59th Avenue) (4), Glendale City Government - Libraries- Foothills Branch- Circulation Desk-Informa (Cultural Attractions- Events- & Facilities; 19055 North 57th Avenue) (5), Police Department - Glendale (Cultural Attractions- Events- & Facilities; 6835 North 57th Drive) (6), Phoenix Billiards (Amusement & Theme Parks; 6133 West Port Au Prince Lane) (7), Speed Street (Amusement & Theme Parks; 6542 West Bell Road) (8), Great Skate (Amusement & Theme Parks; 10054 North 43rd Avenue) (9). Display/hide their approximate locations on the map
Hotels: Best Western Inn Phoenix Glen (7116 North 59th Avenue) (1), AriTime Personal Services (11640 N. 51st Ave) (2), Four Seasons Flowers & Gifts (6630 West Cactus Road Suite 104) (3), Holiday Inn Express Arrowhead Towne Center (7885 W. Arrowhead Towne Center Dr. 79th Ave One Block North Of) (4), McPherson Textiles (5737 West Myrtle Avenue) (5), Inn At Talavi (5511 West Bell Road) (6), Holiday Inn Exp Phoenix Glenda (7885 Arrowhead Towne Center) (7), Quality Inn & Suites at Talavi (5511 West Bell Road) (8). Display/hide their approximate locations on the map
Courts: Glendale City - City Court (5711 West Glendale Avenue) (1), Maricopa County - N Valley- Constables- Justices Of The Peace- North Valley Justice C (5222 West Glendale Avenue) (2), Maricopa County - Superior Court In Maricopa County- Glendale Regional C (5222 West Glendale Avenue) (3), West Valley Court Diversion Services (Po Box 10175) (4), Maricopa County - Constables- Justices Of The Peace- Glendale Justice C (5222 West Glendale Avenue) (5). Display/hide their approximate locations on the map
Birthplace of: Marty Robbins - Racing driver, Michael McDowell (racing driver) - Stock car racing driver, Craig Mabbitt - Male singer, Guadalupe Huerta - Activist, Brandon McDonald (soccer) - Soccer player, Travis Peterson - Basketball player, Austen Powers - College basketball player (CS Northridge Matadors), Brad Anderson (American football) - Football player, Joey Shaw - College basketball player (Indiana Hoosiers), Jonathan Beasley - Football player.
Drinking water stations with addresses in Glendale and their reported violations in the past:
GLENDALE CITY OF (Address: 7070 W NORTHERN AVE , Population served: 180,000, Surface water):Past monitoring violations:DESERT OASIS (Address: 6963 W MELINDA LN , Population served: 2,223, Groundwater):
- Monitoring and Reporting (DBP) - Between OCT-2007 and DEC-2007, Contaminant: TTHM. Follow-up actions: St Compliance achieved (MAY-09-2008)
- Monitoring and Reporting (DBP) - Between OCT-2007 and DEC-2007, Contaminant: Total Haloacetic Acids (HAA5). Follow-up actions: St Compliance achieved (MAY-09-2008)
- Monitoring, Repeat Major (TCR) - In APR-2007, Contaminant: Coliform (TCR). Follow-up actions: St Compliance achieved (MAR-15-2011)
- Monitoring and Reporting (DBP) - Between APR-2007 and JUN-2007, Contaminant: TTHM. Follow-up actions: St Compliance achieved (DEC-04-2007)
- Monitoring and Reporting (DBP) - Between APR-2007 and JUN-2007, Contaminant: Total Haloacetic Acids (HAA5). Follow-up actions: St Compliance achieved (DEC-04-2007)
- 3 routine major monitoring violations
- 2 minor monitoring violations
- 239 regular monitoring violations
- 11 other older monitoring violations
Past monitoring violations:ASH CREEK WATER CO (Address: 4622 W WAGONER RD , Population served: 360, Groundwater):
- Monitoring and Reporting (DBP) - Between JUL-2009 and SEP-2009, Contaminant: Chlorine. Follow-up actions: St Compliance achieved (2 times from JAN-11-2010 to JAN-21-2010)
- 9 routine major monitoring violations
- 5 minor monitoring violations
- 6 regular monitoring violations
Past monitoring violations:HACIENDA DEL SOL MHP (Address: 12727 W GLENDALE AVE , Population served: 300, Groundwater):
- Follow-up Or Routine LCR Tap M/R - In OCT-01-2002, Contaminant: Lead and Copper Rule. Follow-up actions: St Compliance achieved (DEC-26-2007)
- 2 routine major monitoring violations
Past monitoring violations:CROWN KING WATER CO (Address: 4918 W PARK VIEW LN , Population served: 220, Groundwater):
- Monitoring and Reporting (DBP) - Between JAN-2007 and DEC-2007, Contaminant: Total Haloacetic Acids (HAA5). Follow-up actions: St Compliance achieved (JUL-14-2008)
- Monitoring and Reporting (DBP) - Between JAN-2007 and DEC-2007, Contaminant: TTHM. Follow-up actions: St Compliance achieved (JUL-14-2008)
- Monitoring and Reporting (DBP) - Between JAN-2006 and DEC-2006, Contaminant: Total Haloacetic Acids (HAA5). Follow-up actions: St Compliance achieved (JUL-14-2008)
- Monitoring and Reporting (DBP) - Between JAN-2006 and DEC-2006, Contaminant: TTHM. Follow-up actions: St Compliance achieved (JUL-14-2008)
- Monitoring and Reporting (DBP) - Between JUL-2005 and SEP-2005, Contaminant: Chlorine. Follow-up actions: St Compliance achieved (DEC-28-2005)
Past health violations:STADIUM CHEVRON (Address: 9031 W NORTHERN AVE , Population served: 200, Groundwater):Past monitoring violations:
- MCL, Monthly (TCR) - In JUN-2007, Contaminant: Coliform. Follow-up actions: St Compliance achieved (MAR-14-2011)
- Monitoring and Reporting (DBP) - Between OCT-2010 and DEC-2010, Contaminant: Chlorine
- Monitoring and Reporting (DBP) - Between JUL-2010 and SEP-2010, Contaminant: Chlorine
- Monitoring and Reporting (DBP) - Between APR-2010 and JUN-2010, Contaminant: Chlorine
- Monitoring and Reporting (DBP) - Between JAN-2010 and MAR-2010, Contaminant: Chlorine
- Monitoring and Reporting (DBP) - Between OCT-2009 and DEC-2009, Contaminant: Chlorine
- 31 routine major monitoring violations
- One regular monitoring violation
- 5 other older monitoring violations
Past monitoring violations:MOUNTAIN VIEW MHP (Address: 6369 W ROBIN LANE , Population served: 160, Groundwater):
- Monitoring, Source Water (GWR) - In OCT-06-2010, Contaminant: E. COLI. Follow-up actions: St Compliance achieved (OCT-13-2010)
- 13 routine major monitoring violations
- 2 regular monitoring violations
Past health violations:CACTUS MOBILE RANCH (Address: 6369 W ROBIN LANE , Population served: 75, Groundwater):Past monitoring violations:
- MCL, Average - Between APR-2014 and JUN-2014, Contaminant: Arsenic. Follow-up actions: St AO (w/o penalty) issued (MAY-09-2013)
- MCL, Average - Between JAN-2014 and MAR-2014, Contaminant: Arsenic. Follow-up actions: St AO (w/o penalty) issued (MAY-09-2013)
- MCL, Average - Between OCT-2013 and DEC-2013, Contaminant: Arsenic. Follow-up actions: St AO (w/o penalty) issued (MAY-09-2013)
- MCL, Average - Between JUL-2013 and SEP-2013, Contaminant: Arsenic. Follow-up actions: St AO (w/o penalty) issued (MAY-09-2013), St Violation/Reminder Notice (DEC-02-2013)
- MCL, Average - Between APR-2013 and JUN-2013, Contaminant: Arsenic. Follow-up actions: St AO (w/o penalty) issued (MAY-09-2013), St Violation/Reminder Notice (OCT-02-2013)
- MCL, Average - Between JAN-2013 and MAR-2013, Contaminant: Arsenic. Follow-up actions: St AO (w/o penalty) issued (MAY-09-2013), St Violation/Reminder Notice (JUN-03-2013)
- 7 other older health violations
- Monitoring, Repeat Major (TCR) - In JUL-2006, Contaminant: Coliform (TCR). Follow-up actions: St Compliance achieved (MAY-25-2007)
Past monitoring violations:
- Monitoring and Reporting (DBP) - Between JUL-2007 and SEP-2007, Contaminant: Chlorine. Follow-up actions: St Compliance achieved (DEC-06-2007)
- Monitoring and Reporting (DBP) - Between JAN-2006 and DEC-2006, Contaminant: Total Haloacetic Acids (HAA5). Follow-up actions: St Compliance achieved (JUL-19-2012)
- Monitoring and Reporting (DBP) - Between JAN-2006 and DEC-2006, Contaminant: TTHM. Follow-up actions: St Compliance achieved (JUL-19-2012)
- Monitoring and Reporting (DBP) - Between JAN-2005 and DEC-2005, Contaminant: Total Haloacetic Acids (HAA5). Follow-up actions: St Compliance achieved (JUL-19-2012)
- Monitoring and Reporting (DBP) - Between JAN-2005 and DEC-2005, Contaminant: TTHM. Follow-up actions: St Compliance achieved (JUL-19-2012)
- One routine major monitoring violation
| This city: | 2.8 people |
| Arizona: | 2.6 people |
| This city: | 69.2% |
| Whole state: | 66.2% |
| This city: | 8.5% |
| Whole state: | 7.8% |
Likely homosexual households (counted as self-reported same-sex unmarried-partner households)
- Lesbian couples: 0.5% of all households
- Gay men: 0.3% of all households
People in group quarters in Glendale in 2010:
- 836 people in nursing facilities/skilled-nursing facilities
- 664 people in college/university student housing
- 656 people in military barracks and dormitories (nondisciplinary)
- 581 people in group homes intended for adults
- 162 people in group homes for juveniles (non-correctional)
- 153 people in residential treatment centers for adults
- 124 people in workers' group living quarters and job corps centers
- 79 people in other noninstitutional facilities
- 2 people in military disciplinary barracks and jails
People in group quarters in Glendale in 2000:
- 987 people in nursing homes
- 643 people in military barracks, etc.
- 347 people in college dormitories (includes college quarters off campus)
- 345 people in other nonhousehold living situations
- 288 people in other noninstitutional group quarters
- 58 people in other group homes
- 53 people in homes or halfway houses for drug/alcohol abuse
- 43 people in homes for the mentally ill
- 37 people in military transient quarters for temporary residents
- 29 people in homes for the mentally retarded
- 23 people in hospitals/wards and hospices for chronically ill
- 23 people in hospices or homes for chronically ill
- 4 people in military disciplinary barracks
Banks with most branches in Glendale (2011 data):
- JPMorgan Chase Bank, National Association: 19 branches. Info updated 2011/11/10: Bank assets: $1,811,678.0 mil, Deposits: $1,190,738.0 mil, headquarters in Columbus, OH, positive income, International Specialization, 5577 total offices, Holding Company: Jpmorgan Chase & Co.
- Bank of America, National Association: 9 branches. Info updated 2009/11/18: Bank assets: $1,451,969.3 mil, Deposits: $1,077,176.8 mil, headquarters in Charlotte, NC, positive income, 5782 total offices, Holding Company: Bank Of America Corporation
- Wells Fargo Bank, National Association: 8 branches. Info updated 2011/04/05: Bank assets: $1,161,490.0 mil, Deposits: $905,653.0 mil, headquarters in Sioux Falls, SD, positive income, 6395 total offices, Holding Company: Wells Fargo & Company
- BMO Harris Bank National Association: Glencroft Branch, Glendale-Arrowhead, Glendale Branch. Info updated 2011/07/14: Bank assets: $97,264.0 mil, Deposits: $75,624.6 mil, headquarters in Chicago, IL, positive income, 717 total offices, Holding Company: Bank Of Montreal
- U.S. Bank National Association: West Thunderbird Glendale Safeway Br, West Olive Glendale Safeway Branch, Deer Valley Safeway. Info updated 2012/01/30: Bank assets: $330,470.8 mil, Deposits: $236,091.5 mil, headquarters in Cincinnati, OH, positive income, 3121 total offices, Holding Company: U.S. Bancorp
- Armed Forces Bank, National Association: Luke Air Force Base Branch at 13877 W Thunderbird St, branch established on 1944/01/05; Luke Air Force Base Exchange Branch at Building 1540, 7041 North 38th Avenue, branch established on 1998/04/23. Info updated 2010/12/16: Bank assets: $1,839.7 mil, Deposits: $1,387.5 mil, headquarters in Fort Leavenworth, KS, negative income in the last year, Commercial Lending Specialization, 78 total offices, Holding Company: Dickinson Financial Corporation Ii
- MidFirst Bank: 65th Ave & Bell Branch at 6508 West Bell Road, branch established on 2009/08/04; 67th & Peoria Branch at 6666 W Peoria Ave., Suite 101, branch established on 2007/07/23. Info updated 2011/07/21: Bank assets: $9,790.2 mil, Deposits: $6,308.2 mil, headquarters in Oklahoma City, OK, positive income, Commercial Lending Specialization, 77 total offices
- Compass Bank: 59th Avenue & Bell Branch at 5740 West Bell Road, branch established on 2006/03/20; 67th Ave & 101 Branch at 20016 North 67th Avenue, branch established on 2004/10/25. Info updated 2011/02/24: Bank assets: $63,107.0 mil, Deposits: $46,232.4 mil, headquarters in Birmingham, AL, negative income in the last year, Commercial Lending Specialization, 720 total offices, Holding Company: Banco Bilbao Vizcaya Argentaria, S.A.
- SunBank, National Association: Glendale Manistee Branch at 5605 West Northern Avenue, branch established on 2008/07/12; Glendale West Branch at 5010 North 95th Avenue, branch established on 2008/04/02. Info updated 2010/07/12: Bank assets: $31.4 mil, Deposits: $23.9 mil, headquarters in Phoenix, AZ, negative income in the last year, 16 total offices, Holding Company: Dickinson Financial Corporation Ii
- 4 other banks with 4 local branches
For population 15 years and over in Glendale:
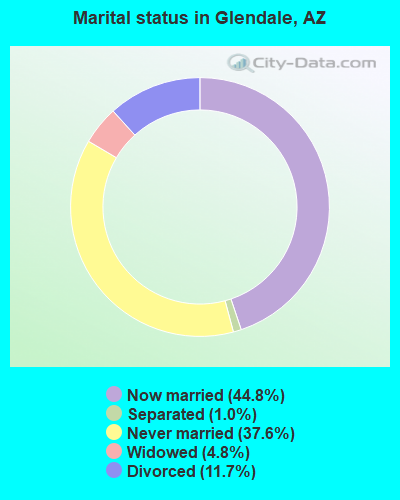
- Never married: 37.6%
- Now married: 44.8%
- Separated: 1.0%
- Widowed: 4.8%
- Divorced: 11.7%
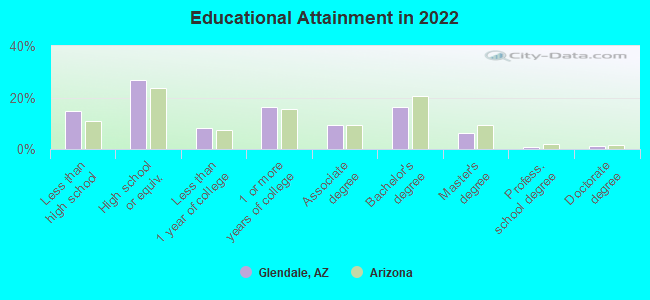
For population 25 years and over in Glendale:
- High school or higher: 85.4%
- Bachelor's degree or higher: 24.6%
- Graduate or professional degree: 8.3%
- Unemployed: 5.0%
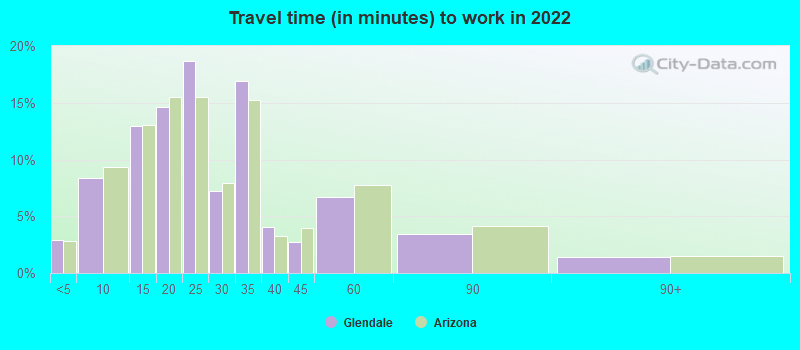
- Mean travel time to work (commute): 22.6 minutes
| Here: | 12.4 |
| Arizona average: | 12.2 |
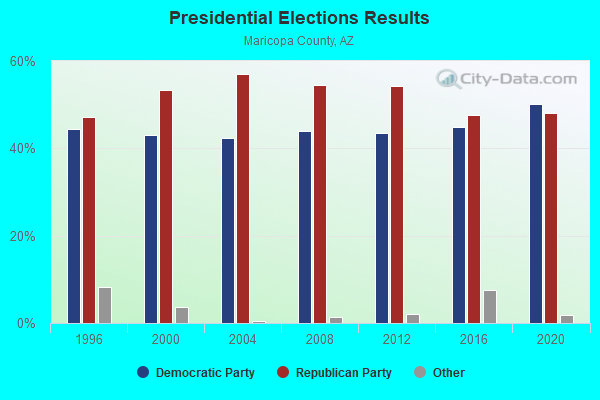
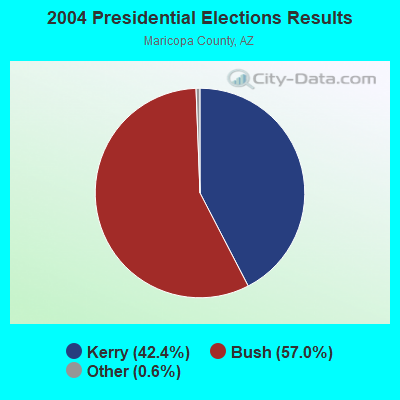
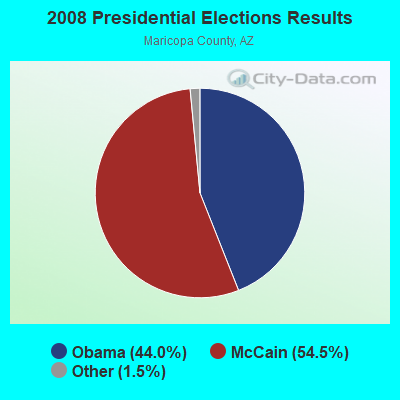
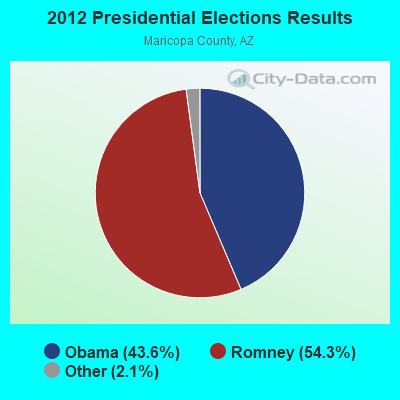
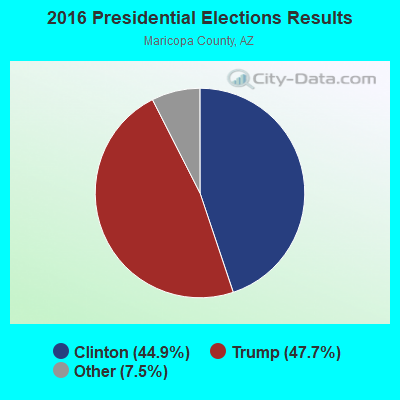
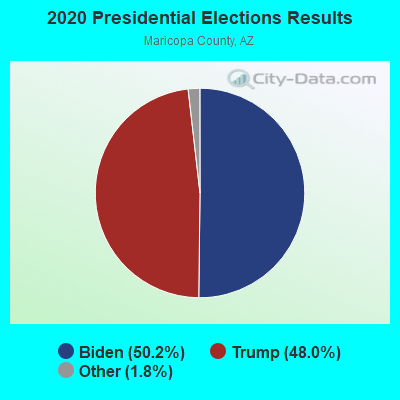
Graphs represent county-level data. Detailed 2008 Election Results
Neighborhoods in Glendale:
(Glendale, Arizona Neighborhood Map)- 47th Place Condominiums Inc., HOA neighborhood
- 55th Avenue Neighborhood neighborhood
- 60th Ave. Villa Maria Residents neighborhood
- 63rd Avenue Yard Guards neighborhood
- 64th Drive Sunrise neighborhood
- 80th Lane Block Watch neighborhood
- Acapulco Neighborhood Association neighborhood
- Acoma Neighborhood neighborhood
- Arrowhead Estates Desert Showers Partnership neighborhood
- Arrowhead Lakes HOA neighborhood
- Arrowhead Ranch Phase I neighborhood
- Arrowhead Ranch Phase II neighborhood
- Arrowhead Ranch Phase III neighborhood
- Arrowhead Ranch Phase V neighborhood
- Barrel District neighborhood
- Becker Lane Estates neighborhood
- Belaire neighborhood
- Bell/Greenway Neighborhood Watch Coalition neighborhood
- Bethany Heights neighborhood
- Bethany Meadows neighborhood
- Bethany Square Neighborhood neighborhood
- Bethany Treasures neighborhood
- Bicentennial Neighborhood Coalition neighborhood
- Bird of Paradise Neighbors neighborhood
- Brandywyne Estates neighborhood
- Cactus Cove HOA neighborhood
- Cactus District neighborhood
- Camelback Park neighborhood
- Camelback Village Estates neighborhood
- Caron Drive Neighborhood neighborhood
- Casa Compana HOA neighborhood
- Casa De Zia neighborhood
- Casa Linda neighborhood
- Catlin Court Historic District Association neighborhood
- Chaparral Country Estates neighborhood
- Chaparral Ranch I neighborhood
- Chaparral Ranch III neighborhood
- Chaparral West Neighborhood Association neighborhood
- Cholla District neighborhood
- Cobblefield HOA neighborhood
- Cortina HOA neighborhood
- Country Hollow Homeowners Association neighborhood
- Coventry Estates HOA neighborhood
- Daybreak Neighborhood neighborhood
- Denton Doubles neighborhood
- Desert Hope neighborhood
- Desert Springs Neighborhood neighborhood
- Desert Sunset neighborhood
- Double T Ranch neighborhood
- Eagle Pass neighborhood
- El Caminito Neighborhood neighborhood
- Emerald Point neighborhood
- Enclave at Arrowhead Ranch neighborhood
- Executive Palms neighborhood
- Eyes on Crime neighborhood
- Friends and Neighbors of Montara Park neighborhood
- Frier Drive Association neighborhood
- Garden Eye neighborhood
- Glen Acres neighborhood
- Glen Eden Community Association neighborhood
- Glencourt One neighborhood
- Glencourt Two Townhouse Association neighborhood
- Glencroft Residents Association neighborhood
- Glendale Parkside HOA neighborhood
- Glendale Sub Amended neighborhood
- Griffin Historic Neighborhood neighborhood
- Hearthstone Place/Estates neighborhood
- Hidden Manor HOA neighborhood
- Hidden Meadows Townhome Association neighborhood
- Hillcrest Ranch HOA neighborhood
- Historic Thunderbird Estates neighborhood
- Independence Heights neighborhood
- Ironwood Terrace Neighborhood Watch neighborhood
- J.U.I.C.E. Neighborhood neighborhood
- Joy Ranchos neighborhood
- La Buena Vida neighborhood
- Las Casas Neighborhood Association neighborhood
- Lexington Place neighborhood
- Manistee Ranch HOA neighborhood
- Marbrisa Ranch HOA neighborhood
- Marshall Ranch HOA neighborhood
- Maryland Heights Garden Homes neighborhood
- Maryland Lakes Condominiums neighborhood
- Maryland Manor neighborhood
- Maui Column neighborhood
- Mediterranean Gardens HOA neighborhood
- Miramonte Home Owners Association neighborhood
- Missouri Ranch HOA neighborhood
- Mohawk HOA neighborhood
- Monarch Point neighborhood
- Montebello Estates HOA neighborhood
- Mountain View Meadows Estates neighborhood
- New Brighton Place neighborhood
- Northern Manor West II neighborhood
- Northern Manor West Townhouse Association neighborhood
- O'Neil Ranch Association neighborhood
- Oakhollow Homeowners Association neighborhood
- Ocotillo Disctrict neighborhood
- Ocotillo Rose Neighborhood Association neighborhood
- Olive Glen HOA neighborhood
- Olive Green Villas HOA neighborhood
- Olive Place HOA neighborhood
- Olive Villas HOA neighborhood
- Orange Grove Estates neighborhood
- Orangewood West 79th Lane neighborhood
- Orchard Glen neighborhood
- Pace Rosewood Association neighborhood
- Paloma Estates Neighborhood Association neighborhood
- Palomino HOA neighborhood
- Paradise Views II neighborhood
- Paradise Vistas (PV HOA, Inc.) neighborhood
- Parkside Estates neighborhood
- Paseo Place HOA neighborhood
- Patrick Ranch HOA neighborhood
- Peoria Ave. Citizen's Group (Peoria Ave. South Citizen's Group) neighborhood
- Pioneer Neighborhood Association neighborhood
- Place Vendome HOA neighborhood
- Port Au Prince Neighborhood Association neighborhood
- Purdue Ave. Neighborhood Block Watch neighborhood
- Randolph Ranch neighborhood
- Raney Ranch HOA neighborhood
- Riviera Drive Estates HOA neighborhood
- Roadrunner Estates West neighborhood
- Rossmoor Village HOA No. 1 neighborhood
- Rovey Farm Estates HOA neighborhood
- Royal Palm neighborhood
- Royal Shadows HOA neighborhood
- Sahuaro District neighborhood
- Sahuaro Ranch Association neighborhood
- Sands Estates neighborhood
- Sands West Neighborhood neighborhood
- Santa Grande Neighborhood neighborhood
- Santa Maria Group neighborhood
- Secluded Acres and Estates neighborhood
- Sexton/Smith Subdivision neighborhood
- Shadow View Ranch neighborhood
- Shadown Run HOA neighborhood
- Shalimar HOA neighborhood
- Shamrock Mobile Home Park neighborhood
- Sierra Land in Brighton Manor neighborhood
- Skyview West 1 neighborhood
- Sonorita Neighborhood Association neighborhood
- Suaharo Glen Neighborhood Association neighborhood
- Summerfield Place III neighborhood
- Sunburst Farms neighborhood
- Suncrest Homes (Suncrest HOA, Inc.) neighborhood
- Sunrise Neighborhood Association neighborhood
- Sunset Estates HOA neighborhood
- Sunset Palms Neighborhood Watch neighborhood
- Sunset Vista neighborhood
- Sweetwater Estates neighborhood
- Tamarac at Maryland Lakes neighborhood
- Tanita Titans neighborhood
- Terrace Green HOA neighborhood
- The Carolers neighborhood
- The Friendly Riviera neighborhood
- The Heart of Glendale (Young Leaders of the Heart of Glendale) neighborhood
- The Highlands at Arrowhead Ranch neighborhood
- Thunderbird Estates neighborhood
- Thunderbird Quail Run neighborhood
- Tierra Buena Park Association neighborhood
- Topeka Partners neighborhood
- Trends '84 neighborhood
- Villa Charme V Neighborhood Association neighborhood
- Villas Glendale Townhouse Association neighborhood
- West Dale Estates neighborhood
- West Gardenia Association neighborhood
- West Glen Community Association neighborhood
- West Glenn Estates neighborhood
- West Plaza neighborhood
- West Plaza 3 - 4 (West Plaza 3 4) neighborhood
- West Plaza Estates neighborhood
- West Plaza I HOA neighborhood
- West Plaza II HOA neighborhood
- West Redfield Neighborhood Block Watch neighborhood
- West Tree 62nd Avenue Division neighborhood
- West Tree Angels neighborhood
- Westminster Village neighborhood
- Wild Horse Ranch neighborhood
- Windstream HOA neighborhood
- Woodglen Village Townhouse Association neighborhood
- Yucca Block Watch Group neighborhood
- Yucca District neighborhood
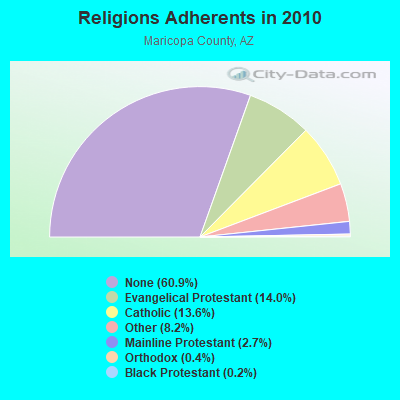
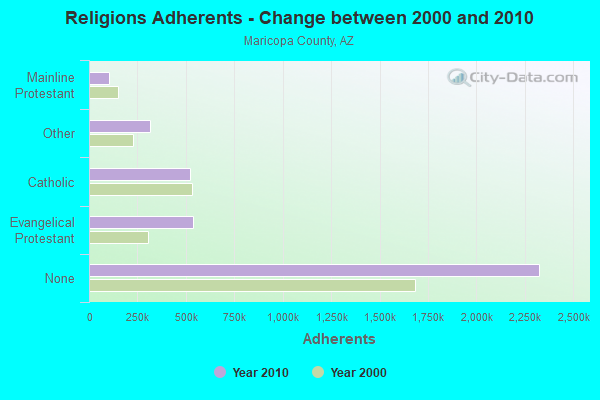
Religion statistics for Glendale, AZ (based on Maricopa County data)
| Religion | Adherents | Congregations |
|---|---|---|
| Evangelical Protestant | 534,453 | 1,206 |
| Catholic | 520,651 | 100 |
| Other | 312,574 | 680 |
| Mainline Protestant | 104,145 | 241 |
| Orthodox | 13,379 | 24 |
| Black Protestant | 6,278 | 48 |
| None | 2,325,637 | - |
Food Environment Statistics:
| This county: | 1.30 / 10,000 pop. |
| State: | 1.36 / 10,000 pop. |
| Maricopa County: | 0.16 / 10,000 pop. |
| Arizona: | 0.14 / 10,000 pop. |
| This county: | 0.57 / 10,000 pop. |
| Arizona: | 0.55 / 10,000 pop. |
| Maricopa County: | 1.99 / 10,000 pop. |
| Arizona: | 2.47 / 10,000 pop. |
| This county: | 5.86 / 10,000 pop. |
| State: | 6.21 / 10,000 pop. |
| Maricopa County: | 7.7% |
| Arizona: | 8.0% |
| Maricopa County: | 22.5% |
| Arizona: | 22.8% |
| Maricopa County: | 14.8% |
| Arizona: | 14.2% |
Health and Nutrition:
| This city: | 47.1% |
| State: | 49.0% |
| Here: | 45.0% |
| State: | 47.3% |
| Glendale: | 28.6 |
| Arizona: | 28.5 |
| Glendale: | 21.8% |
| Arizona: | 20.8% |
| Glendale: | 10.5% |
| Arizona: | 10.2% |
| Glendale: | 6.8 |
| State: | 6.8 |
| Glendale: | 32.8% |
| Arizona: | 33.5% |
| Glendale: | 55.3% |
| State: | 56.1% |
| Here: | 80.2% |
| State: | 79.4% |
More about Health and Nutrition of Glendale, AZ Residents
| Local government employment and payroll (March 2022) | |||||
| Function | Full-time employees | Monthly full-time payroll | Average yearly full-time wage | Part-time employees | Monthly part-time payroll |
|---|---|---|---|---|---|
| Police Protection - Officers | 414 | $3,684,352 | $106,793 | 65 | $121,677 |
| Firefighters | 252 | $2,208,245 | $105,155 | 0 | $0 |
| Water Supply | 154 | $1,013,348 | $78,962 | 4 | $6,853 |
| Financial Administration | 131 | $909,460 | $83,309 | 4 | $6,904 |
| Police - Other | 124 | $706,211 | $68,343 | 45 | $15,604 |
| Solid Waste Management | 115 | $639,672 | $66,748 | 0 | $0 |
| Housing and Community Development (Local) | 85 | $493,305 | $69,643 | 12 | $30,954 |
| Streets and Highways | 83 | $551,047 | $79,669 | 1 | $3,563 |
| Other Government Administration | 80 | $626,743 | $94,011 | 1 | $3,731 |
| Judicial and Legal | 77 | $542,108 | $84,484 | 9 | $15,615 |
| Parks and Recreation | 75 | $378,382 | $60,541 | 218 | $30,708 |
| Other and Unallocable | 63 | $392,600 | $74,781 | 0 | $0 |
| Fire - Other | 38 | $301,322 | $95,154 | 0 | $0 |
| Local Libraries | 36 | $211,281 | $70,427 | 31 | $53,736 |
| Transit | 28 | $131,489 | $56,352 | 12 | $32,820 |
| Correction | 17 | $83,357 | $58,840 | 0 | $0 |
| Airports | 6 | $37,902 | $75,804 | 1 | $2,431 |
| Totals for Government | 1,778 | $12,910,822 | $87,137 | 403 | $324,597 |
Glendale government finances - Expenditure in 2021 (per resident):
- Construction - Regular Highways: $33,885,000 ($134.39)
General - Other: $28,309,000 ($112.28)
Water Utilities: $8,512,000 ($33.76)
Local Fire Protection: $7,904,000 ($31.35)
Solid Waste Management: $5,075,000 ($20.13)
Sewerage: $3,856,000 ($15.29)
- Current Operations - Police Protection: $109,900,000 ($435.88)
Local Fire Protection: $56,461,000 ($223.93)
Water Utilities: $35,878,000 ($142.30)
General - Other: $31,051,000 ($123.15)
Solid Waste Management: $30,415,000 ($120.63)
Parks and Recreation: $29,147,000 ($115.60)
Housing and Community Development: $25,523,000 ($101.23)
Sewerage: $22,926,000 ($90.93)
Regular Highways: $16,745,000 ($66.41)
Transit Utilities: $13,579,000 ($53.86)
Judicial and Legal Services: $10,121,000 ($40.14)
Financial Administration: $8,492,000 ($33.68)
General Public Buildings: $6,303,000 ($25.00)
Libraries: $5,978,000 ($23.71)
Central Staff Services: $4,734,000 ($18.78)
Protective Inspection and Regulation - Other: $4,350,000 ($17.25)
Miscellaneous Commercial Activities - Other: $303,000 ($1.20)
- General - Interest on Debt: $22,405,000 ($88.86)
- Other Capital Outlay - Solid Waste Management: $606,000 ($2.40)
Transit Utilities: $434,000 ($1.72)
Regular Highways: $200,000 ($0.79)
Parks and Recreation: $59,000 ($0.23)
- Total Salaries and Wages: $82,651,000 ($327.80)
- Water Utilities - Interest on Debt: $9,152,000 ($36.30)
Glendale government finances - Revenue in 2021 (per resident):
- Charges - Sewerage: $39,787,000 ($157.80)
Solid Waste Management: $29,985,000 ($118.92)
Other: $14,971,000 ($59.38)
Parks and Recreation: $5,676,000 ($22.51)
Housing and Community Development: $3,569,000 ($14.16)
- Federal Intergovernmental - Housing and Community Development: $11,659,000 ($46.24)
- Local Intergovernmental - Housing and Community Development: $46,000 ($0.18)
Other: $15,000 ($0.06)
- Miscellaneous - General Revenue - Other: $6,003,000 ($23.81)
Fines and Forfeits: $3,380,000 ($13.41)
Interest Earnings: $1,802,000 ($7.15)
- Revenue - Water Utilities: $57,502,000 ($228.06)
Transit Utilities: $136,000 ($0.54)
- State Intergovernmental - General Local Government Support: $70,203,000 ($278.43)
Highways: $17,639,000 ($69.96)
Other: $9,225,000 ($36.59)
Transit Utilities: $3,522,000 ($13.97)
Sewerage: $640,000 ($2.54)
- Tax - General Sales and Gross Receipts: $214,451,000 ($850.54)
Property: $35,024,000 ($138.91)
Other License: $19,222,000 ($76.24)
Other Selective Sales: $1,070,000 ($4.24)
Glendale government finances - Debt in 2021 (per resident):
- Long Term Debt - Beginning Outstanding - Unspecified Public Purpose: $586,038,000 ($2324.29)
Outstanding Unspecified Public Purpose: $513,265,000 ($2035.67)
Retired Unspecified Public Purpose: $72,773,000 ($288.63)
Glendale government finances - Cash and Securities in 2021 (per resident):
- Bond Funds - Cash and Securities: $41,666,000 ($165.25)
- Other Funds - Cash and Securities: $391,701,000 ($1553.53)
- Sinking Funds - Cash and Securities: $75,342,000 ($298.81)
5.80% of this county's 2021 resident taxpayers lived in other counties in 2020 ($92,013 average adjusted gross income)
| Here: | 5.80% |
| Arizona average: | 6.85% |
0.02% of residents moved from foreign countries ($227 average AGI)
Maricopa County: 0.02% Arizona average: 0.03%
Top counties from which taxpayers relocated into this county between 2020 and 2021:
| from Pinal County, AZ | |
| from Los Angeles County, CA | |
| from Pima County, AZ |
5.04% of this county's 2020 resident taxpayers moved to other counties in 2021 ($76,911 average adjusted gross income)
| Here: | 5.04% |
| Arizona average: | 5.72% |
0.02% of residents moved to foreign countries ($234 average AGI)
Maricopa County: 0.02% Arizona average: 0.03%
Top counties to which taxpayers relocated from this county between 2020 and 2021:
| to Pinal County, AZ | |
| to Pima County, AZ | |
| to Yavapai County, AZ |
| Businesses in Glendale, AZ | ||||
| Name | Count | Name | Count | |
|---|---|---|---|---|
| 24 Hour Fitness | 1 | Johnny Rockets | 2 | |
| 7-Eleven | 2 | Jones New York | 3 | |
| 99 Cents Only Stores | 3 | Journeys | 1 | |
| ALDO | 1 | Justice | 2 | |
| AMF Bowling | 1 | KFC | 3 | |
| AT&T | 4 | Kincaid | 1 | |
| Ace Hardware | 5 | Kmart | 1 | |
| Aeropostale | 1 | Kohl's | 2 | |
| Albertsons | 2 | Kroger | 9 | |
| American Eagle Outfitters | 1 | LA Fitness | 2 | |
| Ann Taylor | 1 | La-Z-Boy | 1 | |
| Apple Store | 1 | Lane Bryant | 1 | |
| Applebee's | 2 | Lane Furniture | 4 | |
| Arby's | 5 | LensCrafters | 1 | |
| Ashley Furniture | 1 | Little Caesars Pizza | 5 | |
| AutoZone | 7 | Long John Silver's | 4 | |
| Bakers | 1 | Lowe's | 1 | |
| Baskin-Robbins | 1 | Macy's | 1 | |
| Bath & Body Works | 1 | Marriott | 4 | |
| Bed Bath & Beyond | 1 | MasterBrand Cabinets | 3 | |
| Big O Tires | 2 | McDonald's | 15 | |
| Blockbuster | 5 | Motherhood Maternity | 3 | |
| Brunswick Bowling & Billiards | 1 | New Balance | 2 | |
| Budget Car Rental | 1 | New York & Co | 1 | |
| Burger King | 9 | Nike | 5 | |
| CVS | 3 | OfficeMax | 2 | |
| Carl\s Jr. | 3 | Old Country Buffet | 1 | |
| Casual Male XL | 1 | Outback | 1 | |
| Catherines | 1 | Outback Steakhouse | 1 | |
| Charlotte Russe | 1 | Pac Sun | 1 | |
| Chevrolet | 1 | Panda Express | 5 | |
| Chico's | 1 | Papa John's Pizza | 2 | |
| Chipotle | 2 | Payless | 7 | |
| Chuck E. Cheese's | 1 | Penske | 1 | |
| Church's Chicken | 1 | PetSmart | 2 | |
| Cinnabon | 1 | Pizza Hut | 6 | |
| Circle K | 20 | Popeyes | 1 | |
| Clarks | 1 | Quality | 1 | |
| Cold Stone Creamery | 2 | Quiznos | 2 | |
| Coldwater Creek | 1 | RadioShack | 5 | |
| Comfort Suites | 1 | Ramada | 1 | |
| Costco | 1 | SONIC Drive-In | 6 | |
| Cracker Barrel | 1 | Safeway | 3 | |
| Cricket Wireless | 14 | Sam's Club | 1 | |
| Dairy Queen | 4 | Sears | 3 | |
| Dennys | 3 | Sephora | 1 | |
| Discount Tire | 4 | Skechers USA | 1 | |
| Domino's Pizza | 4 | Soma Intimates | 1 | |
| DressBarn | 1 | Spencer Gifts | 1 | |
| Dressbarn | 2 | Sprint Nextel | 5 | |
| Dunkin Donuts | 2 | Staples | 2 | |
| El Pollo Loco | 2 | Starbucks | 16 | |
| Ethan Allen | 1 | Subway | 18 | |
| Express | 1 | T-Mobile | 17 | |
| Famous Footwear | 2 | T.G.I. Driday's | 1 | |
| FedEx | 22 | Taco Bell | 11 | |
| Firestone Complete Auto Care | 2 | Talbots | 1 | |
| Foot Locker | 1 | Target | 2 | |
| Ford | 1 | The Room Place | 1 | |
| Forever 21 | 1 | Torrid | 1 | |
| GNC | 5 | Toys"R"Us | 3 | |
| GameStop | 8 | Trader Joe's | 1 | |
| Gymboree | 1 | U-Haul | 9 | |
| H&R Block | 11 | UPS | 19 | |
| Hilton | 1 | Vans | 6 | |
| Holiday Inn | 2 | Verizon Wireless | 7 | |
| Hollister Co. | 1 | Victoria's Secret | 1 | |
| Home Depot | 3 | Village Inn | 1 | |
| Hot Topic | 1 | Vons | 3 | |
| IHOP | 1 | Walgreens | 11 | |
| JCPenney | 1 | Walmart | 7 | |
| Jack In The Box | 7 | Wendy's | 4 | |
| Jamba Juice | 1 | Wet Seal | 1 | |
| Jimmy John's | 1 | YMCA | 2 | |
| JoS. A. Bank | 1 | |||
Strongest AM radio stations in Glendale:
- KPXQ (1360 AM; 50 kW; GLENDALE, AZ; Owner: COMMON GROUND BROADCASTING, INC.)
- KGME (910 AM; 5 kW; PHOENIX, AZ; Owner: AMFM RADIO LICENSES, L.L.C.)
- KXEM (1010 AM; 15 kW; TOLLESON, AZ; Owner: JAMES CRYSTAL ENTERPRISES OF PHOENIX, INC.)
- KFNX (1100 AM; 50 kW; CAVE CREEK, AZ; Owner: NORTH AMERICAN BROADCASTING CO., INC.)
- KFNN (1510 AM; 22 kW; MESA, AZ; Owner: CRC BROADCASTING COMPANY, INC.)
- KMIK (1580 AM; 50 kW; TEMPE, AZ; Owner: ABC, INC.)
- KMIA (710 AM; 50 kW; BLACK CANYON CITY, AZ; Owner: ENTRAVISION HOLDINGS, LLC)
- KTAR (620 AM; 5 kW; PHOENIX, AZ; Owner: EMMIS RADIO LICENSE CORPORATION)
- KMYL (1190 AM; 5 kW; TOLLESON, AZ; Owner: INTERSTATE B/C SYSTEM OF AZ, INC.)
- KXEG (1280 AM; 2 kW; PHOENIX, AZ; Owner: MORTENSON BROADCASTING COMPANY OF ARIZONA, LLC)
- KASA (1540 AM; 10 kW; PHOENIX, AZ; Owner: KASA RADIO HOGAR, INC.)
- KFYI (550 AM; 5 kW; PHOENIX, AZ; Owner: AMFM RADIO LICENSES, L.L.C.)
- KKNT (960 AM; 5 kW; PHOENIX, AZ; Owner: COMMON GROUND BROADCASTING, INC)
Strongest FM radio stations in Glendale:
- KMLE (107.9 FM; CHANDLER, AZ; Owner: INFINITY RADIO OPERATIONS INC.)
- KNAI (88.3 FM; PHOENIX, AZ; Owner: NATIONAL FARM WORKERS SERVICE CENTER)
- K205CI (88.9 FM; PHOENIX, AZ; Owner: FAMILY STATIONS, INC.)
- KOMR (106.3 FM; SUN CITY, AZ; Owner: HBC LICENSE CORPORATION)
- K248AL (97.5 FM; PHOENIX, AZ; Owner: ZORBA RESOURCES, INC.)
- KLNZ (103.5 FM; GLENDALE, AZ; Owner: ENTRAVISION HOLDINGS, LLC)
- KPHF (88.3 FM; PHOENIX, AZ; Owner: FAMILY STATIONS, INC.)
- KBAQ (89.5 FM; PHOENIX, AZ; Owner: MARICOPA COUNTY COMMUNITY COLLEGE DISTRICT)
- KSLX-FM (100.7 FM; SCOTTSDALE, AZ; Owner: CACTUS RADIO, INC.)
- KKLT (98.7 FM; PHOENIX, AZ; Owner: EMMIS RADIO LICENSE CORPORATION)
- KKFR (92.3 FM; GLENDALE, AZ; Owner: EMMIS RADIO LICENSE CORPORATION)
- KZON (101.5 FM; PHOENIX, AZ; Owner: INFINITY RADIO OPERATIONS INC.)
- KESZ (99.9 FM; PHOENIX, AZ; Owner: CLEAR CHANNEL BROADCASTING LICENSES, INC.)
- KOOL-FM (94.5 FM; PHOENIX, AZ; Owner: INFINITY RADIO OPERATIONS INC.)
- KNIX-FM (102.5 FM; PHOENIX, AZ; Owner: CLEAR CHANNEL BROADCASTING LICENSES, INC.)
- KUPD (97.9 FM; TEMPE, AZ; Owner: TEMPE RADIO, INC.)
- KJZZ (91.5 FM; PHOENIX, AZ; Owner: MARICOPA COUNTY COMM. COLLEGE DIST.)
- KFLR-FM (90.3 FM; PHOENIX, AZ; Owner: FAMILY LIFE BROADCASTING, INC.)
- KYOT-FM (95.5 FM; PHOENIX, AZ; Owner: AMFM RADIO LICENSES, L.L.C.)
- KMXP (96.9 FM; PHOENIX, AZ; Owner: CITICASTERS LICENSES, L.P.)
TV broadcast stations around Glendale:
- KAET (Channel 8; PHOENIX, AZ; Owner: ARIZONA BOARD OF REGENTS)
- K43GV (Channel 43; PHOENIX, AZ; Owner: TELEVISION APOGEO DE PHOENIX, LLC)
- K55EH (Channel 55; PHOENIX, AZ; Owner: KAZT, L.L.C.)
- K25DM (Channel 25; PHOENIX, AZ; Owner: KDMA CHANNEL 25, INC.)
- KPHO-TV (Channel 5; PHOENIX, AZ; Owner: MEREDITH CORPORATION)
- KTVK (Channel 3; PHOENIX, AZ; Owner: KTVK, INC.)
- KPPX (Channel 51; TOLLESON, AZ; Owner: AMERICA 51, L.P.)
- KUTP (Channel 45; PHOENIX, AZ; Owner: FOX TELEVISION STATIONS, INC.)
- KPNX (Channel 12; MESA, AZ; Owner: MULTIMEDIA HOLDINGS CORPORATION)
- KSAZ-TV (Channel 10; PHOENIX, AZ; Owner: KSAZ LICENSE, INC.)
- KASW (Channel 61; PHOENIX, AZ; Owner: KASW-TV, INC.)
- KNXV-TV (Channel 15; PHOENIX, AZ; Owner: SCRIPPS HOWARD BROADCASTING COMPANY)
- KTVW-TV (Channel 33; PHOENIX, AZ; Owner: KTVW LICENSE PARTNERSHIP, G.P.)
- K53GF (Channel 53; PHOENIX, AZ; Owner: SPANISH INDEPENDENT BROADCAST NETWORK, LLC)
- KDRX-CA (Channel 48; PHOENIX, AZ; Owner: NBC TELEMUNDO PHOENIX, INC.)
- KFPH-CA (Channel 39; PHOENIX, AZ; Owner: TELEFUTURA PARTNERSHIP OF PHOENIX)
- National Bridge Inventory (NBI) Statistics
- 141Number of bridges
- 1,860ft / 567mTotal length
- $211,000Total costs
- 3,871,220Total average daily traffic
- 247,006Total average daily truck traffic
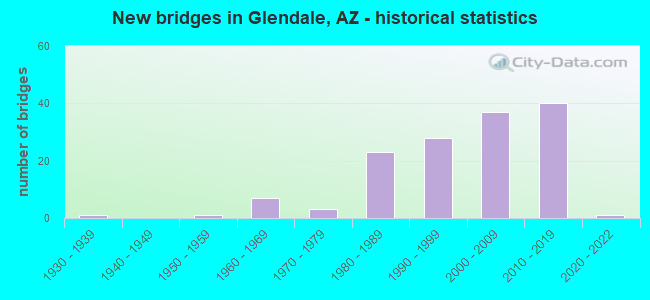
- New bridges - historical statistics
- 11930-1939
- 11950-1959
- 71960-1969
- 31970-1979
- 231980-1989
- 281990-1999
- 372000-2009
- 402010-2019
- 12020-2022
FCC Registered Antenna Towers: 262 (See the full list of FCC Registered Antenna Towers)
FCC Registered Commercial Land Mobile Towers: 4 (See the full list of FCC Registered Commercial Land Mobile Towers in Glendale, AZ)
FCC Registered Private Land Mobile Towers: 2 (See the full list of FCC Registered Private Land Mobile Towers)
FCC Registered Broadcast Land Mobile Towers: 112 (See the full list of FCC Registered Broadcast Land Mobile Towers)
FCC Registered Microwave Towers: 154 (See the full list of FCC Registered Microwave Towers in this town)
FCC Registered Paging Towers: 1 (See the full list of FCC Registered Paging Towers)
FCC Registered Maritime Coast & Aviation Ground Towers: 10 (See the full list of FCC Registered Maritime Coast & Aviation Ground Towers)
FCC Registered Amateur Radio Licenses: 1,323 (See the full list of FCC Registered Amateur Radio Licenses in Glendale)
FAA Registered Aircraft Manufacturers and Dealers: 4 (See the full list of FAA Registered Manufacturers and Dealers in Glendale)
FAA Registered Aircraft: 212 (See the full list of FAA Registered Aircraft)
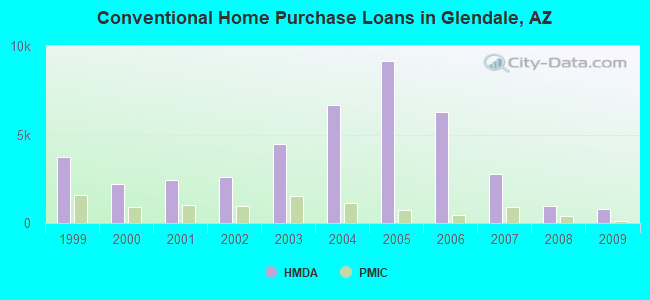
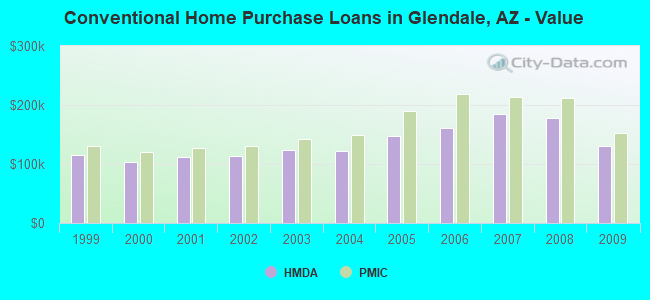
| Home Mortgage Disclosure Act Aggregated Statistics For Year 2009 (Based on 42 full and 6 partial tracts) | ||||||||||||||
| A) FHA, FSA/RHS & VA Home Purchase Loans | B) Conventional Home Purchase Loans | C) Refinancings | D) Home Improvement Loans | E) Loans on Dwellings For 5+ Families | F) Non-occupant Loans on < 5 Family Dwellings (A B C & D) | G) Loans On Manufactured Home Dwelling (A B C & D) | ||||||||
|---|---|---|---|---|---|---|---|---|---|---|---|---|---|---|
| Number | Average Value | Number | Average Value | Number | Average Value | Number | Average Value | Number | Average Value | Number | Average Value | Number | Average Value | |
| LOANS ORIGINATED | 1,528 | $130,378 | 797 | $130,719 | 2,491 | $168,835 | 60 | $99,425 | 2 | $8,517,500 | 381 | $106,989 | 23 | $82,333 |
| APPLICATIONS APPROVED, NOT ACCEPTED | 93 | $134,684 | 78 | $115,632 | 348 | $174,090 | 20 | $48,291 | 0 | $0 | 38 | $113,570 | 3 | $92,240 |
| APPLICATIONS DENIED | 296 | $125,317 | 229 | $124,766 | 1,407 | $180,647 | 110 | $47,039 | 1 | $400,000 | 172 | $126,575 | 22 | $84,991 |
| APPLICATIONS WITHDRAWN | 179 | $136,931 | 93 | $146,900 | 662 | $171,537 | 30 | $69,295 | 3 | $10,159,850 | 80 | $112,849 | 4 | $98,568 |
| FILES CLOSED FOR INCOMPLETENESS | 44 | $133,211 | 28 | $130,258 | 168 | $182,431 | 10 | $83,409 | 0 | $0 | 19 | $113,048 | 1 | $57,840 |
Detailed mortgage data for all 47 tracts in Glendale, AZ
| Private Mortgage Insurance Companies Aggregated Statistics For Year 2009 (Based on 37 full and 4 partial tracts) | ||||||
| A) Conventional Home Purchase Loans | B) Refinancings | C) Non-occupant Loans on < 5 Family Dwellings (A & B) | ||||
|---|---|---|---|---|---|---|
| Number | Average Value | Number | Average Value | Number | Average Value | |
| LOANS ORIGINATED | 120 | $153,381 | 35 | $182,565 | 8 | $143,780 |
| APPLICATIONS APPROVED, NOT ACCEPTED | 34 | $181,515 | 22 | $212,799 | 3 | $161,720 |
| APPLICATIONS DENIED | 32 | $140,979 | 3 | $165,013 | 3 | $178,330 |
| APPLICATIONS WITHDRAWN | 10 | $206,255 | 6 | $275,637 | 0 | $0 |
| FILES CLOSED FOR INCOMPLETENESS | 7 | $130,454 | 4 | $280,452 | 1 | $146,100 |
2003 - 2015 National Fire Incident Reporting System (NFIRS) incidents
- Fire incident types reported to NFIRS in Glendale, AZ
- 4,48156.8%Outside Fires
- 1,74522.1%Structure Fires
- 1,31016.6%Mobile Property/Vehicle Fires
- 3474.4%Other
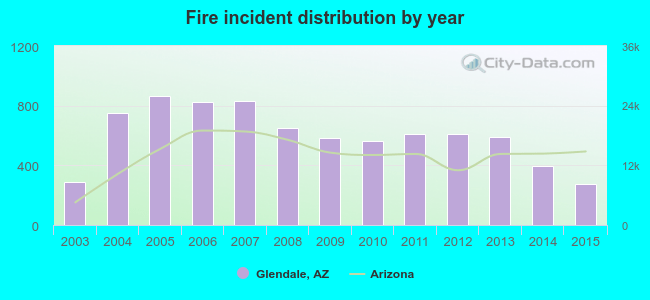 Based on the data from the years 2003 - 2015 the average number of fires per year is 602. The highest number of reported fires - 862 took place in 2005, and the least - 273 in 2015. The data has a declining trend.
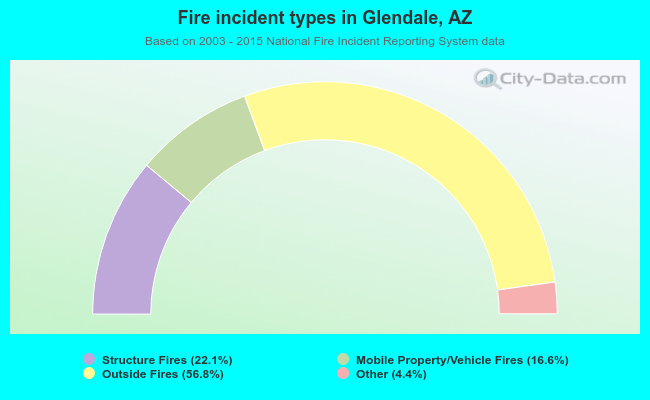 When looking into fire subcategories, the most reports belonged to: Outside Fires (56.8%), and Structure Fires (22.1%).
Fire-safe hotels and motels in Glendale, Arizona:
- Springhill Suites Glendale/Peoria, 7810 W Bell Rd, Glendale, Arizona 85038 , Phone: (623) 878-6666, Fax: (623) 878-6611
- Ramada, 7885 W Arrowhead Towne Ctr, Glendale, Arizona 85308 , Phone: (623) 412-2000, Fax: (623) 399-6707
- Quality Inn Glendale, 7116 N 59th Ave, Glendale, Arizona 85301 , Phone: (623) 939-9431, Fax: (623) 937-3137
- Hampton Inn & Suites - Phoenix Glendale/Westgate, 6630 N 95th Ave, Glendale, Arizona 85305 , Phone: (623) 271-7771, Fax: (623) 271-7772
- Comfort Suites - Glendale, 9824 W Camelback Rd, Glendale, Arizona 85305 , Phone: (623) 271-9005, Fax: (623) 271-9808
- Holiday Inn Hotel & Suites, 9310 W Cabela Dr, Glendale, Arizona 85305 , Phone: (623) 939-8888, Fax: (623) 939-3092
- Staybridge Suites, 9340 W Cabela Dr, Glendale, Arizona 85305 , Phone: (623) 842-0000, Fax: (623) 931-1328
- Glendale Residence Inn, 7350 N Zanjero Blvd, Glendale, Arizona 85305 , Phone: (623) 772-8900, Fax: (623) 772-8905
- 4 other hotels and motels
| Most common first names in Glendale, AZ among deceased individuals | ||
| Name | Count | Lived (average) |
|---|---|---|
| John | 691 | 73.2 years |
| Mary | 626 | 78.4 years |
| Robert | 622 | 69.6 years |
| William | 568 | 72.5 years |
| James | 509 | 69.1 years |
| Charles | 371 | 72.8 years |
| George | 346 | 75.2 years |
| Helen | 337 | 80.7 years |
| Dorothy | 325 | 78.3 years |
| Margaret | 313 | 79.1 years |
| Most common last names in Glendale, AZ among deceased individuals | ||
| Last name | Count | Lived (average) |
|---|---|---|
| Smith | 258 | 74.5 years |
| Johnson | 185 | 73.9 years |
| Miller | 176 | 74.3 years |
| Brown | 129 | 73.1 years |
| Jones | 123 | 74.6 years |
| Davis | 114 | 73.7 years |
| Williams | 101 | 68.4 years |
| Thompson | 97 | 73.2 years |
| Wilson | 90 | 74.4 years |
| Martin | 86 | 76.4 years |
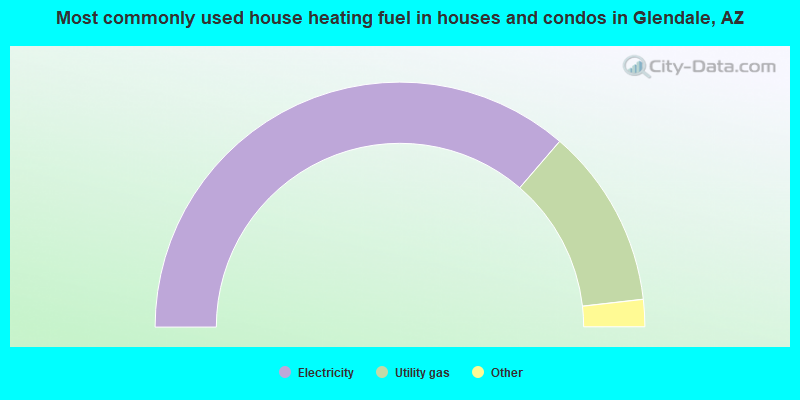
- 72.7%Electricity
- 23.8%Utility gas
- 1.6%Solar energy
- 1.3%No fuel used
- 0.6%Bottled, tank, or LP gas
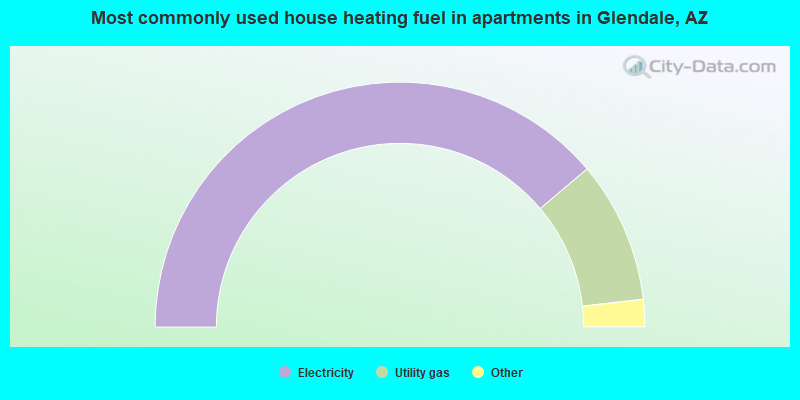
- 77.7%Electricity
- 18.7%Utility gas
- 1.6%Other fuel
- 1.3%No fuel used
- 0.5%Bottled, tank, or LP gas
- 0.2%Solar energy
Glendale compared to Arizona state average:
- Unemployed percentage below state average.
- Foreign-born population percentage above state average.
Glendale, AZ compared to other similar cities:
Glendale on our top lists:
- #3 on the list of "Top 101 cities with the highest average sunshine amount (population 50,000+)"
- #5 on the list of "Top 101 cities with the hottest summers (population 50,000+)"
- #5 on the list of "Top 101 cities with the highest number of days clear of clouds (population 50,000+)"
- #5 on the list of "Top 101 cities with the lowest number of days clear of clouds (population 50,000+)"
- #8 on the list of "Top 101 larger cities with the largest decrease or smallest increase in household income from 2000 (population 50,000+)"
- #9 on the list of "Top 101 cities with the highest daily high temperatures (population 50,000+)"
- #11 on the list of "Top 101 cities with the lowest average humidity (population 50,000+)"
- #13 on the list of "Top 101 cities with the lowest minimum monthly morning or afternoon humidity (population 50,000+)"
- #15 on the list of "Top 101 cities with the highest number of thefts per 100,000 residents, excludes tourist destinations and others with a lot of outsiders visiting based on city industries data (population 50,000+)"
- #30 on the list of "Top 101 cities with the lowest maximum monthly morning or afternoon humidity (population 50,000+)"
- #30 on the list of "Top 101 cities with the largest percentage of people in military disciplinary barracks (population 1,000+)"
- #34 on the list of "Top 101 cities with the lowest average yearly precipitation (population 50,000+)"
- #34 on the list of "Top 101 cities with largest percentage of males in industries: retail trade (population 50,000+)"
- #46 on the list of "Top 101 cities with the smallest precipitation differences during a year (population 50,000+)"
- #49 on the list of "Top 101 cities with the largest differences between daily high and daily low temperatures (population 50,000+)"
- #51 on the list of "Top 101 cities with the lowest average wind speeds (population 50,000+)"
- #68 on the list of "Top 101 cities with largest percentage of females in industries: real estate and rental and leasing (population 50,000+)"
- #76 on the list of "Top 101 cities with the highest average temperatures (population 50,000+)"
- #78 on the list of "Top 101 cities with the largest percentage of people in military transient quarters for temporary residents (population 1,000+)"
- #81 on the list of "Top 101 cities with largest percentage of males in industries: utilities (population 50,000+)"
- #59 (85031) on the list of "Top 101 zip codes with the smallest percentage of taxpayers reporting taxable interest in 2012 (pop 5,000+)"
- #74 (85308) on the list of "Top 101 zip codes with the most beauty salons in 2005"
- #2 on the list of "Top 101 counties with the highest Nitrogen Dioxide air pollution readings in 2012 (ppm)"
- #3 on the list of "Top 101 counties with the highest total withdrawal of fresh water for public supply"
- #3 on the list of "Top 101 counties with the highest surface withdrawal of fresh water for public supply"
- #4 on the list of "Top 101 counties with the most Other congregations"
- #5 on the list of "Top 101 counties with the most Evangelical Protestant adherents (pop. 50,000+)"

|
|
Total of 998 patent applications in 2008-2024.