Tolleson, Arizona Submit your own pictures of this city and show them to the world
OSM Map
General Map
Google Map
MSN Map
OSM Map
General Map
Google Map
MSN Map
OSM Map
General Map
Google Map
MSN Map
OSM Map
General Map
Google Map
MSN Map
Please wait while loading the map...
Population in 2022: 7,258 (100% urban, 0% rural). Population change since 2000: +45.9%Males: 3,500 Females: 3,758
March 2022 cost of living index in Tolleson: 101.9 (near average, U.S. average is 100) Percentage of residents living in poverty in 2022: 22.0%for White Non-Hispanic residents , 33.3% for Black residents , 18.9% for Hispanic or Latino residents , 100.0% for American Indian residents , 15.3% for other race residents , 31.5% for two or more races residents )
Profiles of local businesses
Business Search - 14 Million verified businesses
Data:
Median household income ($)
Median household income (% change since 2000)
Household income diversity
Ratio of average income to average house value (%)
Ratio of average income to average rent
Median household income ($) - White
Median household income ($) - Black or African American
Median household income ($) - Asian
Median household income ($) - Hispanic or Latino
Median household income ($) - American Indian and Alaska Native
Median household income ($) - Multirace
Median household income ($) - Other Race
Median household income for houses/condos with a mortgage ($)
Median household income for apartments without a mortgage ($)
Races - White alone (%)
Races - White alone (% change since 2000)
Races - Black alone (%)
Races - Black alone (% change since 2000)
Races - American Indian alone (%)
Races - American Indian alone (% change since 2000)
Races - Asian alone (%)
Races - Asian alone (% change since 2000)
Races - Hispanic (%)
Races - Hispanic (% change since 2000)
Races - Native Hawaiian and Other Pacific Islander alone (%)
Races - Native Hawaiian and Other Pacific Islander alone (% change since 2000)
Races - Two or more races (%)
Races - Two or more races (% change since 2000)
Races - Other race alone (%)
Races - Other race alone (% change since 2000)
Racial diversity
Unemployment (%)
Unemployment (% change since 2000)
Unemployment (%) - White
Unemployment (%) - Black or African American
Unemployment (%) - Asian
Unemployment (%) - Hispanic or Latino
Unemployment (%) - American Indian and Alaska Native
Unemployment (%) - Multirace
Unemployment (%) - Other Race
Population density (people per square mile)
Population - Males (%)
Population - Females (%)
Population - Males (%) - White
Population - Males (%) - Black or African American
Population - Males (%) - Asian
Population - Males (%) - Hispanic or Latino
Population - Males (%) - American Indian and Alaska Native
Population - Males (%) - Multirace
Population - Males (%) - Other Race
Population - Females (%) - White
Population - Females (%) - Black or African American
Population - Females (%) - Asian
Population - Females (%) - Hispanic or Latino
Population - Females (%) - American Indian and Alaska Native
Population - Females (%) - Multirace
Population - Females (%) - Other Race
Coronavirus confirmed cases (Apr 28, 2024)
Deaths caused by coronavirus (Apr 28, 2024)
Coronavirus confirmed cases (per 100k population) (Apr 28, 2024)
Deaths caused by coronavirus (per 100k population) (Apr 28, 2024)
Daily increase in number of cases (Apr 28, 2024)
Weekly increase in number of cases (Apr 28, 2024)
Cases doubled (in days) (Apr 28, 2024)
Hospitalized patients (Apr 18, 2022)
Negative test results (Apr 18, 2022)
Total test results (Apr 18, 2022)
COVID Vaccine doses distributed (per 100k population) (Sep 19, 2023)
COVID Vaccine doses administered (per 100k population) (Sep 19, 2023)
COVID Vaccine doses distributed (Sep 19, 2023)
COVID Vaccine doses administered (Sep 19, 2023)
Likely homosexual households (%)
Likely homosexual households (% change since 2000)
Likely homosexual households - Lesbian couples (%)
Likely homosexual households - Lesbian couples (% change since 2000)
Likely homosexual households - Gay men (%)
Likely homosexual households - Gay men (% change since 2000)
Cost of living index
Median gross rent ($)
Median contract rent ($)
Median monthly housing costs ($)
Median house or condo value ($)
Median house or condo value ($ change since 2000)
Mean house or condo value by units in structure - 1, detached ($)
Mean house or condo value by units in structure - 1, attached ($)
Mean house or condo value by units in structure - 2 ($)
Mean house or condo value by units in structure by units in structure - 3 or 4 ($)
Mean house or condo value by units in structure - 5 or more ($)
Mean house or condo value by units in structure - Boat, RV, van, etc. ($)
Mean house or condo value by units in structure - Mobile home ($)
Median house or condo value ($) - White
Median house or condo value ($) - Black or African American
Median house or condo value ($) - Asian
Median house or condo value ($) - Hispanic or Latino
Median house or condo value ($) - American Indian and Alaska Native
Median house or condo value ($) - Multirace
Median house or condo value ($) - Other Race
Median resident age
Resident age diversity
Median resident age - Males
Median resident age - Females
Median resident age - White
Median resident age - Black or African American
Median resident age - Asian
Median resident age - Hispanic or Latino
Median resident age - American Indian and Alaska Native
Median resident age - Multirace
Median resident age - Other Race
Median resident age - Males - White
Median resident age - Males - Black or African American
Median resident age - Males - Asian
Median resident age - Males - Hispanic or Latino
Median resident age - Males - American Indian and Alaska Native
Median resident age - Males - Multirace
Median resident age - Males - Other Race
Median resident age - Females - White
Median resident age - Females - Black or African American
Median resident age - Females - Asian
Median resident age - Females - Hispanic or Latino
Median resident age - Females - American Indian and Alaska Native
Median resident age - Females - Multirace
Median resident age - Females - Other Race
Commute - mean travel time to work (minutes)
Travel time to work - Less than 5 minutes (%)
Travel time to work - Less than 5 minutes (% change since 2000)
Travel time to work - 5 to 9 minutes (%)
Travel time to work - 5 to 9 minutes (% change since 2000)
Travel time to work - 10 to 19 minutes (%)
Travel time to work - 10 to 19 minutes (% change since 2000)
Travel time to work - 20 to 29 minutes (%)
Travel time to work - 20 to 29 minutes (% change since 2000)
Travel time to work - 30 to 39 minutes (%)
Travel time to work - 30 to 39 minutes (% change since 2000)
Travel time to work - 40 to 59 minutes (%)
Travel time to work - 40 to 59 minutes (% change since 2000)
Travel time to work - 60 to 89 minutes (%)
Travel time to work - 60 to 89 minutes (% change since 2000)
Travel time to work - 90 or more minutes (%)
Travel time to work - 90 or more minutes (% change since 2000)
Marital status - Never married (%)
Marital status - Now married (%)
Marital status - Separated (%)
Marital status - Widowed (%)
Marital status - Divorced (%)
Median family income ($)
Median family income (% change since 2000)
Median non-family income ($)
Median non-family income (% change since 2000)
Median per capita income ($)
Median per capita income (% change since 2000)
Median family income ($) - White
Median family income ($) - Black or African American
Median family income ($) - Asian
Median family income ($) - Hispanic or Latino
Median family income ($) - American Indian and Alaska Native
Median family income ($) - Multirace
Median family income ($) - Other Race
Median year house/condo built
Median year apartment built
Year house built - Built 2005 or later (%)
Year house built - Built 2000 to 2004 (%)
Year house built - Built 1990 to 1999 (%)
Year house built - Built 1980 to 1989 (%)
Year house built - Built 1970 to 1979 (%)
Year house built - Built 1960 to 1969 (%)
Year house built - Built 1950 to 1959 (%)
Year house built - Built 1940 to 1949 (%)
Year house built - Built 1939 or earlier (%)
Average household size
Household density (households per square mile)
Average household size - White
Average household size - Black or African American
Average household size - Asian
Average household size - Hispanic or Latino
Average household size - American Indian and Alaska Native
Average household size - Multirace
Average household size - Other Race
Occupied housing units (%)
Vacant housing units (%)
Owner occupied housing units (%)
Renter occupied housing units (%)
Vacancy status - For rent (%)
Vacancy status - For sale only (%)
Vacancy status - Rented or sold, not occupied (%)
Vacancy status - For seasonal, recreational, or occasional use (%)
Vacancy status - For migrant workers (%)
Vacancy status - Other vacant (%)
Residents with income below the poverty level (%)
Residents with income below 50% of the poverty level (%)
Children below poverty level (%)
Poor families by family type - Married-couple family (%)
Poor families by family type - Male, no wife present (%)
Poor families by family type - Female, no husband present (%)
Poverty status for native-born residents (%)
Poverty status for foreign-born residents (%)
Poverty among high school graduates not in families (%)
Poverty among people who did not graduate high school not in families (%)
Residents with income below the poverty level (%) - White
Residents with income below the poverty level (%) - Black or African American
Residents with income below the poverty level (%) - Asian
Residents with income below the poverty level (%) - Hispanic or Latino
Residents with income below the poverty level (%) - American Indian and Alaska Native
Residents with income below the poverty level (%) - Multirace
Residents with income below the poverty level (%) - Other Race
Air pollution - Air Quality Index (AQI)
Air pollution - CO
Air pollution - NO2
Air pollution - SO2
Air pollution - Ozone
Air pollution - PM10
Air pollution - PM25
Air pollution - Pb
Crime - Murders per 100,000 population
Crime - Rapes per 100,000 population
Crime - Robberies per 100,000 population
Crime - Assaults per 100,000 population
Crime - Burglaries per 100,000 population
Crime - Thefts per 100,000 population
Crime - Auto thefts per 100,000 population
Crime - Arson per 100,000 population
Crime - City-data.com crime index
Crime - Violent crime index
Crime - Property crime index
Crime - Murders per 100,000 population (5 year average)
Crime - Rapes per 100,000 population (5 year average)
Crime - Robberies per 100,000 population (5 year average)
Crime - Assaults per 100,000 population (5 year average)
Crime - Burglaries per 100,000 population (5 year average)
Crime - Thefts per 100,000 population (5 year average)
Crime - Auto thefts per 100,000 population (5 year average)
Crime - Arson per 100,000 population (5 year average)
Crime - City-data.com crime index (5 year average)
Crime - Violent crime index (5 year average)
Crime - Property crime index (5 year average)
1996 Presidential Elections Results (%) - Democratic Party (Clinton)
1996 Presidential Elections Results (%) - Republican Party (Dole)
1996 Presidential Elections Results (%) - Other
2000 Presidential Elections Results (%) - Democratic Party (Gore)
2000 Presidential Elections Results (%) - Republican Party (Bush)
2000 Presidential Elections Results (%) - Other
2004 Presidential Elections Results (%) - Democratic Party (Kerry)
2004 Presidential Elections Results (%) - Republican Party (Bush)
2004 Presidential Elections Results (%) - Other
2008 Presidential Elections Results (%) - Democratic Party (Obama)
2008 Presidential Elections Results (%) - Republican Party (McCain)
2008 Presidential Elections Results (%) - Other
2012 Presidential Elections Results (%) - Democratic Party (Obama)
2012 Presidential Elections Results (%) - Republican Party (Romney)
2012 Presidential Elections Results (%) - Other
2016 Presidential Elections Results (%) - Democratic Party (Clinton)
2016 Presidential Elections Results (%) - Republican Party (Trump)
2016 Presidential Elections Results (%) - Other
2020 Presidential Elections Results (%) - Democratic Party (Biden)
2020 Presidential Elections Results (%) - Republican Party (Trump)
2020 Presidential Elections Results (%) - Other
Ancestries Reported - Arab (%)
Ancestries Reported - Czech (%)
Ancestries Reported - Danish (%)
Ancestries Reported - Dutch (%)
Ancestries Reported - English (%)
Ancestries Reported - French (%)
Ancestries Reported - French Canadian (%)
Ancestries Reported - German (%)
Ancestries Reported - Greek (%)
Ancestries Reported - Hungarian (%)
Ancestries Reported - Irish (%)
Ancestries Reported - Italian (%)
Ancestries Reported - Lithuanian (%)
Ancestries Reported - Norwegian (%)
Ancestries Reported - Polish (%)
Ancestries Reported - Portuguese (%)
Ancestries Reported - Russian (%)
Ancestries Reported - Scotch-Irish (%)
Ancestries Reported - Scottish (%)
Ancestries Reported - Slovak (%)
Ancestries Reported - Subsaharan African (%)
Ancestries Reported - Swedish (%)
Ancestries Reported - Swiss (%)
Ancestries Reported - Ukrainian (%)
Ancestries Reported - United States (%)
Ancestries Reported - Welsh (%)
Ancestries Reported - West Indian (%)
Ancestries Reported - Other (%)
Educational Attainment - No schooling completed (%)
Educational Attainment - Less than high school (%)
Educational Attainment - High school or equivalent (%)
Educational Attainment - Less than 1 year of college (%)
Educational Attainment - 1 or more years of college (%)
Educational Attainment - Associate degree (%)
Educational Attainment - Bachelor's degree (%)
Educational Attainment - Master's degree (%)
Educational Attainment - Professional school degree (%)
Educational Attainment - Doctorate degree (%)
School Enrollment - Nursery, preschool (%)
School Enrollment - Kindergarten (%)
School Enrollment - Grade 1 to 4 (%)
School Enrollment - Grade 5 to 8 (%)
School Enrollment - Grade 9 to 12 (%)
School Enrollment - College undergrad (%)
School Enrollment - Graduate or professional (%)
School Enrollment - Not enrolled in school (%)
School enrollment - Public schools (%)
School enrollment - Private schools (%)
School enrollment - Not enrolled (%)
Median number of rooms in houses and condos
Median number of rooms in apartments
Housing units lacking complete plumbing facilities (%)
Housing units lacking complete kitchen facilities (%)
Density of houses
Urban houses (%)
Rural houses (%)
Households with people 60 years and over (%)
Households with people 65 years and over (%)
Households with people 75 years and over (%)
Households with one or more nonrelatives (%)
Households with no nonrelatives (%)
Population in households (%)
Family households (%)
Nonfamily households (%)
Population in families (%)
Family households with own children (%)
Median number of bedrooms in owner occupied houses
Mean number of bedrooms in owner occupied houses
Median number of bedrooms in renter occupied houses
Mean number of bedrooms in renter occupied houses
Median number of vehichles in owner occupied houses
Mean number of vehichles in owner occupied houses
Median number of vehichles in renter occupied houses
Mean number of vehichles in renter occupied houses
Mortgage status - with mortgage (%)
Mortgage status - with second mortgage (%)
Mortgage status - with home equity loan (%)
Mortgage status - with both second mortgage and home equity loan (%)
Mortgage status - without a mortgage (%)
Average family size
Average family size - White
Average family size - Black or African American
Average family size - Asian
Average family size - Hispanic or Latino
Average family size - American Indian and Alaska Native
Average family size - Multirace
Average family size - Other Race
Geographical mobility - Same house 1 year ago (%)
Geographical mobility - Moved within same county (%)
Geographical mobility - Moved from different county within same state (%)
Geographical mobility - Moved from different state (%)
Geographical mobility - Moved from abroad (%)
Place of birth - Born in state of residence (%)
Place of birth - Born in other state (%)
Place of birth - Native, outside of US (%)
Place of birth - Foreign born (%)
Housing units in structures - 1, detached (%)
Housing units in structures - 1, attached (%)
Housing units in structures - 2 (%)
Housing units in structures - 3 or 4 (%)
Housing units in structures - 5 to 9 (%)
Housing units in structures - 10 to 19 (%)
Housing units in structures - 20 to 49 (%)
Housing units in structures - 50 or more (%)
Housing units in structures - Mobile home (%)
Housing units in structures - Boat, RV, van, etc. (%)
House/condo owner moved in on average (years ago)
Renter moved in on average (years ago)
Year householder moved into unit - Moved in 1999 to March 2000 (%)
Year householder moved into unit - Moved in 1995 to 1998 (%)
Year householder moved into unit - Moved in 1990 to 1994 (%)
Year householder moved into unit - Moved in 1980 to 1989 (%)
Year householder moved into unit - Moved in 1970 to 1979 (%)
Year householder moved into unit - Moved in 1969 or earlier (%)
Means of transportation to work - Drove car alone (%)
Means of transportation to work - Carpooled (%)
Means of transportation to work - Public transportation (%)
Means of transportation to work - Bus or trolley bus (%)
Means of transportation to work - Streetcar or trolley car (%)
Means of transportation to work - Subway or elevated (%)
Means of transportation to work - Railroad (%)
Means of transportation to work - Ferryboat (%)
Means of transportation to work - Taxicab (%)
Means of transportation to work - Motorcycle (%)
Means of transportation to work - Bicycle (%)
Means of transportation to work - Walked (%)
Means of transportation to work - Other means (%)
Working at home (%)
Industry diversity
Most Common Industries - Agriculture, forestry, fishing and hunting, and mining (%)
Most Common Industries - Agriculture, forestry, fishing and hunting (%)
Most Common Industries - Mining, quarrying, and oil and gas extraction (%)
Most Common Industries - Construction (%)
Most Common Industries - Manufacturing (%)
Most Common Industries - Wholesale trade (%)
Most Common Industries - Retail trade (%)
Most Common Industries - Transportation and warehousing, and utilities (%)
Most Common Industries - Transportation and warehousing (%)
Most Common Industries - Utilities (%)
Most Common Industries - Information (%)
Most Common Industries - Finance and insurance, and real estate and rental and leasing (%)
Most Common Industries - Finance and insurance (%)
Most Common Industries - Real estate and rental and leasing (%)
Most Common Industries - Professional, scientific, and management, and administrative and waste management services (%)
Most Common Industries - Professional, scientific, and technical services (%)
Most Common Industries - Management of companies and enterprises (%)
Most Common Industries - Administrative and support and waste management services (%)
Most Common Industries - Educational services, and health care and social assistance (%)
Most Common Industries - Educational services (%)
Most Common Industries - Health care and social assistance (%)
Most Common Industries - Arts, entertainment, and recreation, and accommodation and food services (%)
Most Common Industries - Arts, entertainment, and recreation (%)
Most Common Industries - Accommodation and food services (%)
Most Common Industries - Other services, except public administration (%)
Most Common Industries - Public administration (%)
Occupation diversity
Most Common Occupations - Management, business, science, and arts occupations (%)
Most Common Occupations - Management, business, and financial occupations (%)
Most Common Occupations - Management occupations (%)
Most Common Occupations - Business and financial operations occupations (%)
Most Common Occupations - Computer, engineering, and science occupations (%)
Most Common Occupations - Computer and mathematical occupations (%)
Most Common Occupations - Architecture and engineering occupations (%)
Most Common Occupations - Life, physical, and social science occupations (%)
Most Common Occupations - Education, legal, community service, arts, and media occupations (%)
Most Common Occupations - Community and social service occupations (%)
Most Common Occupations - Legal occupations (%)
Most Common Occupations - Education, training, and library occupations (%)
Most Common Occupations - Arts, design, entertainment, sports, and media occupations (%)
Most Common Occupations - Healthcare practitioners and technical occupations (%)
Most Common Occupations - Health diagnosing and treating practitioners and other technical occupations (%)
Most Common Occupations - Health technologists and technicians (%)
Most Common Occupations - Service occupations (%)
Most Common Occupations - Healthcare support occupations (%)
Most Common Occupations - Protective service occupations (%)
Most Common Occupations - Fire fighting and prevention, and other protective service workers including supervisors (%)
Most Common Occupations - Law enforcement workers including supervisors (%)
Most Common Occupations - Food preparation and serving related occupations (%)
Most Common Occupations - Building and grounds cleaning and maintenance occupations (%)
Most Common Occupations - Personal care and service occupations (%)
Most Common Occupations - Sales and office occupations (%)
Most Common Occupations - Sales and related occupations (%)
Most Common Occupations - Office and administrative support occupations (%)
Most Common Occupations - Natural resources, construction, and maintenance occupations (%)
Most Common Occupations - Farming, fishing, and forestry occupations (%)
Most Common Occupations - Construction and extraction occupations (%)
Most Common Occupations - Installation, maintenance, and repair occupations (%)
Most Common Occupations - Production, transportation, and material moving occupations (%)
Most Common Occupations - Production occupations (%)
Most Common Occupations - Transportation occupations (%)
Most Common Occupations - Material moving occupations (%)
People in Group quarters - Institutionalized population (%)
People in Group quarters - Correctional institutions (%)
People in Group quarters - Federal prisons and detention centers (%)
People in Group quarters - Halfway houses (%)
People in Group quarters - Local jails and other confinement facilities (including police lockups) (%)
People in Group quarters - Military disciplinary barracks (%)
People in Group quarters - State prisons (%)
People in Group quarters - Other types of correctional institutions (%)
People in Group quarters - Nursing homes (%)
People in Group quarters - Hospitals/wards, hospices, and schools for the handicapped (%)
People in Group quarters - Hospitals/wards and hospices for chronically ill (%)
People in Group quarters - Hospices or homes for chronically ill (%)
People in Group quarters - Military hospitals or wards for chronically ill (%)
People in Group quarters - Other hospitals or wards for chronically ill (%)
People in Group quarters - Hospitals or wards for drug/alcohol abuse (%)
People in Group quarters - Mental (Psychiatric) hospitals or wards (%)
People in Group quarters - Schools, hospitals, or wards for the mentally retarded (%)
People in Group quarters - Schools, hospitals, or wards for the physically handicapped (%)
People in Group quarters - Institutions for the deaf (%)
People in Group quarters - Institutions for the blind (%)
People in Group quarters - Orthopedic wards and institutions for the physically handicapped (%)
People in Group quarters - Wards in general hospitals for patients who have no usual home elsewhere (%)
People in Group quarters - Wards in military hospitals for patients who have no usual home elsewhere (%)
People in Group quarters - Juvenile institutions (%)
People in Group quarters - Long-term care (%)
People in Group quarters - Homes for abused, dependent, and neglected children (%)
People in Group quarters - Residential treatment centers for emotionally disturbed children (%)
People in Group quarters - Training schools for juvenile delinquents (%)
People in Group quarters - Short-term care, detention or diagnostic centers for delinquent children (%)
People in Group quarters - Type of juvenile institution unknown (%)
People in Group quarters - Noninstitutionalized population (%)
People in Group quarters - College dormitories (includes college quarters off campus) (%)
People in Group quarters - Military quarters (%)
People in Group quarters - On base (%)
People in Group quarters - Barracks, unaccompanied personnel housing (UPH), (Enlisted/Officer), ;and similar group living quarters for military personnel (%)
People in Group quarters - Transient quarters for temporary residents (%)
People in Group quarters - Military ships (%)
People in Group quarters - Group homes (%)
People in Group quarters - Homes or halfway houses for drug/alcohol abuse (%)
People in Group quarters - Homes for the mentally ill (%)
People in Group quarters - Homes for the mentally retarded (%)
People in Group quarters - Homes for the physically handicapped (%)
People in Group quarters - Other group homes (%)
People in Group quarters - Religious group quarters (%)
People in Group quarters - Dormitories (%)
People in Group quarters - Agriculture workers' dormitories on farms (%)
People in Group quarters - Job Corps and vocational training facilities (%)
People in Group quarters - Other workers' dormitories (%)
People in Group quarters - Crews of maritime vessels (%)
People in Group quarters - Other nonhousehold living situations (%)
People in Group quarters - Other noninstitutional group quarters (%)
Residents speaking English at home (%)
Residents speaking English at home - Born in the United States (%)
Residents speaking English at home - Native, born elsewhere (%)
Residents speaking English at home - Foreign born (%)
Residents speaking Spanish at home (%)
Residents speaking Spanish at home - Born in the United States (%)
Residents speaking Spanish at home - Native, born elsewhere (%)
Residents speaking Spanish at home - Foreign born (%)
Residents speaking other language at home (%)
Residents speaking other language at home - Born in the United States (%)
Residents speaking other language at home - Native, born elsewhere (%)
Residents speaking other language at home - Foreign born (%)
Class of Workers - Employee of private company (%)
Class of Workers - Self-employed in own incorporated business (%)
Class of Workers - Private not-for-profit wage and salary workers (%)
Class of Workers - Local government workers (%)
Class of Workers - State government workers (%)
Class of Workers - Federal government workers (%)
Class of Workers - Self-employed workers in own not incorporated business and Unpaid family workers (%)
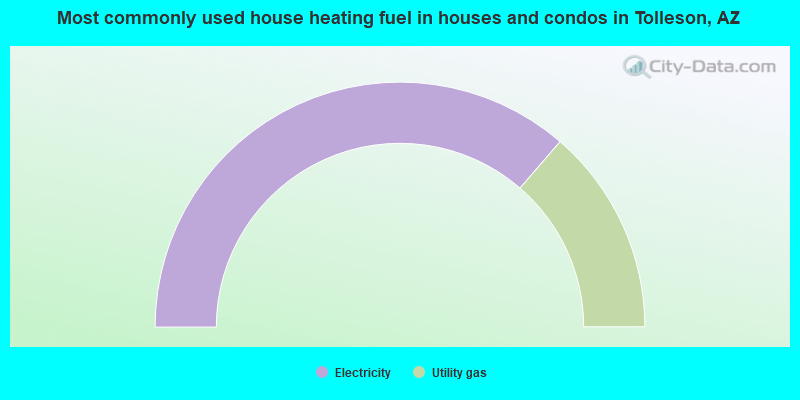
House heating fuel used in houses and condos - Utility gas (%)
House heating fuel used in houses and condos - Bottled, tank, or LP gas (%)
House heating fuel used in houses and condos - Electricity (%)
House heating fuel used in houses and condos - Fuel oil, kerosene, etc. (%)
House heating fuel used in houses and condos - Coal or coke (%)
House heating fuel used in houses and condos - Wood (%)
House heating fuel used in houses and condos - Solar energy (%)
House heating fuel used in houses and condos - Other fuel (%)
House heating fuel used in houses and condos - No fuel used (%)
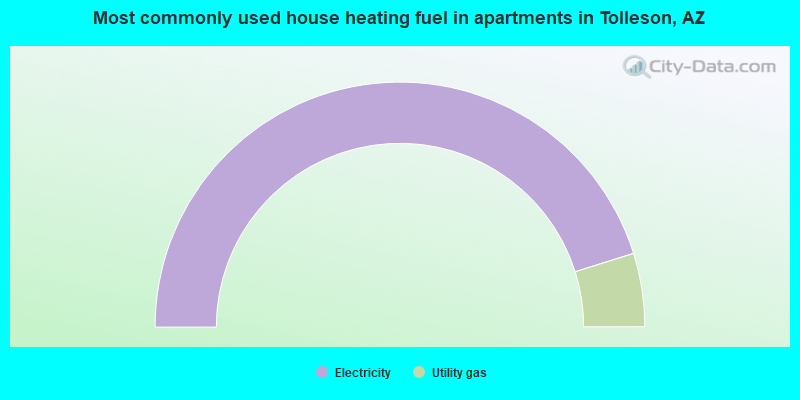
House heating fuel used in apartments - Utility gas (%)
House heating fuel used in apartments - Bottled, tank, or LP gas (%)
House heating fuel used in apartments - Electricity (%)
House heating fuel used in apartments - Fuel oil, kerosene, etc. (%)
House heating fuel used in apartments - Coal or coke (%)
House heating fuel used in apartments - Wood (%)
House heating fuel used in apartments - Solar energy (%)
House heating fuel used in apartments - Other fuel (%)
House heating fuel used in apartments - No fuel used (%)
Armed forces status - In Armed Forces (%)
Armed forces status - Civilian (%)
Armed forces status - Civilian - Veteran (%)
Armed forces status - Civilian - Nonveteran (%)
Fatal accidents locations in years 2005-2021
Fatal accidents locations in 2005
Fatal accidents locations in 2006
Fatal accidents locations in 2007
Fatal accidents locations in 2008
Fatal accidents locations in 2009
Fatal accidents locations in 2010
Fatal accidents locations in 2011
Fatal accidents locations in 2012
Fatal accidents locations in 2013
Fatal accidents locations in 2014
Fatal accidents locations in 2015
Fatal accidents locations in 2016
Fatal accidents locations in 2017
Fatal accidents locations in 2018
Fatal accidents locations in 2019
Fatal accidents locations in 2020
Fatal accidents locations in 2021
Alcohol use - People drinking some alcohol every month (%)
Alcohol use - People not drinking at all (%)
Alcohol use - Average days/month drinking alcohol
Alcohol use - Average drinks/week
Alcohol use - Average days/year people drink much
Audiometry - Average condition of hearing (%)
Audiometry - People that can hear a whisper from across a quiet room (%)
Audiometry - People that can hear normal voice from across a quiet room (%)
Audiometry - Ears ringing, roaring, buzzing (%)
Audiometry - Had a job exposure to loud noise (%)
Audiometry - Had off-work exposure to loud noise (%)
Blood Pressure & Cholesterol - Has high blood pressure (%)
Blood Pressure & Cholesterol - Checking blood pressure at home (%)
Blood Pressure & Cholesterol - Frequently checking blood cholesterol (%)
Blood Pressure & Cholesterol - Has high cholesterol level (%)
Consumer Behavior - Money monthly spent on food at supermarket/grocery store
Consumer Behavior - Money monthly spent on food at other stores
Consumer Behavior - Money monthly spent on eating out
Consumer Behavior - Money monthly spent on carryout/delivered foods
Consumer Behavior - Income spent on food at supermarket/grocery store (%)
Consumer Behavior - Income spent on food at other stores (%)
Consumer Behavior - Income spent on eating out (%)
Consumer Behavior - Income spent on carryout/delivered foods (%)
Current Health Status - General health condition (%)
Current Health Status - Blood donors (%)
Current Health Status - Has blood ever tested for HIV virus (%)
Current Health Status - Left-handed people (%)
Dermatology - People using sunscreen (%)
Diabetes - Diabetics (%)
Diabetes - Had a blood test for high blood sugar (%)
Diabetes - People taking insulin (%)
Diet Behavior & Nutrition - Diet health (%)
Diet Behavior & Nutrition - Milk product consumption (# of products/month)
Diet Behavior & Nutrition - Meals not home prepared (#/week)
Diet Behavior & Nutrition - Meals from fast food or pizza place (#/week)
Diet Behavior & Nutrition - Ready-to-eat foods (#/month)
Diet Behavior & Nutrition - Frozen meals/pizza (#/month)
Drug Use - People that ever used marijuana or hashish (%)
Drug Use - Ever used hard drugs (%)
Drug Use - Ever used any form of cocaine (%)
Drug Use - Ever used heroin (%)
Drug Use - Ever used methamphetamine (%)
Health Insurance - People covered by health insurance (%)
Kidney Conditions-Urology - Avg. # of times urinating at night
Medical Conditions - People with asthma (%)
Medical Conditions - People with anemia (%)
Medical Conditions - People with psoriasis (%)
Medical Conditions - People with overweight (%)
Medical Conditions - Elderly people having difficulties in thinking or remembering (%)
Medical Conditions - People who ever received blood transfusion (%)
Medical Conditions - People having trouble seeing even with glass/contacts (%)
Medical Conditions - People with arthritis (%)
Medical Conditions - People with gout (%)
Medical Conditions - People with congestive heart failure (%)
Medical Conditions - People with coronary heart disease (%)
Medical Conditions - People with angina pectoris (%)
Medical Conditions - People who ever had heart attack (%)
Medical Conditions - People who ever had stroke (%)
Medical Conditions - People with emphysema (%)
Medical Conditions - People with thyroid problem (%)
Medical Conditions - People with chronic bronchitis (%)
Medical Conditions - People with any liver condition (%)
Medical Conditions - People who ever had cancer or malignancy (%)
Mental Health - People who have little interest in doing things (%)
Mental Health - People feeling down, depressed, or hopeless (%)
Mental Health - People who have trouble sleeping or sleeping too much (%)
Mental Health - People feeling tired or having little energy (%)
Mental Health - People with poor appetite or overeating (%)
Mental Health - People feeling bad about themself (%)
Mental Health - People who have trouble concentrating on things (%)
Mental Health - People moving or speaking slowly or too fast (%)
Mental Health - People having thoughts they would be better off dead (%)
Oral Health - Average years since last visit a dentist
Oral Health - People embarrassed because of mouth (%)
Oral Health - People with gum disease (%)
Oral Health - General health of teeth and gums (%)
Oral Health - Average days a week using dental floss/device
Oral Health - Average days a week using mouthwash for dental problem
Oral Health - Average number of teeth
Pesticide Use - Households using pesticides to control insects (%)
Pesticide Use - Households using pesticides to kill weeds (%)
Physical Activity - People doing vigorous-intensity work activities (%)
Physical Activity - People doing moderate-intensity work activities (%)
Physical Activity - People walking or bicycling (%)
Physical Activity - People doing vigorous-intensity recreational activities (%)
Physical Activity - People doing moderate-intensity recreational activities (%)
Physical Activity - Average hours a day doing sedentary activities
Physical Activity - Average hours a day watching TV or videos
Physical Activity - Average hours a day using computer
Physical Functioning - People having limitations keeping them from working (%)
Physical Functioning - People limited in amount of work they can do (%)
Physical Functioning - People that need special equipment to walk (%)
Physical Functioning - People experiencing confusion/memory problems (%)
Physical Functioning - People requiring special healthcare equipment (%)
Prescription Medications - Average number of prescription medicines taking
Preventive Aspirin Use - Adults 40+ taking low-dose aspirin (%)
Reproductive Health - Vaginal deliveries (%)
Reproductive Health - Cesarean deliveries (%)
Reproductive Health - Deliveries resulted in a live birth (%)
Reproductive Health - Pregnancies resulted in a delivery (%)
Reproductive Health - Women breastfeeding newborns (%)
Reproductive Health - Women that had a hysterectomy (%)
Reproductive Health - Women that had both ovaries removed (%)
Reproductive Health - Women that have ever taken birth control pills (%)
Reproductive Health - Women taking birth control pills (%)
Reproductive Health - Women that have ever used Depo-Provera or injectables (%)
Reproductive Health - Women that have ever used female hormones (%)
Sexual Behavior - People 18+ that ever had sex (vaginal, anal, or oral) (%)
Sexual Behavior - Males 18+ that ever had vaginal sex with a woman (%)
Sexual Behavior - Males 18+ that ever performed oral sex on a woman (%)
Sexual Behavior - Males 18+ that ever had anal sex with a woman (%)
Sexual Behavior - Males 18+ that ever had any sex with a man (%)
Sexual Behavior - Females 18+ that ever had vaginal sex with a man (%)
Sexual Behavior - Females 18+ that ever performed oral sex on a man (%)
Sexual Behavior - Females 18+ that ever had anal sex with a man (%)
Sexual Behavior - Females 18+ that ever had any kind of sex with a woman (%)
Sexual Behavior - Average age people first had sex
Sexual Behavior - Average number of female sex partners in lifetime (males 18+)
Sexual Behavior - Average number of female vaginal sex partners in lifetime (males 18+)
Sexual Behavior - Average age people first performed oral sex on a woman (18+)
Sexual Behavior - Average number of woman performed oral sex on in lifetime (18+)
Sexual Behavior - Average number of male sex partners in lifetime (males 18+)
Sexual Behavior - Average number of male anal sex partners in lifetime (males 18+)
Sexual Behavior - Average age people first performed oral sex on a man (18+)
Sexual Behavior - Average number of male oral sex partners in lifetime (18+)
Sexual Behavior - People using protection when performing oral sex (%)
Sexual Behavior - Average number of times people have vaginal or anal sex a year
Sexual Behavior - People having sex without condom (%)
Sexual Behavior - Average number of male sex partners in lifetime (females 18+)
Sexual Behavior - Average number of male vaginal sex partners in lifetime (females 18+)
Sexual Behavior - Average number of female sex partners in lifetime (females 18+)
Sexual Behavior - Circumcised males 18+ (%)
Sleep Disorders - Average hours sleeping at night
Sleep Disorders - People that has trouble sleeping (%)
Smoking-Cigarette Use - People smoking cigarettes (%)
Taste & Smell - People 40+ having problems with smell (%)
Taste & Smell - People 40+ having problems with taste (%)
Taste & Smell - People 40+ that ever had wisdom teeth removed (%)
Taste & Smell - People 40+ that ever had tonsils teeth removed (%)
Taste & Smell - People 40+ that ever had a loss of consciousness because of a head injury (%)
Taste & Smell - People 40+ that ever had a broken nose or other serious injury to face or skull (%)
Taste & Smell - People 40+ that ever had two or more sinus infections (%)
Weight - Average height (inches)
Weight - Average weight (pounds)
Weight - Average BMI
Weight - People that are obese (%)
Weight - People that ever were obese (%)
Weight - People trying to lose weight (%)
6,098 82.2% Hispanic 633 8.5% White alone 495 6.7% Black alone 248 3.3% Two or more races 38 0.5% American Indian alone
Officers per 1,000 residents here:
4.02Arizona average:
1.73
Latest news from Tolleson, AZ collected exclusively by city-data.com from local newspapers, TV, and radio stations
Tolleson, AZ City Guides: Ancestries: Italian (7.5%), Nigerian (2.8%).
Current Local Time:
Land area: 5.56 square miles.
Population density: 1,305 people per square mile (low).
1,778 residents are foreign born (23.5% Latin America ).
This city:
24.0%Arizona:
13.0%
Median real estate property taxes paid for housing units with mortgages in 2022: $1,514 (0.4%)Median real estate property taxes paid for housing units with no mortgage in 2022: $906 (0.3%)
Nearest city with pop. 50,000+: Glendale, AZ
Nearest city with pop. 1,000,000+: Phoenix, AZ
Nearest cities:
Latitude: 33.45 N, Longitude: 112.26 W
Daytime population change due to commuting: +13,039 (+175.8%)Workers who live and work in this city: 714 (24.3%)
Property values in Tolleson, AZ
Single-family new house construction building permits:
2022: 10 buildings , average cost: $254,3002021: 9 buildings , average cost: $222,7002020: 6 buildings , average cost: $251,9002019: 69 buildings , average cost: $322,6002018: 15 buildings , average cost: $345,0002017: 5 buildings , average cost: $182,4002016: 7 buildings , average cost: $195,8002015: 2 buildings , average cost: $347,8002014: 2 buildings , average cost: $272,8002013: 32 buildings , average cost: $227,4002011: 1 building , cost: $266,8002009: 11 buildings , average cost: $212,5002008: 33 buildings , average cost: $213,3002007: 59 buildings , average cost: $204,8002006: 66 buildings , average cost: $174,6002005: 9 buildings , average cost: $141,4002004: 7 buildings , average cost: $144,4002002: 1 building , cost: $40,0002001: 6 buildings , average cost: $52,0002000: 29 buildings , average cost: $48,6001999: 5 buildings , average cost: $40,0001998: 17 buildings , average cost: $49,9001997: 77 buildings , average cost: $50,100Unemployment in December 2023:
Population change in the 1990s: +475 (+10.6%).
Most common occupations in Tolleson, AZ (%)
Both Males Females
Laborers and material movers, hand (6.8%)
Other production occupations, including supervisors (5.7%)
Other office and administrative support workers, including supervisors (5.6%)
Driver/sales workers and truck drivers (5.0%)
Building and grounds cleaning and maintenance occupations (4.9%)
Material recording, scheduling, dispatching, and distributing workers (4.4%)
Cashiers (4.3%)
Driver/sales workers and truck drivers (8.6%)
Laborers and material movers, hand (8.3%)
Other material moving workers, except laborers (6.6%)
Other production occupations, including supervisors (6.5%)
Agricultural workers, including supervisors (5.9%)
Building and grounds cleaning and maintenance occupations (5.8%)
Material recording, scheduling, dispatching, and distributing workers (5.4%)
Other office and administrative support workers, including supervisors (12.7%)
Secretaries and administrative assistants (8.2%)
Cashiers (6.8%)
Laborers and material movers, hand (4.6%)
Other production occupations, including supervisors (4.6%)
Other teachers, instructors, education, training, and library occupations (4.4%)
Building and grounds cleaning and maintenance occupations (3.6%)
Earthquake activity:
Tolleson-area historical earthquake activity is significantly above Arizona state average. It is 2601% greater than the overall U.S. average. On 6/28/1992 at 11:57:34, a magnitude 7.6 (6.2 MB, 7.6 MS, 7.3 MW, Depth: 0.7 mi, Class: Major, Intensity: VIII - XII) earthquake occurred 250.9 miles away from the city center, causing 3 deaths ( 1 shaking deaths, 2 other deaths) and 400 injuries, causing $100,000,000 total damage and $40,000,000 insured lossesOn 5/19/1940 at 04:36:40, a magnitude 7.2 (7.2 UK) earthquake occurred 199.5 miles away from Tolleson center, causing $33,000,000 total damage On 10/16/1999 at 09:46:44, a magnitude 7.4 (6.3 MB, 7.4 MS, 7.2 MW, 7.3 ML) earthquake occurred 250.8 miles away from Tolleson center On 12/31/1934 at 18:45:56, a magnitude 7.1 (7.1 UK) earthquake occurred 209.9 miles away from Tolleson center On 10/15/1979 at 23:16:54, a magnitude 7.0 (5.7 MB, 6.9 MS, 7.0 ML, 6.4 MW) earthquake occurred 200.8 miles away from the city center On 7/21/1952 at 11:52:14, a magnitude 7.7 (7.7 UK) earthquake occurred 400.2 miles away from Tolleson center, causing $50,000,000 total damage Magnitude types: body-wave magnitude (MB), local magnitude (ML), surface-wave magnitude (MS), moment magnitude (MW) Natural disasters: The number of natural disasters in Maricopa County (16) is near the US average (15).Major Disasters (Presidential) Declared: 11Emergencies Declared: 1Floods: 10, Storms: 9, Fires: 3, Flash Flood: 1, Heavy Rain: 1, Hurricane: 1, Tornado: 1, Wind: 1, Other: 1 (Note: some incidents may be assigned to more than one category). Hospitals and medical centers near Tolleson: BANNER ESTRELLA MEDICAL CENTER (about 3 miles away; PHOENIX, AZ)
AVONDALE DIALYSIS (FMC) (Dialysis Facility, about 3 miles away; AVONDALE, AZ)
ESTRELLA DIALYSIS CENTER (FMC) (Dialysis Facility, about 5 miles away; PHOENIX, AZ)
AVONDALE DIALYSIS (DSI) (Dialysis Facility, about 5 miles away; AVONDALE, AZ)
SOUTHWEST KIDNEY DIALYSIS - MARYVALE (DVA) (Dialysis Facility, about 6 miles away; PHOENIX, AZ)
PALM VALLEY REHAB AND CARE CTR (Nursing Home, about 6 miles away; GOODYEAR, AZ)
PALM VALLEY DIALYSIS (FMC) (Dialysis Facility, about 6 miles away; GOODYEAR, AZ)
Heliports located in Tolleson: Amtrak stations near Tolleson: 11 miles: PHOENIX (401 W. HARRISON ST.) - Bus Station Services: ticket office, enclosed waiting area, public restrooms, public payphones, vending machines, free short-term parking, paid long-term parking, taxi stand.
12 miles: PHOENIX NORTHWEST (PHOENIX, 8101 BLACK CANYON FWY.) - Bus Station Services: public payphones, call for taxi service.
15 miles: PHOENIX AIRPORT (PHOENIX, TERMINAL 2) - Bus Station Services: enclosed waiting area, public restrooms, public payphones, full-service food facilities, paid short-term parking, paid long-term parking, car rental agency, taxi stand, intercity bus service, public transit connection.
Colleges/universities with over 2000 students nearest to Tolleson:
Universal Technical Institute of Arizona Inc (about 2 miles; Avondale, AZ ; Full-time enrollment: 3,860)
Estrella Mountain Community College (about 6 miles; Avondale, AZ ; FT enrollment: 4,932)
Grand Canyon University (about 9 miles; Phoenix, AZ ; FT enrollment: 44,186)
Glendale Community College (about 10 miles; Glendale, AZ ; FT enrollment: 12,533)
Phoenix College (about 10 miles; Phoenix, AZ ; FT enrollment: 7,001)
Arizona State University-Downtown Phoenix (about 11 miles; Phoenix, AZ ; FT enrollment: 9,515)
Argosy University-Phoenix Online Division (about 12 miles; Phoenix, AZ ; FT enrollment: 8,840)
Public schools in Tolleson: TOLLESON UNION HIGH SCHOOL Students: 2,197, Location: 9419 WEST VAN BUREN)PORFIRIO H. GONZALES ELEMENTARY SCHOOL Students: 958, Location: 9401 W. GARFIELD ST.)DOS RIOS ELEMENTARY Students: 873, Location: 2150 S. 87TH AVENUE)ARTS ACADEMY AT ESTRELLA MOUNTAIN Students: 813, Location: 2504 SOUTH 91ST AVE., Charter school )UNIVERSITY HIGH SCHOOL Students: 796, Location: 9419 WEST VAN BUREN STREET)TRES RIOS ELEMENTARY SCHOOL Students: 778, Location: 5025 S. 103RD AVENUE)HURLEY RANCH ELEMENTARY Students: 774, Location: 8950 W. ILLINI ST.)SIERRA LINDA HIGH SCHOOL Students: 623, Location: 9801 W. VAN BUREN STREET)ARIZONA DESERT ELEMENTARY SCHOOL Students: 435, Location: 8803 W. VAN BUREN STREET)WEST-MEC - TOLLESON UNION HIGH SCHOOL Location: 9419 W. VAN BUREN AVENUE)
COUNTRY PLACE ELEMENTARY Location: 10207 W. COUNTRY PLACE BLVD.)
TOLLESON #206 Location: 9801 WEST VAN BUREN STREET)
UNION ELEMENTARY SCHOOL Location: 3834 S. 91ST AVE.)
See full list of schools located in Tolleson Library in Tolleson: TOLLESON PUBLIC LIBRARY Operating income: $333,861; Location: 9555 W. VAN BUREN; 19,676 books ; 144 audio materials ; 1,702 video materials ; 28 other licensed databases ; 39 print serial subscriptions )
Notable locations in Tolleson: (A) , Tolleson Town Hall (B) , Tolleson Fire Department (C) , Tolleson Police Department (D) . Display/hide their locations on the map
Churches in Tolleson include: (A) , Tolleson Christian Church (B) , Iglesia Fuente de Viva (C) . Display/hide their locations on the map
Parks in Tolleson include: (1) , Tolleson Town Park Number One (2) , Cowden City Park (3) . Display/hide their locations on the map
Hotels:
Court:
Birthplace of: Merle Keagle - Girls Professional Baseball League player.
Maricopa County has a predicted average indoor radon screening level between 2 and 4 pCi/L (pico curies per liter) - Moderate Potential Average household size: This city:
3.3 peopleArizona:
2.6 people
Percentage of family households: This city:
79.5%Whole state:
66.2%
Percentage of households with unmarried partners: This city:
9.3%Whole state:
7.8%
Likely homosexual households (counted as self-reported same-sex unmarried-partner households)
Lesbian couples: 0.4% of all households Gay men: 0.2% of all households
Banks with branches in Tolleson (2011 data):
JPMorgan Chase Bank, National Association: Tolleson at 2715 99th Avenue, branch established on 2006/12/01. Info updated 2011/11/10: Bank assets: $1,811,678.0 mil, Deposits: $1,190,738.0 mil, headquarters in Columbus, OH, positive income , International Specialization, 5577 total offices , Holding Company: Jpmorgan Chase & Co.
Bank of the West: Tolleson Branch at 9502 West Van Buren Street, branch established on 1946/11/01. Info updated 2009/11/16: Bank assets: $62,408.3 mil, Deposits: $43,995.2 mil, headquarters in San Francisco, CA, positive income , 647 total offices , Holding Company: Bnp Paribas
For population 15 years and over in Tolleson:
Never married: 41.1%Now married: 47.4%Separated: 2.9%Widowed: 2.1%Divorced: 6.5% For population 25 years and over in Tolleson:
High school or higher: 68.0%Bachelor's degree or higher: 6.4%Graduate or professional degree: 1.3%Unemployed: 4.3%Mean travel time to work (commute): 17.8 minutes
Education Gini index (Inequality in education) Here:
20.1Arizona average:
12.2
Religion statistics for Tolleson, AZ (based on Maricopa County data)
Religion Adherents Congregations Evangelical Protestant 534,453 1,206 Catholic 520,651 100 Other 312,574 680 Mainline Protestant 104,145 241 Orthodox 13,379 24 Black Protestant 6,278 48 None 2,325,637 -
Source: Clifford Grammich, Kirk Hadaway, Richard Houseal, Dale E.Jones, Alexei Krindatch, Richie Stanley and Richard H.Taylor. 2012. 2010 U.S.Religion Census: Religious Congregations & Membership Study. Association of Statisticians of American Religious Bodies. Jones, Dale E., et al. 2002. Congregations and Membership in the United States 2000. Nashville, TN: Glenmary Research Center. Graphs represent county-level data
Food Environment Statistics: Number of grocery stores : 501Maricopa County :
1.30 / 10,000 pop.Arizona :
1.36 / 10,000 pop.
Number of supercenters and club stores : 60Maricopa County :
0.16 / 10,000 pop.State :
0.14 / 10,000 pop.
Number of convenience stores (no gas) : 219Maricopa County :
0.57 / 10,000 pop.Arizona :
0.55 / 10,000 pop.
Number of convenience stores (with gas) : 768This county :
1.99 / 10,000 pop.State :
2.47 / 10,000 pop.
Number of full-service restaurants : 2,264Maricopa County :
5.86 / 10,000 pop.State :
6.21 / 10,000 pop.
Adult diabetes rate : This county :
7.7%Arizona :
8.0%
Adult obesity rate : Maricopa County :
22.5%Arizona :
22.8%
Low-income preschool obesity rate : This county :
14.8%Arizona :
14.2%
Health and Nutrition: Healthy diet rate : Tolleson:
46.5%Arizona:
49.0%
Average overall health of teeth and gums : This city:
46.4%State:
47.3%
People feeling badly about themselves : Tolleson:
23.1%Arizona:
20.8%
People not drinking alcohol at all : Tolleson:
9.1%Arizona:
10.2%
Average hours sleeping at night : Overweight people : Tolleson:
32.6%State:
33.5%
General health condition : Tolleson:
54.3%State:
56.1%
Average condition of hearing : This city:
80.8%State:
79.4%
More about Health and Nutrition of Tolleson, AZ Residents
Local government employment and payroll (March 2022)
Function
Full-time employees
Monthly full-time payroll
Average yearly full-time wage
Part-time employees
Monthly part-time payroll
Police Protection - Officers
33 $268,355 $97,584 0 $0 Firefighters
28 $289,482 $124,064 0 $0 Streets and Highways
25 $149,824 $71,916 0 $0 Police - Other
19 $104,082 $65,736 0 $0 Sewerage
17 $129,052 $91,096 0 $0 Other Government Administration
16 $120,190 $90,143 0 $0 Water Supply
12 $87,660 $87,660 0 $0 Judicial and Legal
8 $66,430 $99,645 0 $0 Welfare
7 $41,078 $70,419 2 $4,697 Financial Administration
6 $53,710 $107,420 0 $0 Fire - Other
4 $42,795 $128,385 0 $0 Housing and Community Development (Local)
4 $37,698 $113,094 0 $0 Local Libraries
4 $25,147 $75,441 1 $1,906 Parks and Recreation
4 $25,032 $75,096 0 $0
Totals for Government
187 $1,440,535 $92,441 3 $6,603
Tolleson government finances - Expenditure in 2021 (per resident):
Construction - General Public Buildings: $1,493,000 ($205.70)
Current Operations - Police Protection: $7,559,000 ($1041.47)
General - Other: $7,221,000 ($994.90)Sewerage: $6,649,000 ($916.09)Water Utilities: $6,072,000 ($836.59)Local Fire Protection: $5,578,000 ($768.53)Central Staff Services: $3,005,000 ($414.03)Parks and Recreation: $1,783,000 ($245.66)Regular Highways: $1,427,000 ($196.61)Health - Other: $1,201,000 ($165.47)Judicial and Legal Services: $836,000 ($115.18)Libraries: $787,000 ($108.43)Financial Administration: $762,000 ($104.99)Housing and Community Development: $499,000 ($68.75)Solid Waste Management: $391,000 ($53.87)Protective Inspection and Regulation - Other: $337,000 ($46.43)Transit Utilities: $65,000 ($8.96)General - Interest on Debt: $1,626,000 ($224.03)
Other Capital Outlay - Police Protection: $775,000 ($106.78)
General Public Building: $500,000 ($68.89)Local Fire Protection: $142,000 ($19.56)Central Staff Services: $132,000 ($18.19)Regular Highways: $118,000 ($16.26)Total Salaries and Wages: $15,493,000 ($2134.61)
Tolleson government finances - Revenue in 2021 (per resident):
Charges - Sewerage: $7,049,000 ($971.20)
Other: $2,946,000 ($405.90)Solid Waste Management: $448,000 ($61.72)Parks and Recreation: $5,000 ($0.69)Federal Intergovernmental - Other: $54,000 ($7.44)
Local Intergovernmental - Other: $594,000 ($81.84)
Miscellaneous - Donations From Private Sources: $1,271,000 ($175.12)
Fines and Forfeits: $183,000 ($25.21)Rents: $126,000 ($17.36)Interest Earnings: $122,000 ($16.81)Sale of Property: $21,000 ($2.89)Revenue - Water Utilities: $8,144,000 ($1122.07)
State Intergovernmental - General Local Government Support: $2,278,000 ($313.86)
Highways: $510,000 ($70.27)Other: $207,000 ($28.52)Tax - General Sales and Gross Receipts: $34,054,000 ($4691.93)
Property: $9,092,000 ($1252.69)Other License: $1,225,000 ($168.78)Occupation and Business License - Other: $70,000 ($9.64)Public Utilities Sales: $55,000 ($7.58)
Tolleson government finances - Debt in 2021 (per resident):
Long Term Debt - Beginning Outstanding - Unspecified Public Purpose: $33,093,000 ($4559.52)
Outstanding Unspecified Public Purpose: $28,969,000 ($3991.32)Retired Unspecified Public Purpose: $4,124,000 ($568.20)
Tolleson government finances - Cash and Securities in 2021 (per resident):
Bond Funds - Cash and Securities: $14,595,000 ($2010.88)
Other Funds - Cash and Securities: $87,392,000 ($12040.78)
5.80% of this county's 2021 resident taxpayers lived in other counties in 2020 ($92,013 average adjusted gross income )
Here:
5.80%Arizona average:
6.85%
0.02% of residents moved from foreign countries ($227 average AGI )Maricopa County:
0.02%Arizona average:
0.03%
Top counties from which taxpayers relocated into this county between 2020 and 2021:
5.04% of this county's 2020 resident taxpayers moved to other counties in 2021 ($76,911 average adjusted gross income )
Here:
5.04%Arizona average:
5.72%
0.02% of residents moved to foreign countries ($234 average AGI )Maricopa County:
0.02%Arizona average:
0.03%
Top counties to which taxpayers relocated from this county between 2020 and 2021:
Businesses in Tolleson, AZ
Name Count Name Count
Arby's 1 Kmart 1 AutoZone 1 Kohl's 1 CarMax 1 Payless 1 Circle K 4 Pizza Hut 1 Comfort Suites 1 SONIC Drive-In 1 Cricket Wireless 2 Sears 1 Famous Footwear 1 Sprint Nextel 1 Fashion Bug 1 Starbucks 1 FedEx 1 Taco Bell 1 Firestone Complete Auto Care 1 Target 1 GameStop 1 U-Haul 1 Jack In The Box 2 Waffle House 1
Strongest AM radio stations in Tolleson:
KMYL (1190 AM; 5 kW; TOLLESON, AZ; Owner: INTERSTATE B/C SYSTEM OF AZ, INC.)
KXEM (1010 AM; 15 kW; TOLLESON, AZ; Owner: JAMES CRYSTAL ENTERPRISES OF PHOENIX, INC.)
KPXQ (1360 AM; 50 kW; GLENDALE, AZ; Owner: COMMON GROUND BROADCASTING, INC.)
KGME (910 AM; 5 kW; PHOENIX, AZ; Owner: AMFM RADIO LICENSES, L.L.C.)
KASA (1540 AM; 10 kW; PHOENIX, AZ; Owner: KASA RADIO HOGAR, INC.)
KFNX (1100 AM; 50 kW; CAVE CREEK, AZ; Owner: NORTH AMERICAN BROADCASTING CO., INC.)
KMIK (1580 AM; 50 kW; TEMPE, AZ; Owner: ABC, INC.)
KPHX (1480 AM; 5 kW; PHOENIX, AZ; Owner: CONTINENTAL BROADCASTING CORP. OF ARIZONA, INC.)
KXEG (1280 AM; 2 kW; PHOENIX, AZ; Owner: MORTENSON BROADCASTING COMPANY OF ARIZONA, LLC)
KFYI (550 AM; 5 kW; PHOENIX, AZ; Owner: AMFM RADIO LICENSES, L.L.C.)
KTAR (620 AM; 5 kW; PHOENIX, AZ; Owner: EMMIS RADIO LICENSE CORPORATION)
KMIA (710 AM; 50 kW; BLACK CANYON CITY, AZ; Owner: ENTRAVISION HOLDINGS, LLC)
KFNN (1510 AM; 22 kW; MESA, AZ; Owner: CRC BROADCASTING COMPANY, INC.)
Strongest FM radio stations in Tolleson:
KSLX-FM (100.7 FM; SCOTTSDALE, AZ; Owner: CACTUS RADIO, INC.)
KKLT (98.7 FM; PHOENIX, AZ; Owner: EMMIS RADIO LICENSE CORPORATION)
K220GO (91.9 FM; TEMPE, AZ; Owner: CALVARY CHAPEL OF TWIN FALLS, INC.)
KZON (101.5 FM; PHOENIX, AZ; Owner: INFINITY RADIO OPERATIONS INC.)
KKFR (92.3 FM; GLENDALE, AZ; Owner: EMMIS RADIO LICENSE CORPORATION)
KMLE (107.9 FM; CHANDLER, AZ; Owner: INFINITY RADIO OPERATIONS INC.)
KESZ (99.9 FM; PHOENIX, AZ; Owner: CLEAR CHANNEL BROADCASTING LICENSES, INC.)
KOOL-FM (94.5 FM; PHOENIX, AZ; Owner: INFINITY RADIO OPERATIONS INC.)
KNIX-FM (102.5 FM; PHOENIX, AZ; Owner: CLEAR CHANNEL BROADCASTING LICENSES, INC.)
KUPD (97.9 FM; TEMPE, AZ; Owner: TEMPE RADIO, INC.)
KJZZ (91.5 FM; PHOENIX, AZ; Owner: MARICOPA COUNTY COMM. COLLEGE DIST.)
KFLR-FM (90.3 FM; PHOENIX, AZ; Owner: FAMILY LIFE BROADCASTING, INC.)
KYOT-FM (95.5 FM; PHOENIX, AZ; Owner: AMFM RADIO LICENSES, L.L.C.)
KMXP (96.9 FM; PHOENIX, AZ; Owner: CITICASTERS LICENSES, L.P.)
K240CV (95.9 FM; PHOENIX, AZ; Owner: ZORBA RESOURCES, INC.)
KZZP (104.7 FM; MESA, AZ; Owner: CITICASTERS LICENSES, L.P.)
KDKB (93.3 FM; MESA, AZ; Owner: MESA RADIO, INC.)
K207CO (89.3 FM; SUN LAKES, AZ; Owner: MARICOPA CNTY COMMUNITY COLLEGE DIST)
K216FO (91.1 FM; GUADALUPE, AZ; Owner: WORLD RADIO NETWORK, INC.)
KLNZ (103.5 FM; GLENDALE, AZ; Owner: ENTRAVISION HOLDINGS, LLC)
TV broadcast stations around Tolleson:
KAET (Channel 8; PHOENIX, AZ; Owner: ARIZONA BOARD OF REGENTS)
K43GV (Channel 43; PHOENIX, AZ; Owner: TELEVISION APOGEO DE PHOENIX, LLC)
KPHO-TV (Channel 5; PHOENIX, AZ; Owner: MEREDITH CORPORATION)
KTVK (Channel 3; PHOENIX, AZ; Owner: KTVK, INC.)
KPPX (Channel 51; TOLLESON, AZ; Owner: AMERICA 51, L.P.)
KPNX (Channel 12; MESA, AZ; Owner: MULTIMEDIA HOLDINGS CORPORATION)
KUTP (Channel 45; PHOENIX, AZ; Owner: FOX TELEVISION STATIONS, INC.)
KSAZ-TV (Channel 10; PHOENIX, AZ; Owner: KSAZ LICENSE, INC.)
KASW (Channel 61; PHOENIX, AZ; Owner: KASW-TV, INC.)
K55EH (Channel 55; PHOENIX, AZ; Owner: KAZT, L.L.C.)
KNXV-TV (Channel 15; PHOENIX, AZ; Owner: SCRIPPS HOWARD BROADCASTING COMPANY)
KTVW-TV (Channel 33; PHOENIX, AZ; Owner: KTVW LICENSE PARTNERSHIP, G.P.)
K53GF (Channel 53; PHOENIX, AZ; Owner: SPANISH INDEPENDENT BROADCAST NETWORK, LLC)
KDRX-CA (Channel 48; PHOENIX, AZ; Owner: NBC TELEMUNDO PHOENIX, INC.)
KFPH-CA (Channel 39; PHOENIX, AZ; Owner: TELEFUTURA PARTNERSHIP OF PHOENIX)
KTVP-LP (Channel 64; PHOENIX, AZ; Owner: MAKO COMMUNICATIONS, LLC)
KAZT-CA (Channel 27; PHOENIX, AZ; Owner: KAZT, L.L.C.)
KDTP (Channel 39; PHOENIX, AZ; Owner: COMMUNITY TELEVISION EDUCATORS, INC.)
KPAZ-TV (Channel 21; PHOENIX, AZ; Owner: TRINITY BROADCASTING OF ARIZONA, INC.)
K25DM (Channel 25; PHOENIX, AZ; Owner: KDMA CHANNEL 25, INC.)
KPHZ-LP (Channel 58; PHOENIX, AZ; Owner: NBC TELEMUNDO PHOENIX, INC.)
National Bridge Inventory (NBI) Statistics 31 Number of bridges620ft / 189m Total length $5,000 Total costs1,458,505 Total average daily traffic113,423 Total average daily truck traffic
New bridges - historical statistics
1 1930-1939 3 1950-1959 4 1960-1969 2 1970-1979 7 1980-1989 9 1990-1999 3 2000-2009 2 2010-2019
See full National Bridge Inventory statistics for Tolleson, AZ
Home Mortgage Disclosure Act Aggregated Statistics For Year 2009(Based on 1 full tract) A) FHA, FSA/RHS & VA B) Conventional C) Refinancings D) Home Improvement Loans E) Loans on Dwellings For 5+ Families F) Non-occupant Loans on Number Average Value Number Average Value Number Average Value Number Average Value Number Average Value Number Average Value
LOANS ORIGINATED 47 $123,641 7 $100,060 25 $121,288 1 $49,470 0 $0 3 $90,027 APPLICATIONS APPROVED, NOT ACCEPTED 1 $80,130 0 $0 8 $184,999 0 $0 0 $0 1 $48,480 APPLICATIONS DENIED 13 $107,225 2 $105,855 32 $167,655 8 $24,732 1 $3,640,620 1 $110,800 APPLICATIONS WITHDRAWN 15 $131,445 2 $105,855 6 $131,412 2 $14,840 0 $0 1 $63,320 FILES CLOSED FOR INCOMPLETENESS 5 $92,994 0 $0 2 $98,435 0 $0 0 $0 1 $173,130
Aggregated Statistics For Year 2008(Based on 2 full tracts) A) FHA, FSA/RHS & VA B) Conventional C) Refinancings D) Home Improvement Loans F) Non-occupant Loans on Number Average Value Number Average Value Number Average Value Number Average Value Number Average Value
LOANS ORIGINATED 38 $157,815 14 $130,729 45 $145,603 4 $70,488 7 $115,749 APPLICATIONS APPROVED, NOT ACCEPTED 1 $112,780 4 $167,440 14 $167,051 1 $98,930 1 $142,460 APPLICATIONS DENIED 16 $158,412 10 $155,320 78 $163,158 9 $148,944 6 $120,035 APPLICATIONS WITHDRAWN 9 $162,026 4 $159,772 19 $167,713 4 $133,060 5 $117,528 FILES CLOSED FOR INCOMPLETENESS 1 $136,520 1 $150,370 2 $280,465 2 $96,455 0 $0
Aggregated Statistics For Year 2007(Based on 2 full tracts) A) FHA, FSA/RHS & VA B) Conventional C) Refinancings D) Home Improvement Loans F) Non-occupant Loans on G) Loans On Manufactured Number Average Value Number Average Value Number Average Value Number Average Value Number Average Value Number Average Value
LOANS ORIGINATED 17 $186,919 105 $158,439 100 $150,607 21 $74,103 19 $128,764 0 $0 APPLICATIONS APPROVED, NOT ACCEPTED 1 $258,210 19 $171,761 26 $181,346 2 $123,665 3 $157,877 0 $0 APPLICATIONS DENIED 7 $210,156 58 $154,159 89 $185,869 28 $113,275 16 $166,158 2 $8,905 APPLICATIONS WITHDRAWN 4 $188,215 53 $140,478 41 $150,904 2 $30,175 6 $174,942 0 $0 FILES CLOSED FOR INCOMPLETENESS 0 $0 4 $134,792 17 $181,624 1 $61,340 1 $174,120 0 $0
Aggregated Statistics For Year 2006(Based on 2 full tracts) A) FHA, FSA/RHS & VA B) Conventional C) Refinancings D) Home Improvement Loans E) Loans on Dwellings For 5+ Families F) Non-occupant Loans on G) Loans On Manufactured Number Average Value Number Average Value Number Average Value Number Average Value Number Average Value Number Average Value Number Average Value
LOANS ORIGINATED 2 $231,495 183 $142,620 218 $170,877 29 $78,325 1 $4,847,570 60 $153,605 0 $0 APPLICATIONS APPROVED, NOT ACCEPTED 0 $0 23 $126,028 38 $165,057 4 $45,012 0 $0 5 $128,016 0 $0 APPLICATIONS DENIED 3 $148,723 96 $148,928 124 $158,063 34 $70,834 0 $0 20 $148,593 2 $52,930 APPLICATIONS WITHDRAWN 0 $0 51 $158,598 70 $162,521 3 $55,730 0 $0 10 $152,154 0 $0 FILES CLOSED FOR INCOMPLETENESS 0 $0 12 $121,024 26 $163,577 1 $82,620 0 $0 0 $0 0 $0
Aggregated Statistics For Year 2005(Based on 1 full tract) A) FHA, FSA/RHS & VA B) Conventional C) Refinancings D) Home Improvement Loans F) Non-occupant Loans on G) Loans On Manufactured Number Average Value Number Average Value Number Average Value Number Average Value Number Average Value Number Average Value
LOANS ORIGINATED 4 $162,740 243 $128,707 215 $129,842 15 $72,615 49 $136,746 1 $143,450 APPLICATIONS APPROVED, NOT ACCEPTED 0 $0 26 $126,859 34 $108,154 4 $126,135 2 $141,965 0 $0 APPLICATIONS DENIED 1 $201,820 58 $96,354 116 $118,989 26 $71,115 8 $123,786 2 $31,165 APPLICATIONS WITHDRAWN 1 $182,030 55 $121,648 68 $112,867 6 $91,180 11 $110,442 0 $0 FILES CLOSED FOR INCOMPLETENESS 0 $0 2 $160,760 27 $131,137 1 $147,410 1 $190,930 0 $0
Aggregated Statistics For Year 2004(Based on 2 full tracts) A) FHA, FSA/RHS & VA B) Conventional C) Refinancings D) Home Improvement Loans F) Non-occupant Loans on G) Loans On Manufactured Number Average Value Number Average Value Number Average Value Number Average Value Number Average Value Number Average Value
LOANS ORIGINATED 51 $141,354 274 $113,185 145 $100,035 15 $24,073 88 $88,790 0 $0 APPLICATIONS APPROVED, NOT ACCEPTED 3 $136,523 45 $104,250 34 $91,656 7 $44,519 5 $113,374 1 $154,330 APPLICATIONS DENIED 9 $141,360 63 $106,075 96 $106,803 23 $33,249 7 $136,806 1 $25,720 APPLICATIONS WITHDRAWN 4 $132,812 54 $101,481 46 $104,278 4 $58,862 12 $79,803 0 $0 FILES CLOSED FOR INCOMPLETENESS 2 $118,220 6 $93,818 34 $114,788 2 $56,390 7 $94,831 0 $0
Aggregated Statistics For Year 2003(Based on 2 full tracts) A) FHA, FSA/RHS & VA B) Conventional C) Refinancings D) Home Improvement Loans E) Loans on Dwellings For 5+ Families F) Non-occupant Loans on Number Average Value Number Average Value Number Average Value Number Average Value Number Average Value Number Average Value
LOANS ORIGINATED 116 $125,848 163 $116,735 219 $107,306 11 $26,981 0 $0 35 $92,599 APPLICATIONS APPROVED, NOT ACCEPTED 3 $99,980 23 $112,484 40 $91,832 4 $55,152 0 $0 5 $97,568 APPLICATIONS DENIED 14 $126,384 40 $131,626 119 $96,502 18 $33,699 1 $2,433,680 21 $94,172 APPLICATIONS WITHDRAWN 7 $130,023 17 $108,474 55 $90,512 0 $0 0 $0 5 $89,828 FILES CLOSED FOR INCOMPLETENESS 0 $0 6 $115,088 6 $101,898 1 $19,790 0 $0 1 $124,650
Aggregated Statistics For Year 2002(Based on 1 full tract) A) FHA, FSA/RHS & VA B) Conventional C) Refinancings D) Home Improvement Loans E) Loans on Dwellings For 5+ Families F) Non-occupant Loans on Number Average Value Number Average Value Number Average Value Number Average Value Number Average Value Number Average Value
LOANS ORIGINATED 124 $119,019 104 $114,730 112 $89,178 13 $21,688 1 $13,014,240 26 $75,225 APPLICATIONS APPROVED, NOT ACCEPTED 4 $118,468 18 $110,692 29 $69,626 5 $37,396 0 $0 4 $86,318 APPLICATIONS DENIED 4 $110,308 25 $131,340 95 $74,406 31 $24,222 0 $0 8 $72,714 APPLICATIONS WITHDRAWN 18 $123,113 15 $124,915 46 $90,457 3 $89,697 0 $0 0 $0 FILES CLOSED FOR INCOMPLETENESS 2 $121,685 10 $98,930 11 $99,919 0 $0 0 $0 0 $0
Aggregated Statistics For Year 2001(Based on 1 full tract) A) FHA, FSA/RHS & VA B) Conventional C) Refinancings D) Home Improvement Loans F) Non-occupant Loans on Number Average Value Number Average Value Number Average Value Number Average Value Number Average Value
LOANS ORIGINATED 57 $106,844 44 $102,213 135 $78,228 8 $18,179 20 $78,105 APPLICATIONS APPROVED, NOT ACCEPTED 0 $0 5 $63,514 25 $74,039 4 $17,560 1 $49,470 APPLICATIONS DENIED 9 $105,196 15 $61,667 80 $64,193 11 $22,754 3 $46,497 APPLICATIONS WITHDRAWN 17 $109,114 8 $83,225 29 $86,206 1 $6,930 1 $49,470 FILES CLOSED FOR INCOMPLETENESS 1 $91,020 0 $0 7 $74,480 1 $2,970 0 $0
Aggregated Statistics For Year 2000(Based on 1 full tract) A) FHA, FSA/RHS & VA B) Conventional C) Refinancings D) Home Improvement Loans E) Loans on Dwellings For 5+ Families F) Non-occupant Loans on Number Average Value Number Average Value Number Average Value Number Average Value Number Average Value Number Average Value
LOANS ORIGINATED 31 $84,761 32 $66,778 52 $57,779 13 $18,340 2 $136,030 2 $58,370 APPLICATIONS APPROVED, NOT ACCEPTED 3 $91,677 5 $91,808 16 $57,689 3 $12,860 0 $0 0 $0 APPLICATIONS DENIED 7 $95,397 13 $71,686 58 $51,921 25 $21,290 0 $0 4 $44,765 APPLICATIONS WITHDRAWN 3 $105,857 6 $47,157 17 $61,278 1 $9,890 0 $0 1 $62,330 FILES CLOSED FOR INCOMPLETENESS 0 $0 5 $66,678 8 $66,654 0 $0 0 $0 0 $0
Aggregated Statistics For Year 1999(Based on 1 full tract) A) FHA, FSA/RHS & VA B) Conventional C) Refinancings D) Home Improvement Loans E) Loans on Dwellings For 5+ Families F) Non-occupant Loans on Number Average Value Number Average Value Number Average Value Number Average Value Number Average Value Number Average Value
LOANS ORIGINATED 20 $80,848 21 $97,679 84 $68,170 15 $67,470 0 $0 5 $45,368 APPLICATIONS APPROVED, NOT ACCEPTED 0 $0 2 $89,185 19 $51,837 7 $19,389 0 $0 4 $46,048 APPLICATIONS DENIED 4 $86,035 15 $41,426 61 $56,209 20 $15,656 1 $82,400 4 $28,598 APPLICATIONS WITHDRAWN 1 $116,330 3 $105,663 33 $65,067 3 $24,880 0 $0 1 $56,230 FILES CLOSED FOR INCOMPLETENESS 0 $0 0 $0 16 $61,860 0 $0 0 $0 0 $0
Detailed HMDA statistics for the following Tracts:
0820.15
, 0821.00
Private Mortgage Insurance Companies Aggregated Statistics For Year 2009(Based on 1 full tract) A) Conventional B) Refinancings Number Average Value Number Average Value
LOANS ORIGINATED 1 $150,370 1 $95,960 APPLICATIONS APPROVED, NOT ACCEPTED 0 $0 0 $0 APPLICATIONS DENIED 0 $0 1 $106,840 APPLICATIONS WITHDRAWN 0 $0 0 $0 FILES CLOSED FOR INCOMPLETENESS 0 $0 0 $0
Aggregated Statistics For Year 2008(Based on 1 full tract) A) Conventional B) Refinancings C) Non-occupant Loans on Number Average Value Number Average Value Number Average Value
LOANS ORIGINATED 12 $144,850 6 $233,310 3 $124,323 APPLICATIONS APPROVED, NOT ACCEPTED 8 $191,678 2 $210,720 1 $185,000 APPLICATIONS DENIED 1 $187,970 1 $341,310 0 $0 APPLICATIONS WITHDRAWN 3 $176,427 2 $252,270 0 $0 FILES CLOSED FOR INCOMPLETENESS 1 $168,180 0 $0 1 $168,180
Aggregated Statistics For Year 2007(Based on 1 full tract) A) Conventional B) Refinancings C) Non-occupant Loans on Number Average Value Number Average Value Number Average Value
LOANS ORIGINATED 49 $193,418 10 $188,956 3 $155,650 APPLICATIONS APPROVED, NOT ACCEPTED 8 $176,342 0 $0 0 $0 APPLICATIONS DENIED 2 $203,300 1 $343,290 0 $0 APPLICATIONS WITHDRAWN 6 $179,723 1 $168,180 0 $0 FILES CLOSED FOR INCOMPLETENESS 0 $0 1 $174,120 0 $0
Aggregated Statistics For Year 2006(Based on 1 full tract) A) Conventional B) Refinancings C) Non-occupant Loans on Number Average Value Number Average Value Number Average Value
LOANS ORIGINATED 7 $161,821 2 $173,130 1 $102,890 APPLICATIONS APPROVED, NOT ACCEPTED 0 $0 4 $132,320 0 $0 APPLICATIONS DENIED 0 $0 0 $0 0 $0 APPLICATIONS WITHDRAWN 0 $0 0 $0 0 $0 FILES CLOSED FOR INCOMPLETENESS 0 $0 0 $0 0 $0
Aggregated Statistics For Year 2005(Based on 1 full tract) A) Conventional B) Refinancings C) Non-occupant Loans on Number Average Value Number Average Value Number Average Value
LOANS ORIGINATED 33 $190,065 2 $125,145 5 $154,132 APPLICATIONS APPROVED, NOT ACCEPTED 13 $187,662 0 $0 4 $164,718 APPLICATIONS DENIED 1 $224,570 0 $0 1 $224,570 APPLICATIONS WITHDRAWN 1 $264,140 0 $0 0 $0 FILES CLOSED FOR INCOMPLETENESS 0 $0 0 $0 0 $0
Aggregated Statistics For Year 2004(Based on 1 full tract) A) Conventional B) Refinancings C) Non-occupant Loans on Number Average Value Number Average Value Number Average Value
LOANS ORIGINATED 21 $122,343 6 $99,920 3 $135,533 APPLICATIONS APPROVED, NOT ACCEPTED 3 $79,803 5 $94,774 2 $61,335 APPLICATIONS DENIED 0 $0 0 $0 0 $0 APPLICATIONS WITHDRAWN 4 $138,998 0 $0 0 $0 FILES CLOSED FOR INCOMPLETENESS 0 $0 0 $0 0 $0
Aggregated Statistics For Year 2003(Based on 1 full tract) A) Conventional B) Refinancings C) Non-occupant Loans on Number Average Value Number Average Value Number Average Value
LOANS ORIGINATED 90 $138,634 14 $116,172 16 $109,751 APPLICATIONS APPROVED, NOT ACCEPTED 23 $140,266 11 $135,445 7 $113,629 APPLICATIONS DENIED 3 $125,310 0 $0 1 $124,650 APPLICATIONS WITHDRAWN 1 $179,060 0 $0 0 $0 FILES CLOSED FOR INCOMPLETENESS 1 $98,930 0 $0 1 $98,930
Aggregated Statistics For Year 2002(Based on 1 full tract) A) Conventional B) Refinancings C) Non-occupant Loans on Number Average Value Number Average Value Number Average Value
LOANS ORIGINATED 55 $131,559 18 $96,512 8 $115,254 APPLICATIONS APPROVED, NOT ACCEPTED 14 $135,816 4 $105,112 2 $110,800 APPLICATIONS DENIED 3 $143,120 1 $80,130 0 $0 APPLICATIONS WITHDRAWN 3 $115,747 0 $0 0 $0 FILES CLOSED FOR INCOMPLETENESS 1 $165,210 0 $0 0 $0
Aggregated Statistics For Year 2001(Based on 1 full tract) A) Conventional B) Refinancings C) Non-occupant Loans on Number Average Value Number Average Value Number Average Value
LOANS ORIGINATED 18 $112,506 16 $100,476 3 $80,463 APPLICATIONS APPROVED, NOT ACCEPTED 1 $68,260 1 $98,930 0 $0 APPLICATIONS DENIED 0 $0 0 $0 0 $0 APPLICATIONS WITHDRAWN 2 $143,450 0 $0 0 $0 FILES CLOSED FOR INCOMPLETENESS 0 $0 0 $0 0 $0
Aggregated Statistics For Year 2000(Based on 1 full tract) A) Conventional B) Refinancings C) Non-occupant Loans on Number Average Value Number Average Value Number Average Value
LOANS ORIGINATED 12 $77,660 2 $61,830 1 $75,190 APPLICATIONS APPROVED, NOT ACCEPTED 4 $61,832 1 $63,320 0 $0 APPLICATIONS DENIED 0 $0 0 $0 0 $0 APPLICATIONS WITHDRAWN 0 $0 0 $0 0 $0 FILES CLOSED FOR INCOMPLETENESS 0 $0 0 $0 0 $0
Aggregated Statistics For Year 1999(Based on 1 full tract) A) Conventional B) Refinancings Number Average Value Number Average Value
LOANS ORIGINATED 11 $107,692 3 $100,493 APPLICATIONS APPROVED, NOT ACCEPTED 0 $0 1 $57,190 APPLICATIONS DENIED 0 $0 0 $0 APPLICATIONS WITHDRAWN 0 $0 1 $32,960 FILES CLOSED FOR INCOMPLETENESS 1 $86,280 0 $0
Detailed PMIC statistics for the following Tracts:
0821.00
Most common first names in Tolleson, AZ among deceased individuals Name Count Lived (average)
William 27 72.0 years Jose 21 70.9 years Maria 21 74.1 years John 19 72.3 years James 18 72.8 years Mary 18 71.1 years Francisco 13 74.9 years Richard 13 66.0 years Joe 13 70.5 years Thomas 12 68.9 years
Most common last names in Tolleson, AZ among deceased individuals Last name Count Lived (average)
Martinez 18 69.6 years Hernandez 17 69.8 years Ramirez 16 74.6 years Garcia 13 69.5 years Gonzales 12 73.1 years Moreno 11 74.9 years Lopez 10 72.7 years Johnson 10 74.9 years Perez 9 60.4 years Camacho 9 65.8 years
Tolleson compared to Arizona state average:
Median household income below state average. Unemployed percentage significantly below state average. Black race population percentage above state average. Hispanic race population percentage significantly above state average. Median age below state average. Foreign-born population percentage significantly above state average. Renting percentage above state average. Length of stay since moving in significantly above state average. Percentage of population with a bachelor's degree or higher significantly below state average.
#3 on the list of "Top 101 cities with largest percentage of males in occupations: material moving occupations (population 5,000+)"
#17 on the list of "Top 101 cities with the highest number of burglaries per 100,000 residents, excludes tourist destinations and others with a lot of outsiders visiting based on city industries data (population 5,000+)"
#32 on the list of "Top 101 cities with largest percentage of females in occupations: material moving occupations (population 5,000+)"
#45 on the list of "Top 101 cities with largest percentage of females in industries: other services, except public administration (population 5,000+)"
#64 on the list of "Top 101 cities with largest percentage of males in industries: administrative and support and waste management services (population 5,000+)"
#70 on the list of "Top 101 cities with largest percentage of females in occupations: building and grounds cleaning and maintenance occupations (population 5,000+)"
#77 on the list of "Top 101 cities with the highest number of police officers per 1000 residents (population 5,000+)"
#2 on the list of "Top 101 counties with the highest Nitrogen Dioxide air pollution readings in 2012 (ppm)"
#3 on the list of "Top 101 counties with the highest total withdrawal of fresh water for public supply"
#3 on the list of "Top 101 counties with the highest surface withdrawal of fresh water for public supply"
#4 on the list of "Top 101 counties with the most Other congregations"
#5 on the list of "Top 101 counties with the most Evangelical Protestant adherents (pop. 50,000+)"
Top Patent Applicants
Suem Ping Loo (4)
Alexandra Elyse Hartman (3)
Eric Rodriguez (3)
Alexandra E. Hartman (3)
Simon Mejia (2)
Walter Nabity (1)
Esteban Gonzalez (1)
Mark Glasmann (1)
Charles Edwin Runyan (1)
Guadalupe Chavira (1)
Total of 21 patent applications in 2008-2024.


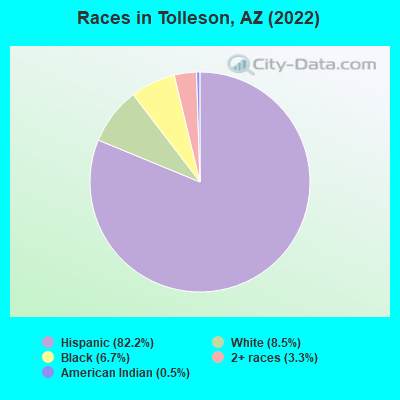
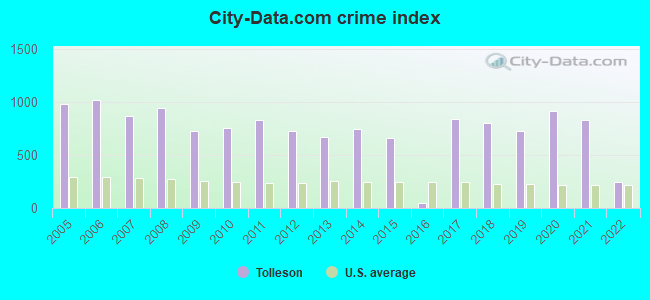
 Recent articles from our blog. Our writers, many of them Ph.D. graduates or candidates, create easy-to-read articles on a wide variety of topics.

 (9.6 miles
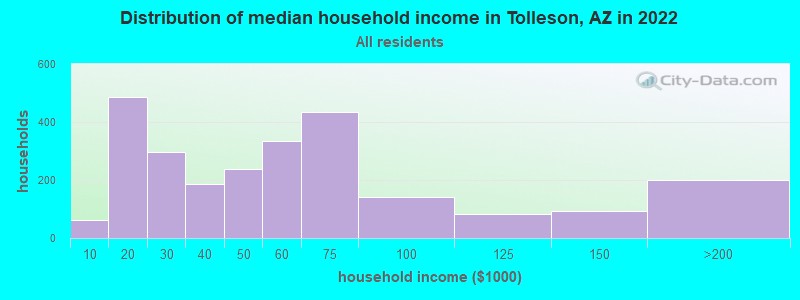
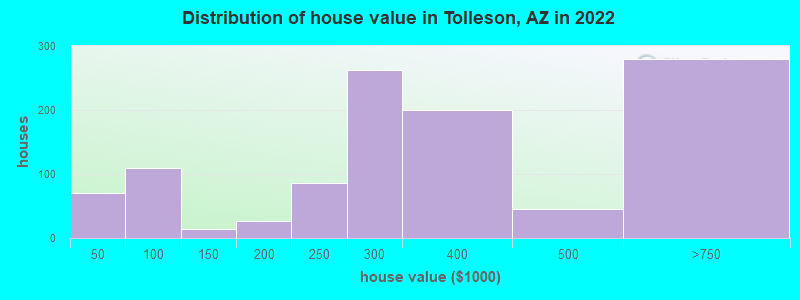

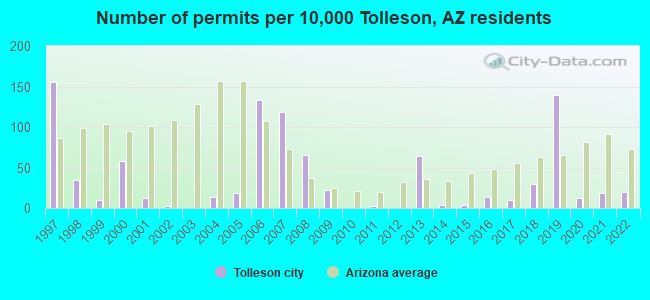
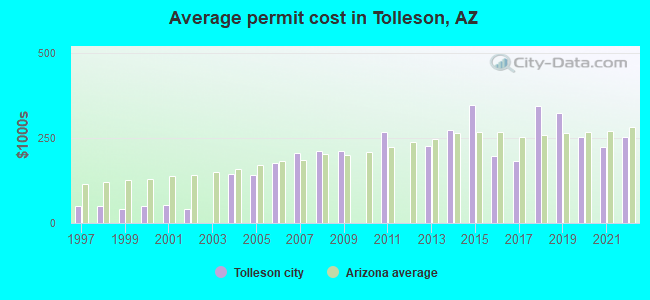
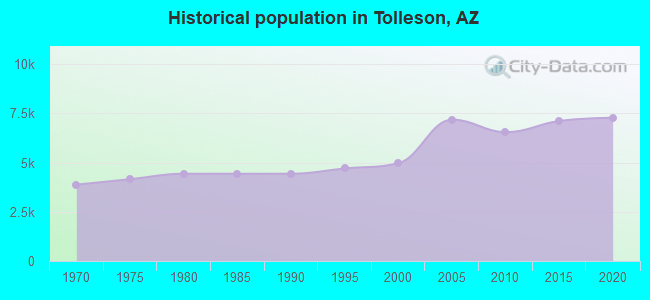
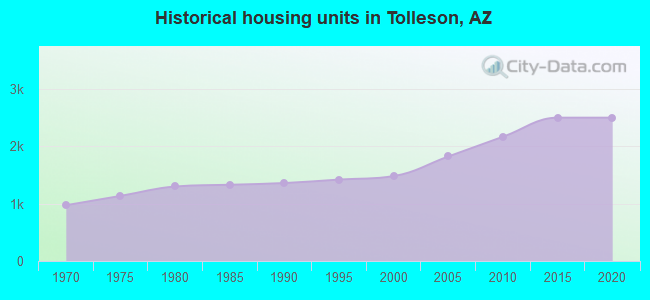
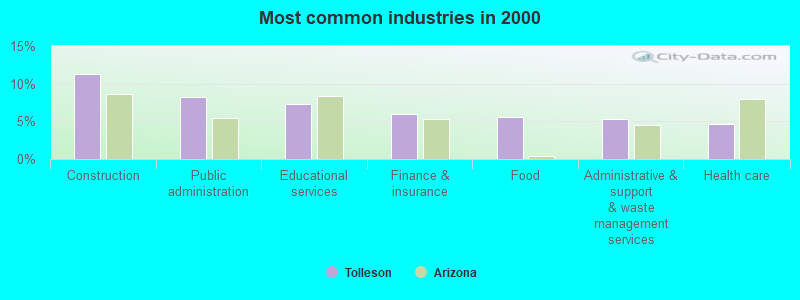
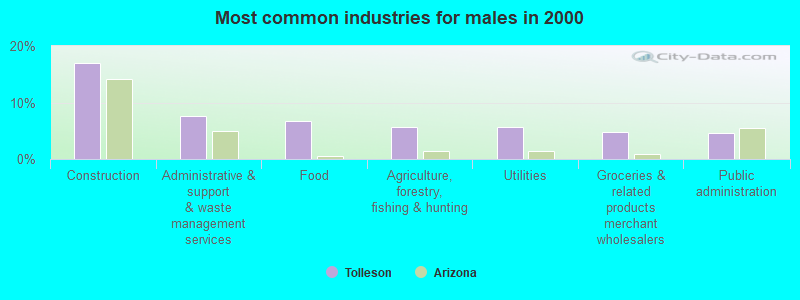
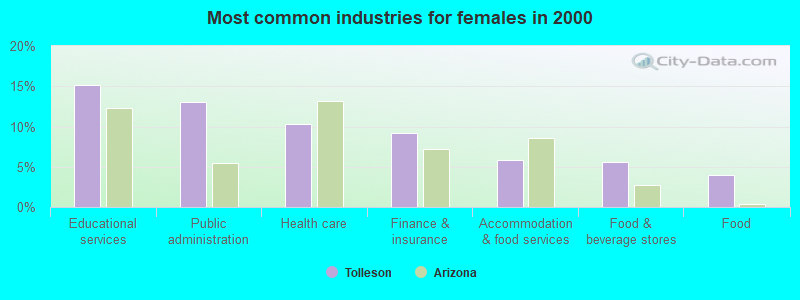
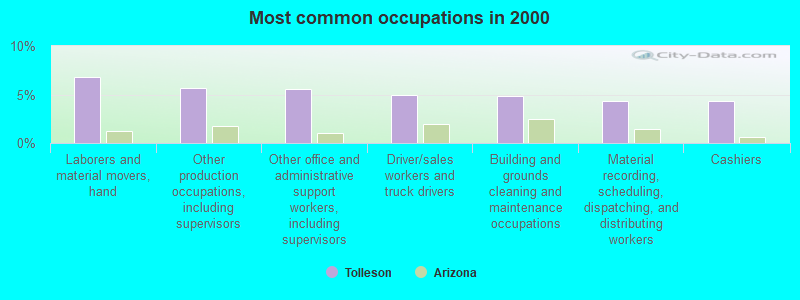
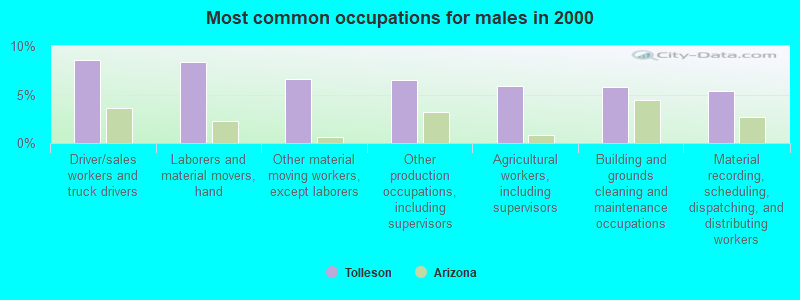
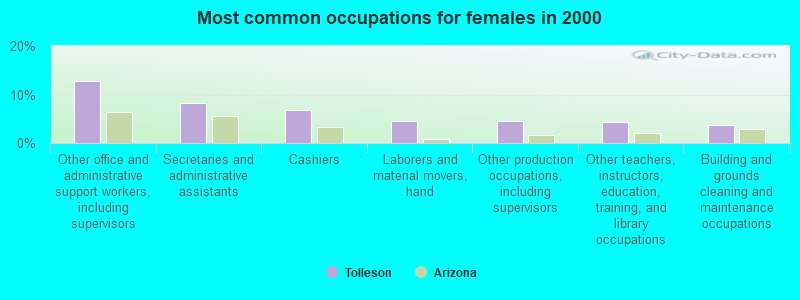
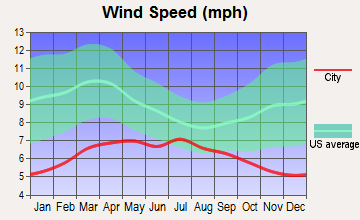
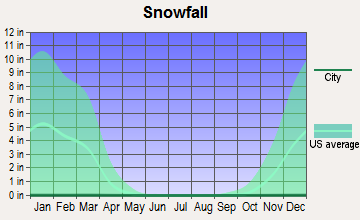
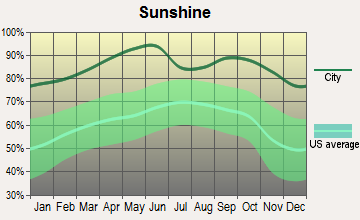
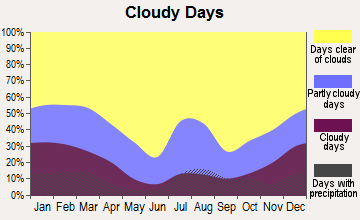
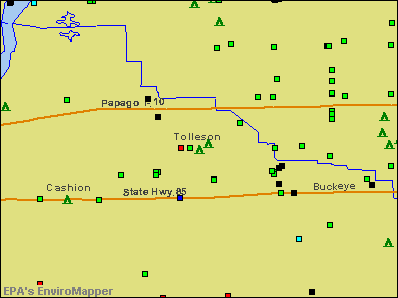

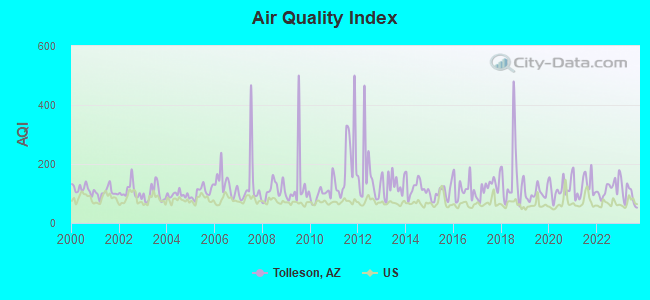
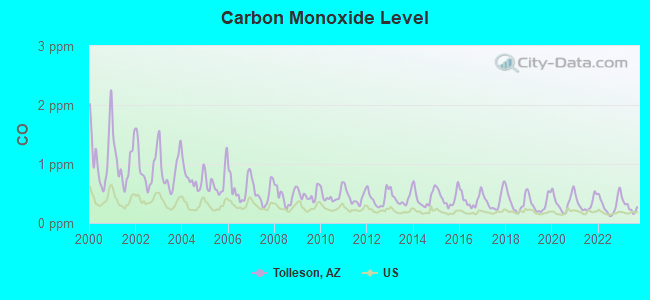
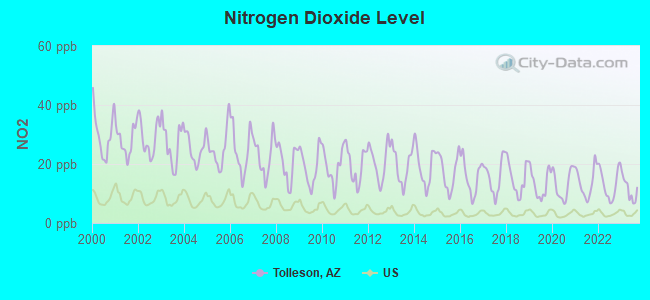
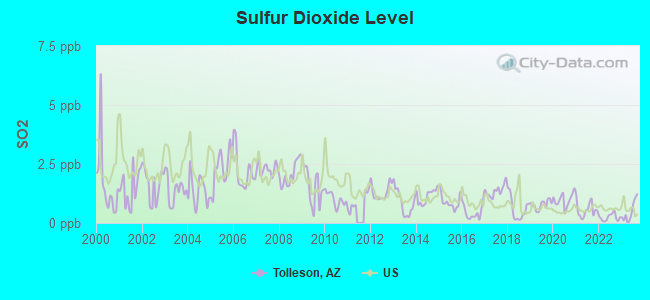
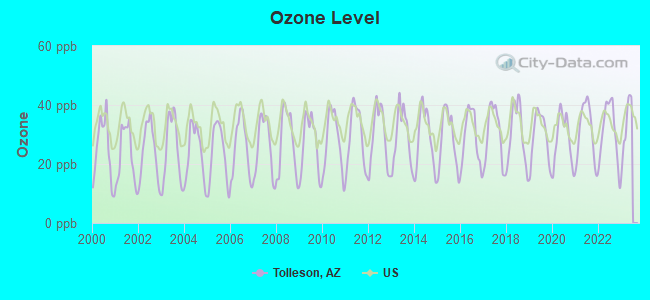
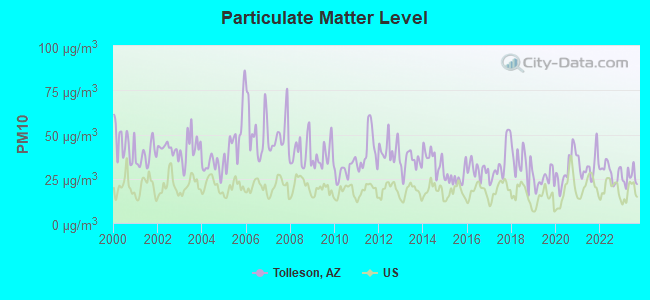
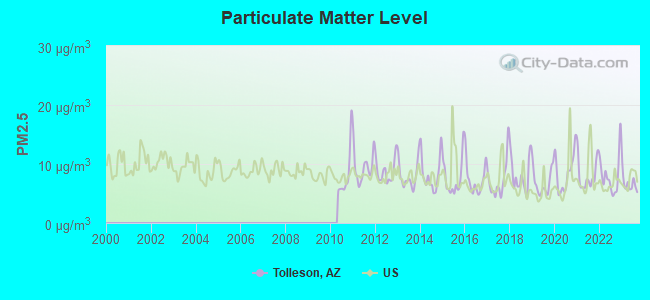
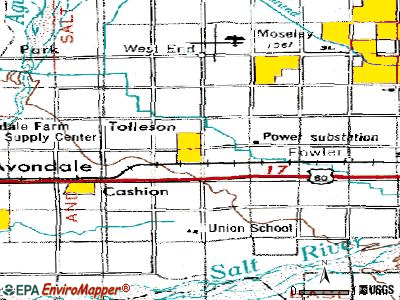
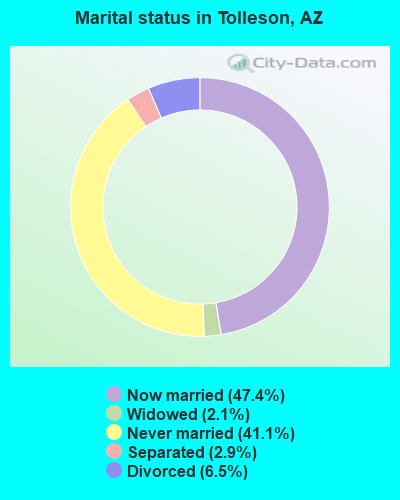
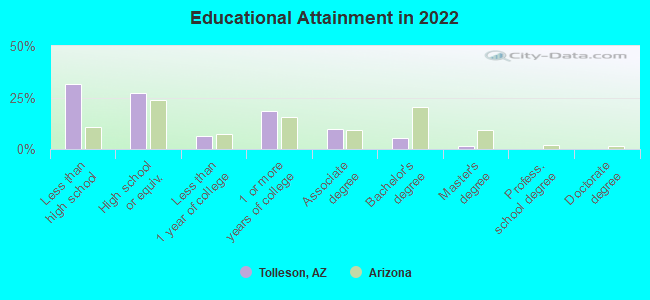
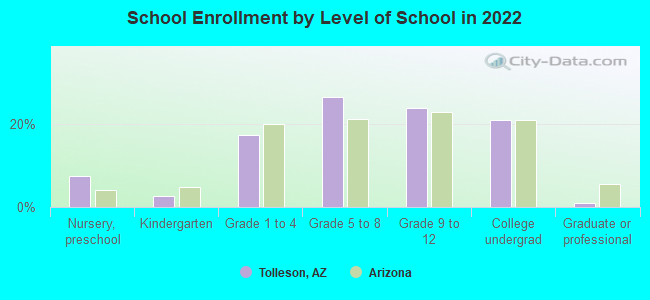
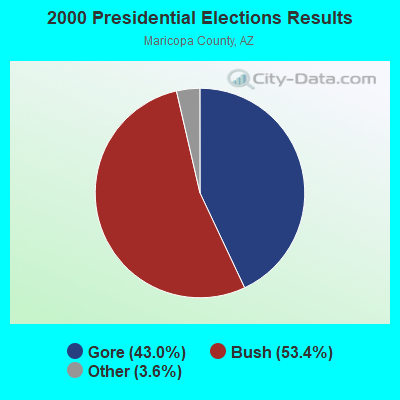
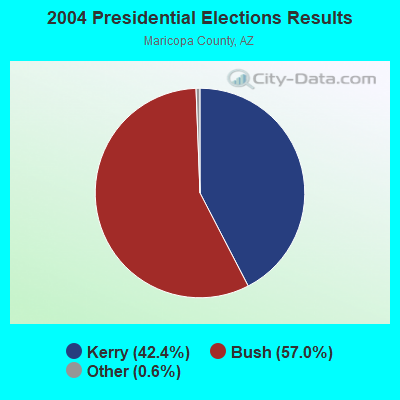
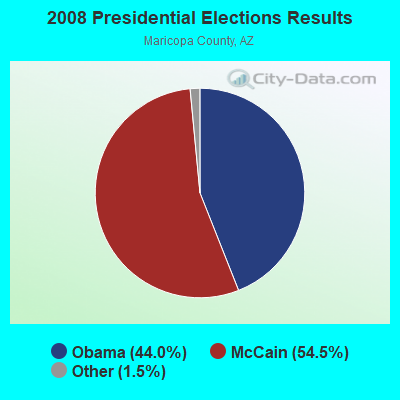
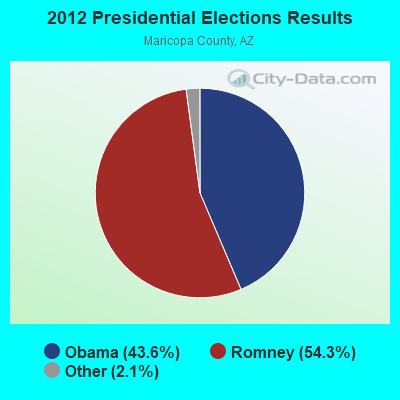
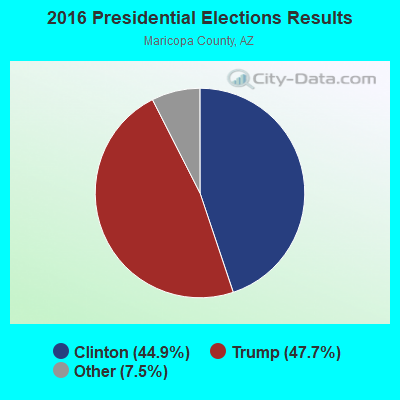
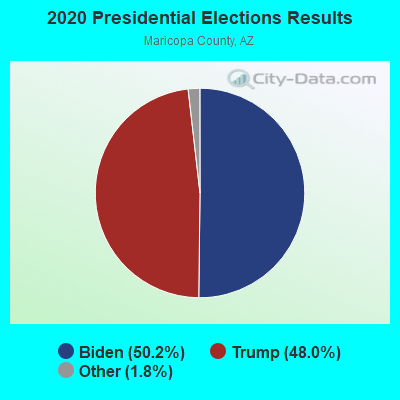
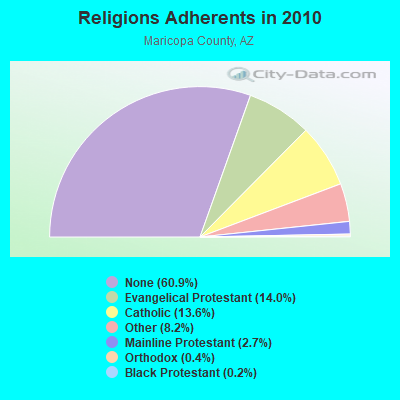
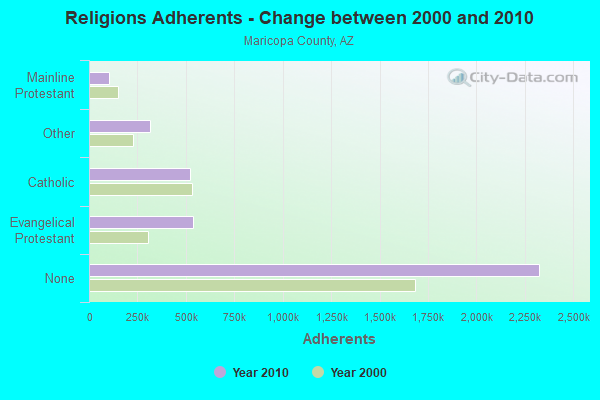
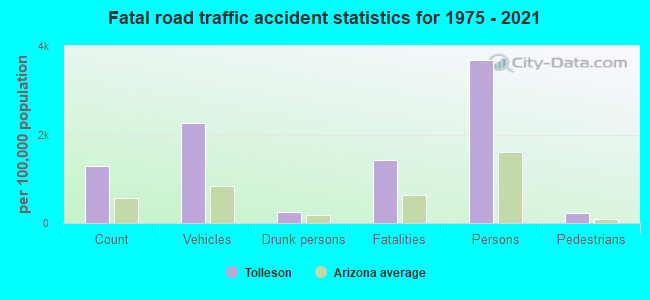
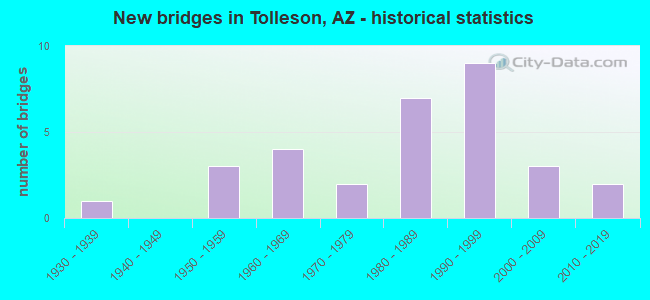
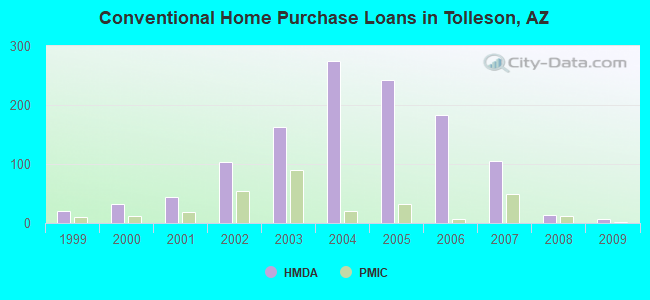
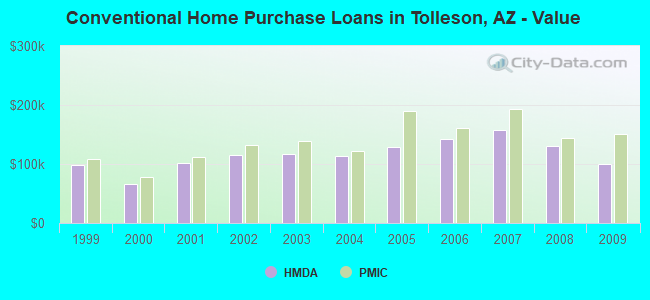
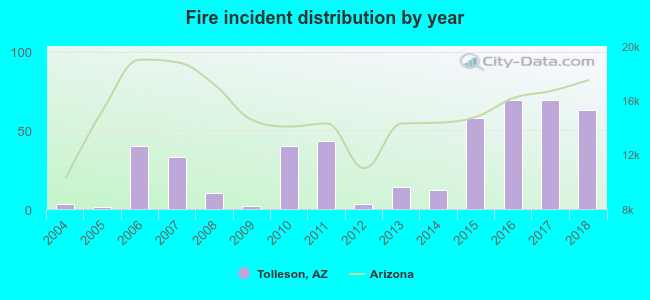 Based on the data from the years 2004 - 2018 the average number of fire incidents per year is 31. The highest number of reported fires - 69 took place in 2016, and the least - 1 in 2005. The data has an increasing trend.
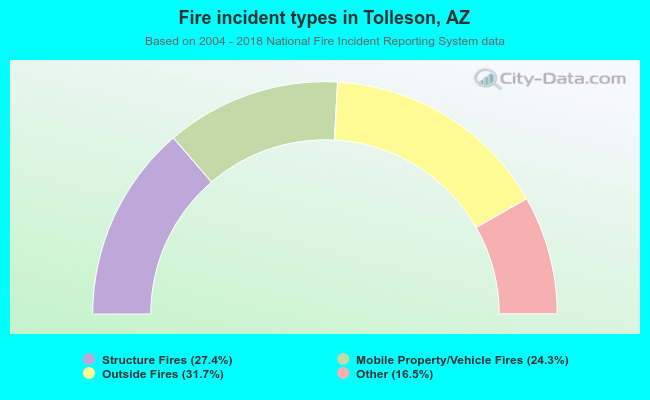 When looking into fire subcategories, the most incidents belonged to: Outside Fires (31.7%), and Structure Fires (27.4%).