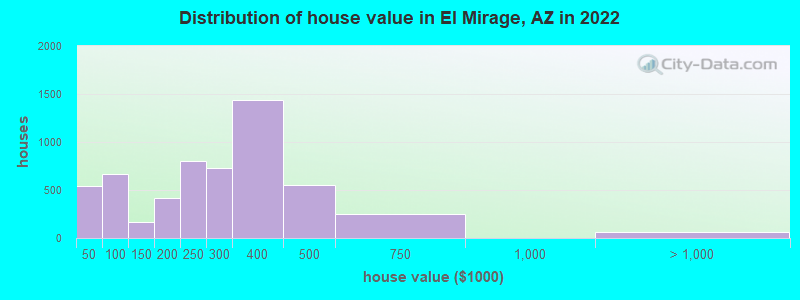
Estimated median house or condo value in 2022: $310,128 (it was $77,100 in 2000)
El Mirage:
$310,128
AZ:
$402,800
Mean prices in 2022:all housing units: $561,376; detached houses: $603,669; townhouses or other attached units: $425,635; in 2-unit structures: $555,372; in 3-to-4-unit structures: $326,563; in 5-or-more-unit structures: $397,708; mobile homes: $119,264; occupied boats, rvs, vans, etc.: $63,144
Median gross rent in 2022: $1,808.
March 2022 cost of living index in El Mirage: 100.2 (near average, U.S. average is 100)
Percentage of residents living in poverty in 2022: 13.4%
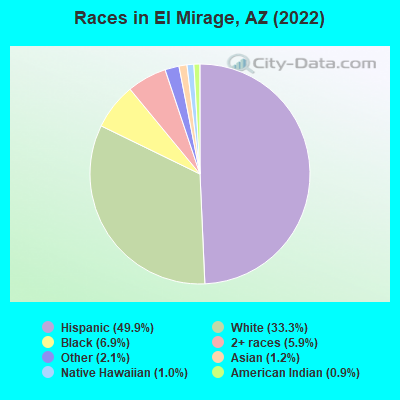
(9.6% for White Non-Hispanic residents, 8.4% for Black residents, 15.8% for Hispanic or Latino residents, 20.0% for American Indian residents, 15.9% for other race residents, 16.7% for two or more races residents)
3641.0%Native Hawaiian and Other Pacific Islander alone
3150.9%American Indian alone
According to our research of Arizona and other state lists, there were 38 registered sex offenders living in El Mirage, Arizona as of April 27, 2024. The ratio of all residents to sex offenders in El Mirage is 927 to 1. The ratio of registered sex offenders to all residents in this city is lower than the state average.
Crime rates in El Mirage by year
Type
2009
2010
2011
2012
2013
2014
2015
2016
2017
2018
2019
2020
2021
2022
Murders (per 100,000)
0 (0.0)
1 (3.1)
2 (6.2)
3 (9.2)
1 (3.0)
0 (0.0)
1 (2.9)
1 (2.9)
1 (2.8)
1 (2.8)
2 (5.5)
4 (11.0)
1 (2.7)
5 (13.9)
Rapes (per 100,000)
4 (14.2)
9 (28.3)
14 (43.4)
7 (21.4)
4 (12.2)
4 (12.0)
4 (11.8)
7 (20.4)
21 (59.0)
15 (42.0)
22 (60.8)
25 (69.0)
14 (38.4)
6 (16.6)
Robberies (per 100,000)
24 (85.1)
25 (78.6)
23 (71.3)
18 (55.1)
18 (54.8)
13 (39.0)
19 (55.9)
16 (46.5)
22 (61.8)
12 (33.6)
14 (38.7)
11 (30.4)
13 (35.6)
10 (27.7)
Assaults (per 100,000)
59 (209.2)
48 (151.0)
56 (173.7)
58 (177.5)
63 (191.9)
39 (117.1)
57 (167.7)
50 (145.5)
41 (115.1)
49 (137.1)
46 (127.1)
66 (182.2)
106 (290.6)
98 (271.9)
Burglaries (per 100,000)
226 (801.5)
225 (707.6)
387 (1,200)
292 (893.4)
297 (904.5)
244 (732.6)
282 (829.8)
284 (826.2)
458 (1,286)
397 (1,111)
362 (1,000)
131 (361.7)
68 (186.4)
38 (105.4)
Thefts (per 100,000)
621 (2,202)
540 (1,698)
585 (1,814)
582 (1,781)
802 (2,442)
701 (2,105)
731 (2,151)
667 (1,940)
443 (1,244)
448 (1,254)
523 (1,445)
579 (1,599)
467 (1,280)
409 (1,135)
Auto thefts (per 100,000)
72 (255.4)
81 (254.7)
69 (214.0)
72 (220.3)
74 (225.4)
70 (210.2)
83 (244.2)
101 (293.8)
104 (292.0)
88 (246.3)
97 (268.1)
93 (256.8)
73 (200.1)
64 (177.6)
Arson (per 100,000)
12 (42.6)
6 (18.9)
5 (15.5)
3 (9.2)
5 (15.2)
8 (24.0)
11 (32.4)
9 (26.2)
2 (5.6)
11 (30.8)
5 (13.8)
4 (11.0)
4 (11.0)
10 (27.7)
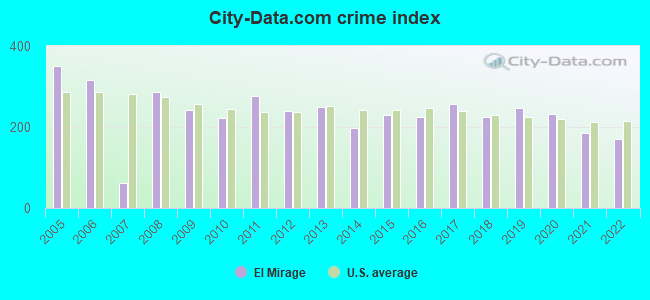
City-Data.com crime index
243.4
220.6
277.0
238.9
249.7
197.0
229.3
224.1
257.5
224.3
246.0
232.7
185.3
170.8
The City-Data.com crime index weighs serious crimes and violent crimes more heavily. Higher means more crime, U.S. average is 246.1. It adjusts for the number of visitors and daily workers commuting into cities.
Ancestries: German (4.4%), American (3.1%), English (2.6%), Irish (2.3%), Italian (2.1%), African (2.0%).
Current Local Time: MST (no DST) time zone
Incorporated in 1951
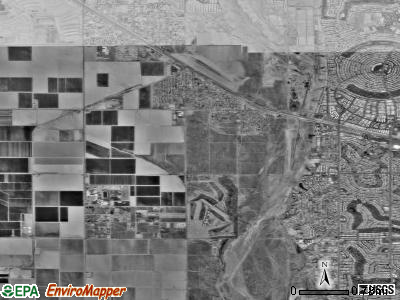
Land area: 9.67 square miles.
Population density: 3,721 people per square mile (average).
5,301 residents are foreign born (11.8% Latin America).
This city:
14.5%
Arizona:
13.0%
Median real estate property taxes paid for housing units with mortgages in 2022: $1,090 (0.3%) Median real estate property taxes paid for housing units with no mortgage in 2022: $902 (0.3%)
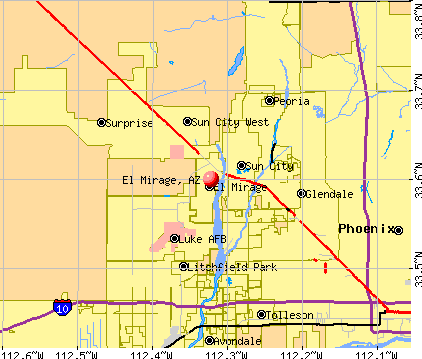
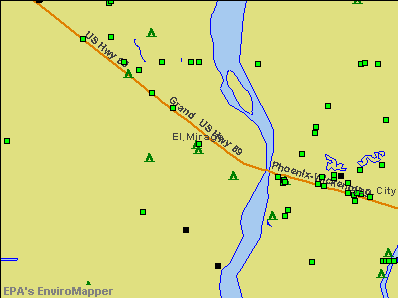
Nearest city with pop. 50,000+: Peoria, AZ (5.3 miles , pop. 108,364).
Nearest city with pop. 200,000+: Glendale, AZ (7.2 miles , pop. 218,812).
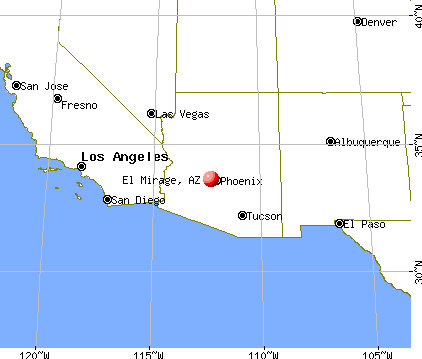
Nearest city with pop. 1,000,000+: Phoenix, AZ (15.0 miles , pop. 1,321,045).
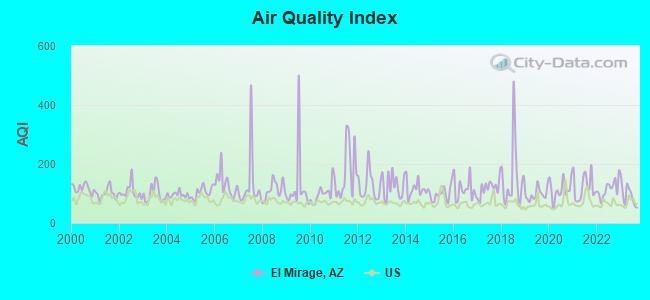
Air Quality Index (AQI) level in 2023 was 94.3. This is worse than average.
City:
94.3
U.S.:
72.6
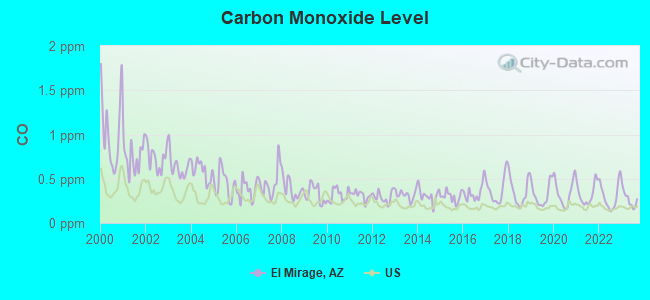
Carbon Monoxide (CO) [ppm] level in 2023 was 0.271. This is about average.Closest monitor was 2.8 miles away from the city center.
City:
0.271
U.S.:
0.251
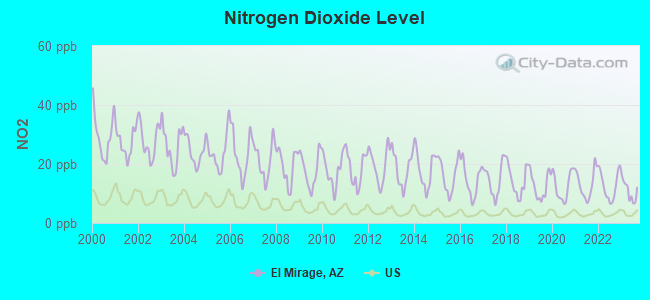
Nitrogen Dioxide (NO2) [ppb] level in 2023 was 10.9. This is significantly worse than average.Closest monitor was 3.1 miles away from the city center.
City:
10.9
U.S.:
5.1
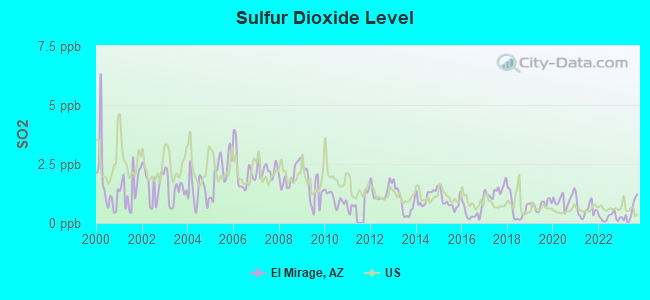
Sulfur Dioxide (SO2) [ppb] level in 2023 was 0.478. This is significantly better than average.Closest monitor was 7.7 miles away from the city center.
City:
0.478
U.S.:
1.515
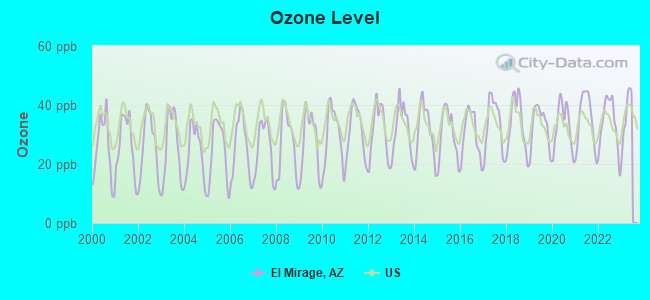
Ozone [ppb] level in 2022 was 33.8. This is about average.Closest monitor was 2.8 miles away from the city center.
City:
33.8
U.S.:
33.3
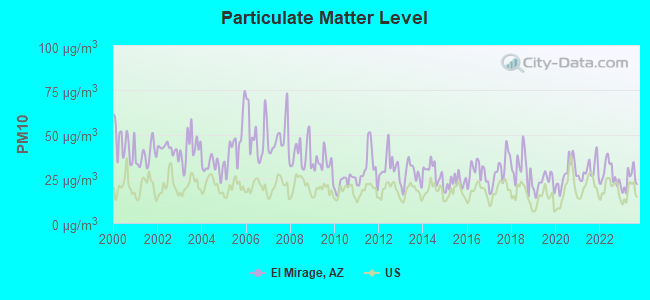
Particulate Matter (PM10) [µg/m3] level in 2023 was 24.4. This is worse than average.Closest monitor was 2.8 miles away from the city center.
City:
24.4
U.S.:
19.2
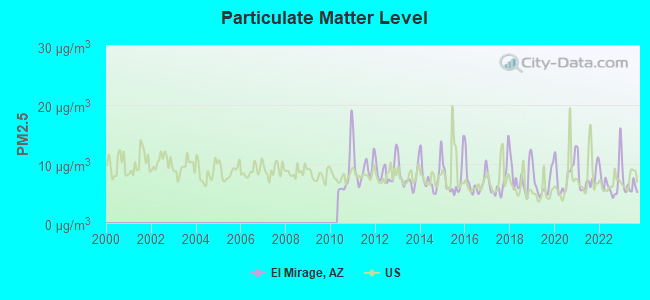
Particulate Matter (PM2.5) [µg/m3] level in 2023 was 6.36. This is better than average.Closest monitor was 7.7 miles away from the city center.
City:
6.36
U.S.:
8.11
Earthquake activity:
El Mirage-area historical earthquake activity is significantly above Arizona state average. It is 2693% greater than the overall U.S. average.
On 6/28/1992 at 11:57:34, a magnitude 7.6 (6.2 MB, 7.6 MS, 7.3 MW, Depth: 0.7 mi, Class: Major, Intensity: VIII - XII) earthquake occurred 245.0 miles away from the city center, causing 3 deaths (1 shaking deaths, 2 other deaths) and 400 injuries, causing $100,000,000 total damage and $40,000,000 insured losses On 5/19/1940 at 04:36:40, a magnitude 7.2 (7.2 UK) earthquake occurred 196.6 miles away from El Mirage center, causing $33,000,000 total damage On 10/16/1999 at 09:46:44, a magnitude 7.4 (6.3 MB, 7.4 MS, 7.2 MW, 7.3 ML) earthquake occurred 244.0 miles away from the city center On 12/31/1934 at 18:45:56, a magnitude 7.1 (7.1 UK) earthquake occurred 209.0 miles away from the city center On 10/15/1979 at 23:16:54, a magnitude 7.0 (5.7 MB, 6.9 MS, 7.0 ML, 6.4 MW) earthquake occurred 199.5 miles away from El Mirage center On 7/21/1952 at 11:52:14, a magnitude 7.7 (7.7 UK) earthquake occurred 393.6 miles away from the city center, causing $50,000,000 total damage Magnitude types: body-wave magnitude (MB), local magnitude (ML), surface-wave magnitude (MS), moment magnitude (MW)
Natural disasters:
The number of natural disasters in Maricopa County (16) is near the US average (15). Major Disasters (Presidential) Declared: 11 Emergencies Declared: 1
Causes of natural disasters: Floods: 10, Storms: 9, Fires: 3, Flash Flood: 1, Heavy Rain: 1, Hurricane: 1, Tornado: 1, Wind: 1, Other: 1 (Note: some incidents may be assigned to more than one category).
Hospitals and medical centers near El Mirage:
SUNVIEW HEALTH AND REHABILITATION CENTER (Nursing Home, about 2 miles away; YOUNGTOWN, AZ)
RESTORA HOSPITAL OF SUN CITY (Nursing Home, about 2 miles away; SUN CITY, AZ)
LIFESTREAM AT COOK HEALTH CARE (Nursing Home, about 2 miles away; YOUNGTOWN, AZ)
BANNER BOSWELL REHABILITATION CENTER (Nursing Home, about 3 miles away; SUN CITY, AZ)
PALM BROOK DIALYSIS CENTER (DVA) (Dialysis Facility, about 3 miles away; SUN CITY, AZ)
BANNER BOSWELL MEDICAL CENTER Acute Care Hospitals (about 3 miles away; SUN CITY, AZ)
DESERT DIALYSIS SRVS INC-SUN CITY (Dialysis Facility, about 3 miles away; SUN CITY, AZ)
Amtrak stations near El Mirage:
13 miles: PHOENIX NORTHWEST (PHOENIX, 8101 BLACK CANYON FWY.) - Bus Station . Services: public payphones, call for taxi service.
18 miles: PHOENIX (401 W. HARRISON ST.) - Bus Station . Services: ticket office, enclosed waiting area, public restrooms, public payphones, vending machines, free short-term parking, paid long-term parking, taxi stand.
Notable locations in El Mirage: Ennis Station (A), El Mirage Town Hall (B), El Mirage Municipal Court (C), Maricopa County Library District El Mirage Branch (D), El Mirage Fire Department (E), El Mirage Police Department (F). Display/hide their locations on the map
Churches in El Mirage include: First Assembly of God (A), Camino Al Cielo Baptist Church (B), Sunset View Baptist Church (C), Our Lady of the Sun Catholic Church (D), Santa Teresita Roman Catholic Church (E), Kingdom Hall of Jehovahs Witnesses (F), The Church of Jesus Christ of Latter Day Saints (G). Display/hide their locations on the map
Maricopa County has a predicted average indoor radon screening level between 2 and 4 pCi/L (pico curies per liter) - Moderate Potential
Drinking water stations with addresses in El Mirage and their reported violations in the past:
EL MIRAGE CITY OF (Address: 12145 NW GRAND AVE , Population served: 36,905, Groundwater):
Past monitoring violations:
Monitoring, Source Water (GWR) - In SEP-23-2010, Contaminant: E. COLI. Follow-up actions: St Compliance achieved (DEC-01-2010)
Monitoring, Repeat Major (TCR) - In SEP-2010, Contaminant: Coliform (TCR). Follow-up actions: St Violation/Reminder Notice (OCT-28-2010), St Compliance achieved (JAN-27-2012)
Monitoring and Reporting (DBP) - In OCT-01-2006, Contaminant: DBP Stage 1. Follow-up actions: St Compliance achieved (AUG-01-2008)
Monitoring and Reporting (DBP) - In OCT-01-2006, Contaminant: DBP Stage 1. Follow-up actions: St Compliance achieved (AUG-01-2008)
Monitoring and Reporting (DBP) - In JUL-01-2006, Contaminant: DBP Stage 1. Follow-up actions: St Compliance achieved (AUG-01-2008)
One minor monitoring violation
196 regular monitoring violations
22 other older monitoring violations
Average household size:
This city:
3.4 people
Arizona:
2.6 people
Percentage of family households:
This city:
78.5%
Whole state:
66.2%
Percentage of households with unmarried partners:
This city:
10.7%
Whole state:
7.8%
Likely homosexual households (counted as self-reported same-sex unmarried-partner households)
Lesbian couples: 0.4% of all households
Gay men: 0.3% of all households
7 people in workers' group living quarters and job corps centers in 2010
6 people in group homes intended for adults in 2010
Banks with branches in El Mirage (2011 data):
SunBank, National Association: El Mirage Branch at 12900 W. Thunderbird, branch established on 2007/07/18. Info updated 2010/07/12: Bank assets: $31.4 mil, Deposits: $23.9 mil, headquarters in Phoenix, AZ, negative income in the last year, 16 total offices, Holding Company: Dickinson Financial Corporation Ii
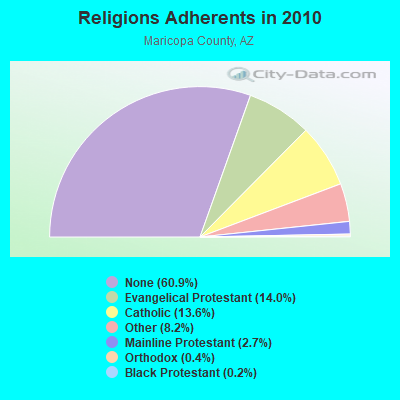
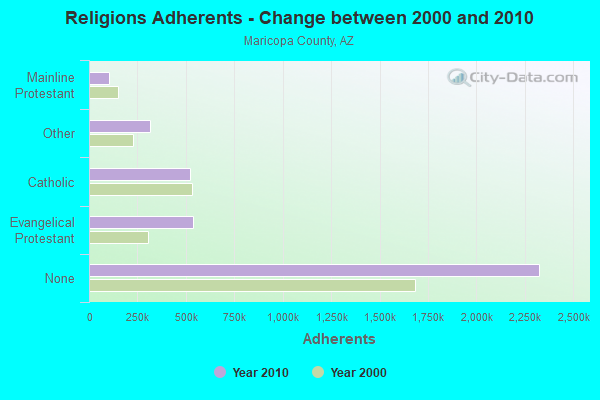
Religion statistics for El Mirage, AZ (based on Maricopa County data)
Religion
Adherents
Congregations
Evangelical Protestant
534,453
1,206
Catholic
520,651
100
Other
312,574
680
Mainline Protestant
104,145
241
Orthodox
13,379
24
Black Protestant
6,278
48
None
2,325,637
-
Source: Clifford Grammich, Kirk Hadaway, Richard Houseal, Dale E.Jones, Alexei Krindatch, Richie Stanley and Richard H.Taylor. 2012. 2010 U.S.Religion Census: Religious Congregations & Membership Study. Association of Statisticians of American Religious Bodies. Jones, Dale E., et al. 2002. Congregations and Membership in the United States 2000. Nashville, TN: Glenmary Research Center. Graphs represent county-level data
Aircraft: CESSNA 182Q (Category: Land, Seats: 4, Weight: Up to 12,499 Pounds, Speed: 112 mph), Engine: CONT MOTOR O-470 SERIES (230 HP) (Reciprocating) N-Number: 5168N, N5168N, N-5168N, Serial Number: 18267555, Year manufactured: 1980, Airworthiness Date: 02/20/1980, Certificate Issue Date: 02/07/2017 Registrant (Co-Owned): David J Nuttall, 12313 W Alice Ave, El Mirage, AZ 85335, Other Owners: Chad I Nuttall
Aircraft: BEECH 58P (Category: Land, Engines: 2, Seats: 6, Weight: Up to 12,499 Pounds, Speed: 123 mph), Engine: CONT MOTOR TSIO-520 SER (300 HP) (Reciprocating) N-Number: 6059S, N6059S, N-6059S, Serial Number: TJ-49, Airworthiness Date: 03/08/1976, Certificate Issue Date: 07/18/2018 Registrant (Individual): Jorge Luis Marquez Gallardo, 12486 W Saint Moritz Ln, El Mirage, AZ 85335
Aircraft: PIPER PA-24 (Category: Land, Seats: 4, Weight: Up to 12,499 Pounds, Speed: 120 mph), Engine: LYCOMING O&VO-360 SER (180 HP) (Reciprocating) N-Number: 6627P, N6627P, N-6627P, Serial Number: 24-1750, Year manufactured: 1959, Airworthiness Date: 01/22/1960, Certificate Issue Date: 07/05/2016 Registrant (Individual): Prabhuvaram J Maddela, 14418 N 130th Ln, El Mirage, AZ 85335
Aircraft: CESSNA A185E (Category: Land, Seats: 6, Weight: Up to 12,499 Pounds, Speed: 125 mph), Engine: CONT MOTOR IO 520 SERIES (285 HP) (Reciprocating) N-Number: 7767B, N7767B, N-7767B, Serial Number: 18501945, Year manufactured: 1971, Airworthiness Date: 12/06/1971, Certificate Issue Date: 05/12/2015 Registrant (Co-Owned): Paul Kline, 12108 W Ocotillo Ln, El Mirage, AZ 85335, Other Owners: Verna Kline
Home Mortgage Disclosure Act Aggregated Statistics For Year 2009 (Based on 1 full and 2 partial tracts)
A) FHA, FSA/RHS & VA Home Purchase Loans
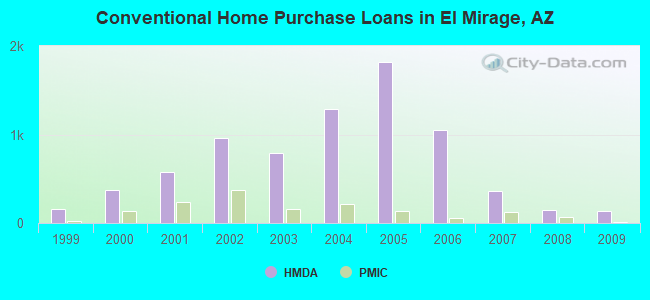
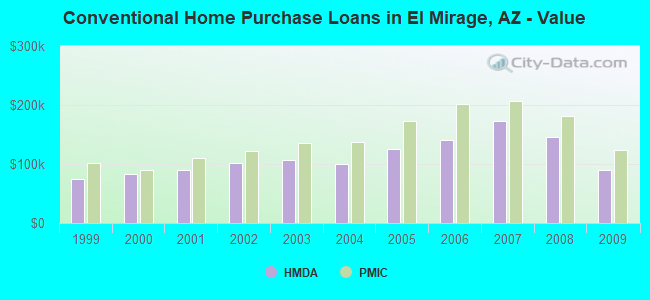
B) Conventional Home Purchase Loans
C) Refinancings
D) Home Improvement Loans
F) Non-occupant Loans on < 5 Family Dwellings (A B C & D)
G) Loans On Manufactured Home Dwelling (A B C & D)
Number
Average Value
Number
Average Value
Number
Average Value
Number
Average Value
Number
Average Value
Number
Average Value
LOANS ORIGINATED
290
$104,791
139
$89,198
185
$160,792
4
$74,482
97
$73,462
1
$92,250
APPLICATIONS APPROVED, NOT ACCEPTED
11
$160,256
13
$77,055
22
$159,045
2
$13,000
7
$73,486
5
$50,888
APPLICATIONS DENIED
48
$115,654
42
$85,797
90
$149,838
13
$31,202
25
$79,016
17
$38,498
APPLICATIONS WITHDRAWN
32
$107,260
17
$92,321
50
$156,413
2
$76,770
15
$78,146
1
$152,220
FILES CLOSED FOR INCOMPLETENESS
14
$99,729
3
$144,513
18
$149,922
2
$49,350
3
$78,960
3
$52,933
Aggregated Statistics For Year 2008 (Based on 1 full and 2 partial tracts)
A) FHA, FSA/RHS & VA Home Purchase Loans
B) Conventional Home Purchase Loans
C) Refinancings
D) Home Improvement Loans
F) Non-occupant Loans on < 5 Family Dwellings (A B C & D)
G) Loans On Manufactured Home Dwelling (A B C & D)
Number
Average Value
Number
Average Value
Number
Average Value
Number
Average Value
Number
Average Value
Number
Average Value
LOANS ORIGINATED
268
$141,718
144
$145,592
153
$164,517
15
$40,871
59
$104,597
10
$69,233
APPLICATIONS APPROVED, NOT ACCEPTED
13
$195,030
38
$125,148
60
$178,602
10
$42,352
7
$147,556
15
$43,077
APPLICATIONS DENIED
64
$157,104
60
$158,431
318
$182,768
53
$84,812
33
$134,430
16
$67,636
APPLICATIONS WITHDRAWN
19
$172,476
21
$210,435
71
$172,529
5
$110,124
12
$145,192
1
$92,260
FILES CLOSED FOR INCOMPLETENESS
7
$152,283
6
$165,318
27
$194,051
2
$166,365
2
$190,520
1
$89,200
Aggregated Statistics For Year 2007 (Based on 1 full and 2 partial tracts)
A) FHA, FSA/RHS & VA Home Purchase Loans
B) Conventional Home Purchase Loans
C) Refinancings
D) Home Improvement Loans
F) Non-occupant Loans on < 5 Family Dwellings (A B C & D)
G) Loans On Manufactured Home Dwelling (A B C & D)
Number
Average Value
Number
Average Value
Number
Average Value
Number
Average Value
Number
Average Value
Number
Average Value
LOANS ORIGINATED
43
$204,522
364
$172,834
604
$168,624
69
$79,050
107
$161,237
15
$93,710
APPLICATIONS APPROVED, NOT ACCEPTED
4
$204,305
61
$194,728
192
$170,929
29
$86,010
24
$153,366
8
$64,775
APPLICATIONS DENIED
8
$175,349
217
$153,050
729
$187,646
142
$78,988
90
$162,535
28
$73,452
APPLICATIONS WITHDRAWN
5
$207,044
70
$182,289
238
$186,740
34
$126,884
29
$156,764
4
$75,052
FILES CLOSED FOR INCOMPLETENESS
1
$180,420
31
$151,124
132
$207,602
4
$111,020
9
$190,901
0
$0
Aggregated Statistics For Year 2006 (Based on 1 full and 2 partial tracts)
A) FHA, FSA/RHS & VA Home Purchase Loans
B) Conventional Home Purchase Loans
C) Refinancings
D) Home Improvement Loans
F) Non-occupant Loans on < 5 Family Dwellings (A B C & D)
G) Loans On Manufactured Home Dwelling (A B C & D)
Number
Average Value
Number
Average Value
Number
Average Value
Number
Average Value
Number
Average Value
Number
Average Value
LOANS ORIGINATED
39
$218,067
1,050
$141,183
1,217
$171,830
123
$87,066
303
$142,463
16
$77,146
APPLICATIONS APPROVED, NOT ACCEPTED
2
$189,965
203
$144,088
213
$174,416
57
$56,045
65
$152,276
23
$61,127
APPLICATIONS DENIED
7
$219,209
501
$132,432
757
$178,831
149
$70,466
106
$145,886
54
$79,405
APPLICATIONS WITHDRAWN
2
$245,185
343
$146,546
467
$176,573
27
$104,086
65
$153,972
3
$84,077
FILES CLOSED FOR INCOMPLETENESS
0
$0
63
$162,418
156
$182,547
5
$101,532
19
$172,583
0
$0
Aggregated Statistics For Year 2005 (Based on 1 full and 2 partial tracts)
A) FHA, FSA/RHS & VA Home Purchase Loans
B) Conventional Home Purchase Loans
C) Refinancings
D) Home Improvement Loans
E) Loans on Dwellings For 5+ Families
F) Non-occupant Loans on < 5 Family Dwellings (A B C & D)
G) Loans On Manufactured Home Dwelling (A B C & D)
Number
Average Value
Number
Average Value
Number
Average Value
Number
Average Value
Number
Average Value
Number
Average Value
Number
Average Value
LOANS ORIGINATED
33
$171,547
1,822
$125,376
1,680
$149,578
158
$96,996
2
$906,230
713
$127,639
49
$54,489
APPLICATIONS APPROVED, NOT ACCEPTED
3
$174,950
222
$111,853
217
$139,655
48
$59,485
0
$0
84
$113,836
23
$62,333
APPLICATIONS DENIED
6
$185,075
494
$111,526
760
$143,384
223
$50,280
0
$0
150
$122,305
76
$66,531
APPLICATIONS WITHDRAWN
3
$158,950
275
$123,424
484
$147,570
51
$118,820
0
$0
96
$126,626
11
$69,593
FILES CLOSED FOR INCOMPLETENESS
1
$253,450
84
$115,832
201
$160,456
7
$100,023
0
$0
17
$125,198
0
$0
Aggregated Statistics For Year 2004 (Based on 1 full and 2 partial tracts)
A) FHA, FSA/RHS & VA Home Purchase Loans
B) Conventional Home Purchase Loans
C) Refinancings
D) Home Improvement Loans
F) Non-occupant Loans on < 5 Family Dwellings (A B C & D)
G) Loans On Manufactured Home Dwelling (A B C & D)
Number
Average Value
Number
Average Value
Number
Average Value
Number
Average Value
Number
Average Value
Number
Average Value
LOANS ORIGINATED
268
$133,102
1,289
$100,376
1,023
$115,102
108
$35,178
360
$100,485
40
$50,847
APPLICATIONS APPROVED, NOT ACCEPTED
9
$120,089
157
$95,939
257
$107,498
31
$30,996
34
$96,219
15
$49,010
APPLICATIONS DENIED
34
$129,504
266
$88,457
669
$112,761
222
$31,711
69
$93,317
55
$59,625
APPLICATIONS WITHDRAWN
27
$129,471
146
$96,187
390
$115,858
34
$48,225
49
$91,491
5
$69,580
FILES CLOSED FOR INCOMPLETENESS
5
$117,262
24
$110,992
92
$128,964
5
$34,218
7
$107,204
1
$140,790
Aggregated Statistics For Year 2003 (Based on 1 full and 2 partial tracts)
A) FHA, FSA/RHS & VA Home Purchase Loans
B) Conventional Home Purchase Loans
C) Refinancings
D) Home Improvement Loans
F) Non-occupant Loans on < 5 Family Dwellings (A B C & D)
Number
Average Value
Number
Average Value
Number
Average Value
Number
Average Value
Number
Average Value
LOANS ORIGINATED
568
$123,139
786
$106,917
1,678
$108,339
81
$23,594
256
$95,316
APPLICATIONS APPROVED, NOT ACCEPTED
17
$121,162
60
$100,010
241
$101,512
31
$26,685
18
$81,252
APPLICATIONS DENIED
57
$121,692
145
$95,587
754
$92,129
205
$23,845
43
$84,520
APPLICATIONS WITHDRAWN
53
$121,658
101
$102,975
529
$105,917
20
$28,316
39
$86,614
FILES CLOSED FOR INCOMPLETENESS
7
$125,151
18
$101,572
64
$105,409
3
$42,223
2
$99,335
Aggregated Statistics For Year 2002 (Based on 1 full and 2 partial tracts)
A) FHA, FSA/RHS & VA Home Purchase Loans
B) Conventional Home Purchase Loans
C) Refinancings
D) Home Improvement Loans
E) Loans on Dwellings For 5+ Families
F) Non-occupant Loans on < 5 Family Dwellings (A B C & D)
Number
Average Value
Number
Average Value
Number
Average Value
Number
Average Value
Number
Average Value
Number
Average Value
LOANS ORIGINATED
1,371
$116,885
961
$102,198
884
$95,716
61
$26,401
1
$1,457,210
238
$86,012
APPLICATIONS APPROVED, NOT ACCEPTED
16
$115,111
78
$99,683
139
$93,670
35
$31,881
0
$0
16
$79,103
APPLICATIONS DENIED
194
$118,114
172
$94,553
575
$73,245
173
$21,611
0
$0
46
$74,509
APPLICATIONS WITHDRAWN
167
$113,917
199
$68,109
216
$92,817
9
$20,347
0
$0
33
$83,162
FILES CLOSED FOR INCOMPLETENESS
12
$106,954
37
$99,956
69
$93,979
2
$14,370
0
$0
4
$122,010
Aggregated Statistics For Year 2001 (Based on 1 full and 2 partial tracts)
A) FHA, FSA/RHS & VA Home Purchase Loans
B) Conventional Home Purchase Loans
C) Refinancings
D) Home Improvement Loans
F) Non-occupant Loans on < 5 Family Dwellings (A B C & D)
Number
Average Value
Number
Average Value
Number
Average Value
Number
Average Value
Number
Average Value
LOANS ORIGINATED
1,109
$105,578
575
$90,352
804
$204,664
45
$22,415
336
$95,586
APPLICATIONS APPROVED, NOT ACCEPTED
28
$104,971
52
$103,282
102
$75,315
26
$17,223
6
$82,612
APPLICATIONS DENIED
141
$111,473
152
$88,969
471
$64,992
186
$18,647
23
$79,410
APPLICATIONS WITHDRAWN
252
$105,966
112
$93,731
181
$78,853
11
$14,146
82
$101,677
FILES CLOSED FOR INCOMPLETENESS
30
$104,580
11
$111,912
39
$77,160
0
$0
9
$100,589
Aggregated Statistics For Year 2000 (Based on 1 full and 2 partial tracts)
A) FHA, FSA/RHS & VA Home Purchase Loans
B) Conventional Home Purchase Loans
C) Refinancings
D) Home Improvement Loans
F) Non-occupant Loans on < 5 Family Dwellings (A B C & D)
Number
Average Value
Number
Average Value
Number
Average Value
Number
Average Value
Number
Average Value
LOANS ORIGINATED
823
$95,139
377
$82,334
89
$60,821
79
$22,258
53
$77,801
APPLICATIONS APPROVED, NOT ACCEPTED
19
$97,772
37
$77,664
38
$67,179
50
$22,940
10
$86,382
APPLICATIONS DENIED
115
$97,397
128
$67,636
148
$44,022
158
$17,684
15
$52,419
APPLICATIONS WITHDRAWN
78
$91,009
47
$88,123
50
$56,744
3
$23,943
6
$82,718
FILES CLOSED FOR INCOMPLETENESS
21
$91,933
10
$88,705
25
$70,064
0
$0
2
$50,580
Aggregated Statistics For Year 1999 (Based on 1 full and 2 partial tracts)
A) FHA, FSA/RHS & VA Home Purchase Loans
B) Conventional Home Purchase Loans
C) Refinancings
D) Home Improvement Loans
F) Non-occupant Loans on < 5 Family Dwellings (A B C & D)
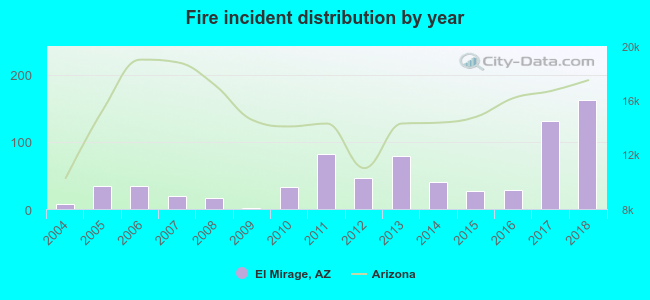
2004 - 2018 National Fire Incident Reporting System (NFIRS) incidents
Based on the data from the years 2004 - 2018 the average number of fires per year is 50. The highest number of reported fires - 162 took place in 2018, and the least - 2 in 2009. The data has an increasing trend.
When looking into fire subcategories, the most incidents belonged to: Structure Fires (43.1%), and Outside Fires (30.4%).
Fire incident types reported to NFIRS in El Mirage, AZ
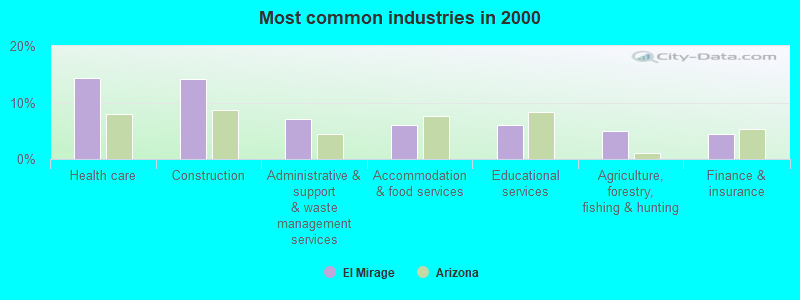
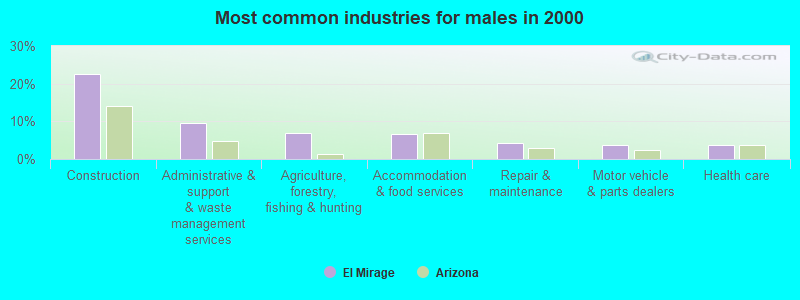
#27 on the list of "Top 101 cities with largest percentage of males in industries: administrative and support and waste management services (population 5,000+)"
#64 on the list of "Top 100 fastest growing cities from 2000 to 2014 (pop. 5,000+)"
#65 on the list of "Top 100 least-safe cities (highest city-data.com crime index)"
#2 on the list of "Top 101 counties with the highest Nitrogen Dioxide air pollution readings in 2012 (ppm)"
#3 on the list of "Top 101 counties with the highest total withdrawal of fresh water for public supply"
#3 on the list of "Top 101 counties with the highest surface withdrawal of fresh water for public supply"
#4 on the list of "Top 101 counties with the most Other congregations"
#5 on the list of "Top 101 counties with the most Evangelical Protestant adherents (pop. 50,000+)"


 Recent articles from our blog. Our writers, many of them Ph.D. graduates or candidates, create easy-to-read articles on a wide variety of topics.

 (5.3 miles


 Based on the data from the years 2004 - 2018 the average number of fires per year is 50. The highest number of reported fires - 162 took place in 2018, and the least - 2 in 2009. The data has an increasing trend.
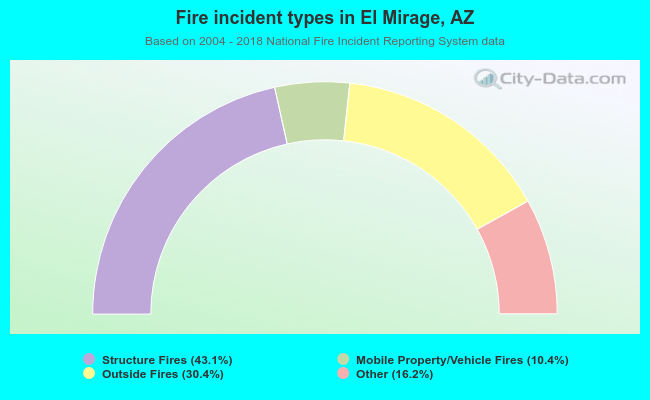 When looking into fire subcategories, the most incidents belonged to: Structure Fires (43.1%), and Outside Fires (30.4%).