Estimated zip code population in 2022: 36,581 Zip code population in 2010: 31,787 Zip code population in 2000: 7,676
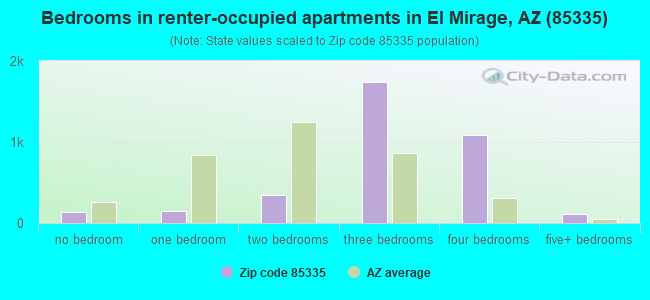
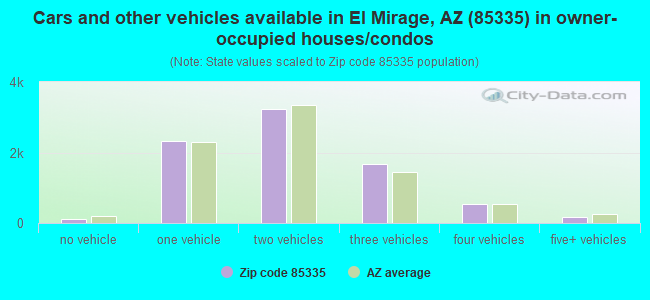
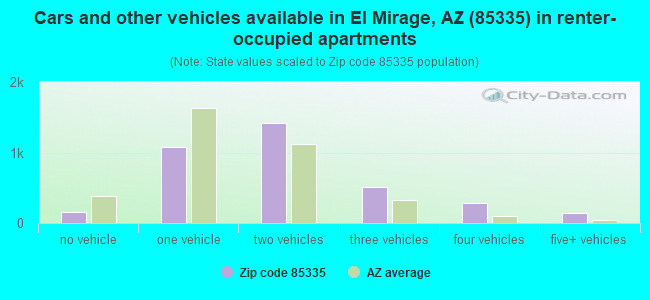
Houses and condos: 12,147 Renter-occupied apartments: 3,513
% of renters here:
30%
State:
33%
March 2022 cost of living index in zip code 85335: 99.8 (near average, U.S. average is 100)
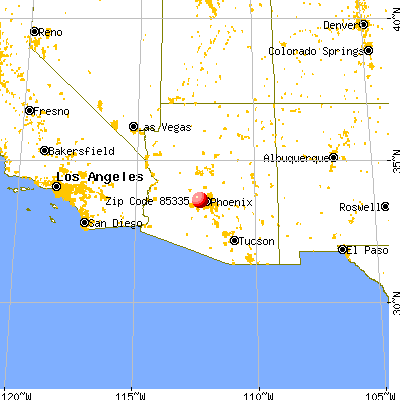
Land area: 10.0 sq. mi. Water area: 0.1 sq. mi.
Population density: 3,659 people per square mile
(average).
OSM Map
General Map
Google Map
MSN Map
OSM Map
General Map
Google Map
MSN Map
OSM Map
General Map
Google Map
MSN Map
OSM Map
General Map
Google Map
MSN Map
Please wait while loading the map...
Real estate property taxes paid for housing units in 2022:
This zip code:
0.3% ($1,029)
Arizona:
0.4% ($1,786)
Median real estate property taxes paid for housing units with mortgages in 2022: $1,086 (0.3%) Median real estate property taxes paid for housing units with no mortgage in 2022: $891 (0.3%)
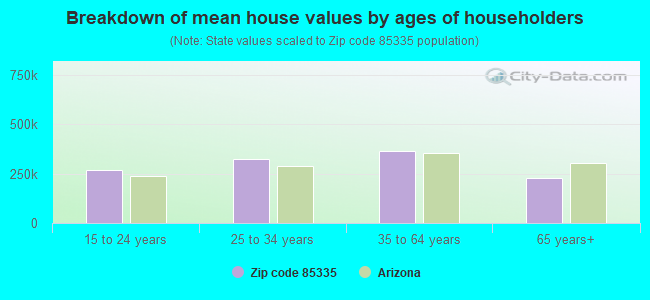
Estimated median house/condo value in 2022: $309,306
85335:
$309,306
Arizona:
$402,800
According to our research of Arizona and other state lists, there were 38 registered sex offenders living in 85335 zip code as of April 27, 2024. The ratio of all residents to sex offenders in zip code 85335 is 906 to 1. The ratio of registered sex offenders to all residents in this zip code is lower than the state average.
Median resident age:
This zip code:
32.2 years
Arizona median age:
38.8 years
Average household size:
This zip code:
3.2 people
Arizona:
2.5 people
Averages for the 2020 tax year for zip code 85335, filed in 2021:
Average Adjusted Gross Income (AGI) in 2020: $42,739 (Individual Income Tax Returns)
Here:
$42,739
State:
$73,499
Salary/wage: $40,930 (reported on 89.2% of returns)
Here:
$40,930
State:
$59,499
(% of AGI for various income ranges: 1284.6% for AGIs below $25k, 3965.7% for AGIs $25k-50k, 7355.8% for AGIs $50k-75k, 10749.3% for AGIs $75k-100k, 18826.5% for AGIs $100k-200k, 44683.3% for AGIs over 200k)
Taxable interest for individuals: $470 (reported on 8.6% of returns)
This zip code:
$470
Arizona:
$2,325
(% of AGI for various income ranges: 2.3% for AGIs below $25k, 2.1% for AGIs $25k-50k, 9.9% for AGIs $50k-75k, 6.2% for AGIs $75k-100k, 22.7% for AGIs $100k-200k, 273.3% for AGIs over 200k)
Ordinary dividends: $1,219 (reported on 4.0% of returns)
Here:
$1,219
State:
$8,711
(% of AGI for various income ranges: 2.7% for AGIs below $25k, 4.6% for AGIs $25k-50k, 7.1% for AGIs $50k-75k, 8.8% for AGIs $75k-100k, 29.0% for AGIs $100k-200k, 263.3% for AGIs over 200k)
Net capital gain/loss in AGI: +$8,651 (reported on 4.6% of returns)
Here:
+$8,651
State:
+$31,332
(% of AGI for various income ranges: 1.8% for AGIs below $25k, 5.0% for AGIs $25k-50k, 19.5% for AGIs $50k-75k, 49.4% for AGIs $75k-100k, 420.6% for AGIs $100k-200k, 10586.7% for AGIs over 200k)
Profit/loss from business: +$8,326 (reported on 13.9% of returns)
Here:
+$8,326
State:
+$13,214
(% of AGI for various income ranges: 139.6% for AGIs below $25k, 104.8% for AGIs $25k-50k, 123.7% for AGIs $50k-75k, 240.9% for AGIs $75k-100k, 606.5% for AGIs $100k-200k)
Taxable individual retirement arrangement distribution: $13,375 (reported on 2.8% of returns)
85335:
$13,375
Arizona:
$23,364
(% of AGI for various income ranges: 17.5% for AGIs below $25k, 29.9% for AGIs $25k-50k, 53.7% for AGIs $50k-75k, 87.1% for AGIs $75k-100k, 401.2% for AGIs $100k-200k)
Total itemized deductions: $24,240 (reported on 3.1% of returns)
Here:
$24,240
State:
$36,308
(% of AGI for various income ranges: 23.2% for AGIs below $25k, 65.1% for AGIs $25k-50k, 147.3% for AGIs $50k-75k, 241.7% for AGIs $75k-100k, 469.0% for AGIs $100k-200k, 2876.7% for AGIs over 200k)
Charity contributions: $5,106 (reported on 2.2% of returns)
Here:
$5,106
State:
$11,955
(% of AGI for various income ranges: 1.3% for AGIs below $25k, 6.8% for AGIs $25k-50k, 16.8% for AGIs $50k-75k, 42.1% for AGIs $75k-100k, 116.5% for AGIs $100k-200k, 546.7% for AGIs over 200k)
Taxes paid: $3,982 (reported on 3.1% of returns)
85335:
$3,982
State:
$6,820
(% of AGI for various income ranges: 2.0% for AGIs below $25k, 8.1% for AGIs $25k-50k, 22.1% for AGIs $50k-75k, 42.0% for AGIs $75k-100k, 107.3% for AGIs $100k-200k, 733.3% for AGIs over 200k)
Earned income credit: $2,569 (reported on 26.0% of returns)
Here:
$2,569
State:
$2,383
(% of AGI for various income ranges: 134.3% for AGIs below $25k, 101.1% for AGIs $25k-50k, 2.4% for AGIs $50k-75k)
Percentage of individuals using paid preparers for their 2020 taxes: 94.3%
Here:
94%
State:
93%
(% for various income ranges: 93.2% for AGIs below $25k, 94.5% for AGIs $25k-50k, 95.5% for AGIs $50k-75k, 94.3% for AGIs $75k-100k, 95.3% for AGIs $100k-200k, 100.0% for AGIs over 200k)
Averages for the 2012 tax year for zip code 85335, filed in 2013:
Average Adjusted Gross Income (AGI) in 2012: $34,433 (Individual Income Tax Returns)
Here:
$34,433
State:
$57,644
Salary/wage: $33,045 (reported on 90.5% of returns)
Here:
$33,045
State:
$47,932
(% of AGI for various income ranges: 82.3% for AGIs below $25k, 91.7% for AGIs $25k-50k, 89.4% for AGIs $50k-75k, 89.1% for AGIs $75k-100k, 78.4% for AGIs $100k-200k, 38.6% for AGIs over 200k)
Taxable interest for individuals: $447 (reported on 10.9% of returns)
This zip code:
$447
Arizona:
$2,064
(% of AGI for various income ranges: 0.2% for AGIs below $25k, 0.5% for AGIs $100k-200k)
Ordinary dividends: $1,188 (reported on 3.9% of returns)
Here:
$1,188
State:
$7,268
(% of AGI for various income ranges: 0.2% for AGIs below $25k, 0.1% for AGIs $50k-75k, 0.5% for AGIs $100k-200k)
Net capital gain/loss in AGI: +$1,112 (reported on 3.4% of returns)
Here:
+$1,112
State:
+$15,530
(% of AGI for various income ranges: 0.9% for AGIs $100k-200k)
Profit/loss from business: +$8,799 (reported on 12.2% of returns)
Here:
+$8,799
State:
+$12,323
(% of AGI for various income ranges: 9.3% for AGIs below $25k, 1.9% for AGIs $25k-50k, 1.3% for AGIs $50k-75k, 0.6% for AGIs $75k-100k, 3.6% for AGIs $100k-200k)
Taxable individual retirement arrangement distribution: $10,411 (reported on 3.6% of returns)
85335:
$10,411
Arizona:
$18,280
(% of AGI for various income ranges: 1.2% for AGIs below $25k, 0.7% for AGIs $25k-50k, 0.9% for AGIs $50k-75k, 1.5% for AGIs $75k-100k, 2.4% for AGIs $100k-200k)
Total itemized deductions: $15,888 (27% of AGI, reported on 19.5% of returns)
Here:
$15,888
State:
$23,651
Here:
26.6% of AGI
State:
20.6% of AGI
(% of AGI for various income ranges: 4.8% for AGIs below $25k, 7.7% for AGIs $25k-50k, 10.5% for AGIs $50k-75k, 12.4% for AGIs $75k-100k, 13.3% for AGIs $100k-200k, 10.8% for AGIs over 200k)
Charity contributions: $2,119 (reported on 14.3% of returns)
Here:
$2,119
State:
$4,114
(% of AGI for various income ranges: 0.3% for AGIs below $25k, 0.7% for AGIs $25k-50k, 1.1% for AGIs $50k-75k, 1.2% for AGIs $75k-100k, 1.9% for AGIs $100k-200k)
Taxes paid: $3,278 (reported on 19.4% of returns)
85335:
$3,278
State:
$6,509
(% of AGI for various income ranges: 0.6% for AGIs below $25k, 1.4% for AGIs $25k-50k, 2.1% for AGIs $50k-75k, 2.8% for AGIs $75k-100k, 3.6% for AGIs $100k-200k, 4.0% for AGIs over 200k)
Earned income credit: $2,692 (reported on 35.3% of returns)
Here:
$2,692
State:
$2,432
(% of AGI for various income ranges: 10.6% for AGIs below $25k, 2.2% for AGIs $25k-50k)
Percentage of individuals using paid preparers for their 2012 taxes: 51.8%
Here:
52%
State:
52%
(% for various income ranges: 54.8% for AGIs below $25k, 49.4% for AGIs $25k-50k, 48.5% for AGIs $50k-75k, 48.5% for AGIs $75k-100k, 57.1% for AGIs $100k-200k)
Averages for the 2004 tax year for zip code 85335, filed in 2005:
Average Adjusted Gross Income (AGI) in 2004: $34,600 (Individual Income Tax Returns)
Here:
$34,600
State:
$50,097
Salary/wage: $33,739 (reported on 95.2% of returns)
Here:
$33,739
State:
$42,146
(% of AGI for various income ranges: 104.5% for AGIs below $10k, 92.1% for AGIs $10k-25k, 95.5% for AGIs $25k-50k, 93.7% for AGIs $50k-75k, 91.8% for AGIs $75k-100k, 70.2% for AGIs over 100k)
Taxable interest for individuals: $413 (reported on 18.3% of returns)
This zip code:
$413
Arizona:
$2,374
(% of AGI for various income ranges: 0.9% for AGIs below $10k, 0.4% for AGIs $10k-25k, 0.1% for AGIs $25k-50k, 0.1% for AGIs $50k-75k, 0.1% for AGIs $75k-100k, 1.1% for AGIs over 100k)
Taxable dividends: $533 (reported on 5.6% of returns)
Here:
$533
State:
$3,888
(% of AGI for various income ranges: 0.6% for AGIs below $10k, 0.1% for AGIs $10k-25k, 0.1% for AGIs $25k-50k, 0.1% for AGIs $50k-75k, 0.0% for AGIs $75k-100k, 0.4% for AGIs over 100k)
Net capital gain/loss: +$2,330 (reported on 4.8% of returns)
Here:
+$2,330
State:
+$17,569
(% of AGI for various income ranges: -0.5% for AGIs below $10k, 0.1% for AGIs $10k-25k, 0.2% for AGIs $25k-50k, 0.4% for AGIs $50k-75k, 0.8% for AGIs $75k-100k, 1.2% for AGIs over 100k)
Profit/loss from business: +$5,473 (reported on 9.7% of returns)
Here:
+$5,473
State:
+$11,088
(% of AGI for various income ranges: 5.8% for AGIs below $10k, 3.5% for AGIs $10k-25k, 1.0% for AGIs $25k-50k, 1.0% for AGIs $50k-75k, 0.9% for AGIs $75k-100k, 2.9% for AGIs over 100k)
IRA payment deduction: $1,836 (reported on 1.0% of returns)
85335:
$1,836
Arizona:
$3,023
(% of AGI for various income ranges: 0.0% for AGIs $10k-25k, 0.1% for AGIs $25k-50k, 0.0% for AGIs $50k-75k, 0.1% for AGIs $75k-100k)
Total itemized deductions: $13,784 (28% of AGI, reported on 38.7% of returns)
Here:
$13,784
State:
$19,781
Here:
27.8% of AGI
State:
21.8% of AGI
(% of AGI for various income ranges: 10.3% for AGIs below $10k, 9.6% for AGIs $10k-25k, 15.4% for AGIs $25k-50k, 17.2% for AGIs $50k-75k, 18.1% for AGIs $75k-100k, 17.2% for AGIs over 100k)
Charity contributions deductions: $1,537 (3% of AGI, reported on 30.4% of returns)
Here:
$1,537
State:
$3,389
Here:
3.0% of AGI
State:
3.5% of AGI
(% of AGI for various income ranges: 0.7% for AGIs below $10k, 0.6% for AGIs $10k-25k, 1.2% for AGIs $25k-50k, 1.6% for AGIs $50k-75k, 2.0% for AGIs $75k-100k, 1.8% for AGIs over 100k)
Total tax: $3,152 (reported on 66.2% of returns)
85335:
$3,152
State:
$8,323
(% of AGI for various income ranges: 2.6% for AGIs below $10k, 2.8% for AGIs $10k-25k, 4.9% for AGIs $25k-50k, 6.9% for AGIs $50k-75k, 8.9% for AGIs $75k-100k, 14.0% for AGIs over 100k)
Earned income credit: $1,912 (reported on 25.5% of returns)
Here:
$1,912
State:
$1,786
Percentage of individuals using paid preparers for their 2004 taxes: 62.7%
Here:
63%
State:
60%
(% for various income ranges: 59.0% for AGIs below $10k, 67.8% for AGIs $10k-25k, 61.7% for AGIs $25k-50k, 60.8% for AGIs $50k-75k, 57.3% for AGIs $75k-100k, 61.2% for AGIs over 100k)
Likely homosexual households (counted as self-reported same-sex unmarried-partner households)
Lesbian couples: 0.6% of all households
Gay men: 0.1% of all households
Household received Food Stamps/SNAP in the past 12 months: 2,450 Household did not receive Food Stamps/SNAP in the past 12 months: 9,159
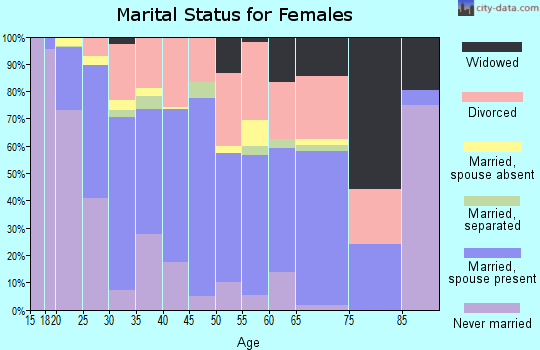
Women who had a birth in the past 12 months: 494 (303 now married, 189 unmarried) Women who did not have a birth in the past 12 months: 9,852 (3,639 now married, 6,224 unmarried)
Housing units in zip code 85335 with a mortgage: 5,401 (187 second mortgage, 183 both second mortgage and home equity loan) Houses without a mortgage: 39
Median monthly owner costs for units with a mortgage: $1,351 Median monthly owner costs for units without a mortgage: $446
Residents with income below the poverty level in 2022:
This zip code:
12.7%
Whole state:
12.5%
Residents with income below 50% of the poverty level in 2022:
This zip code:
6.3%
Whole state:
6.0%
Median number of rooms in houses and condos:
Here:
5.6
State:
6.0
Median number of rooms in apartments:
Here:
5.2
State:
4.1
Notable locations in this zip code not listed on our city pages
Notable locations in zip code 85335: El Mirage Industrial Land Fill (A), Ennis Station (B), El Mirage Town Hall (C), El Mirage Municipal Court (D), Maricopa County Library District El Mirage Branch (E), El Mirage Fire Department (F), El Mirage Police Department (G). Display/hide their locations on the map
Churches in zip code 85335 include: First Assembly of God (A), Camino Al Cielo Baptist Church (B), Sunset View Baptist Church (C), Our Lady of the Sun Catholic Church (D), Santa Teresita Roman Catholic Church (E), Kingdom Hall of Jehovahs Witnesses (F), The Church of Jesus Christ of Latter Day Saints (G). Display/hide their locations on the map
4,965 married couples with children.
3,343 single-parent households (1,138 men, 2,205 women).
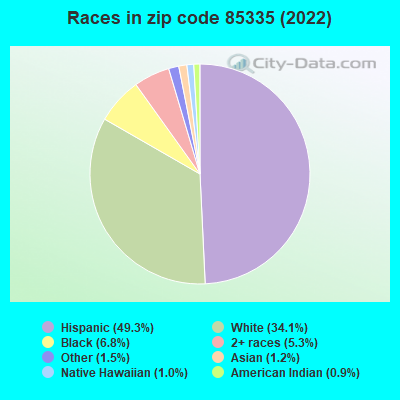
64.4% of residents of 85335 zip code speak English at home.
30.4% of residents speak Spanish at home (73% very well, 14% well, 8% not well, 4% not at all).
1.9% of residents speak other Indo-European language at home (68% very well, 29% well, 2% not well, 1% not at all).
1.4% of residents speak Asian or Pacific Island language at home (60% very well, 15% well, 20% not well, 6% not at all).
1.2% of residents speak other language at home (68% very well, 26% well, 6% not well).
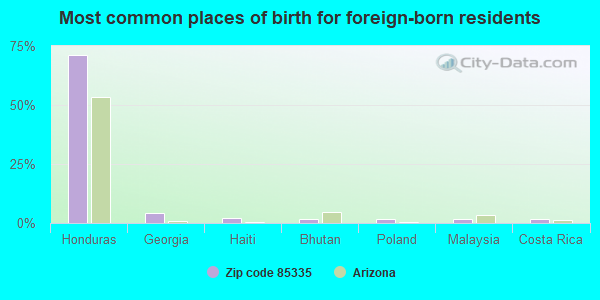
Foreign born population: 5,324 (14.6%) (52.9% of them are naturalized citizens)
This zip code:
14.6%
Whole state:
13.1%
71%Honduras
4%Georgia
2%Haiti
2%Bhutan
2%Poland
2%Malaysia
2%Costa Rica
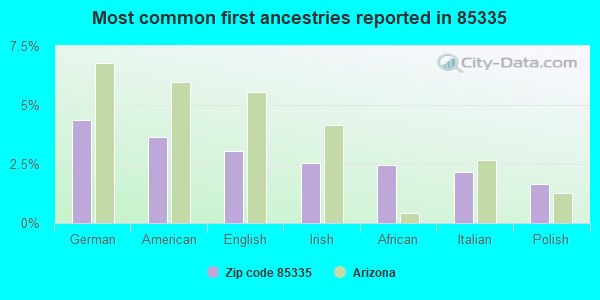
4%German
4%American
3%English
3%Irish
2%African
2%Italian
2%Polish
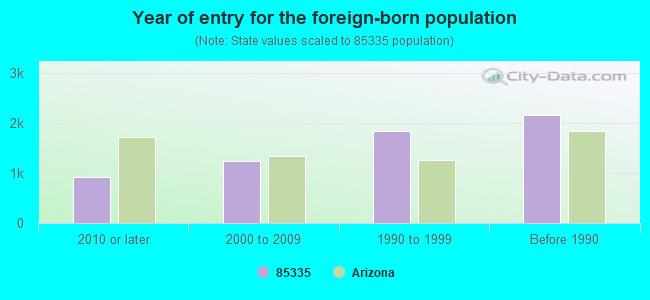
Year of entry for the foreign-born population
9242010 or later
1,2362000 to 2009
1,8511990 to 1999
2,163Before 1990
Facilities with environmental interests located in this zip code:
EQUILON TRANSMIX FACILITY (12126 WEST OLIVE AVENUE in EL MIRAGE, AZ)
AIR SYNTHETIC MINOR (AIRS/AFS) STATE MASTER (Arizona's Tracking Of The Environment) - AZURITE-286, AIR MAJOR, AIR MINOR, AIR PROGRAM (Integrated Compliance Information System) - ICIS-09-2000-0375, FORMAL ENFORCEMENT ACTION CRITERIA AND HAZARDOUS AIR POLLUTANT INVENTORY (Inventory of air pollution sources) TRI REPORTER (Tracking of toxic chemicals releasing facilities) Business SIC classification: PETROLEUM REFINING Organizations: VALLEY REFINING (CONTACT/GENERAL)
, SHELL OIL PRODUCTS US (CONTACT/GENERAL)
, FUEL PROCESSING OPERATORS , LLC (CONTACT/GENERAL)
Alternative names: EL MIRAGE FRACTIONATE TRANSMIX - FORMER, EQUILON ENTERPRISES L.L.C. PHOENIX TRANSMIX FACILITY, EQUILON ENTERPRISES L.L.C. PHOENIX TRANSMIX FACILITY, EQUILON PHOENIX TRANSMIX FACILITY, EQUILONE ENTERPRISES LLC, THE ESTRELLA PETROLEUM CORPORATION, ESTRELLA PETROLEUM - FORMER, VALLEY REFINING L.L.C., VALLEY REFINING - FORMER
DYSART ELEMENTARY SCHOOL (11405 N DYSART RD in EL MIRAGE, AZ)
(Geographic Names Information System) (National Center for Education Statistics) - STATE ID-101 Organizations: DYSART UNIFIED DISTRICT (SCHOOL DISTRICT)
DYSART HIGH SCHOOL (11425 N DYSART RD in EL MIRAGE, AZ)
(Geographic Names Information System) (National Center for Education Statistics) - STATE ID-205 Organizations: DYSART UNIFIED DISTRICT (SCHOOL DISTRICT)
EL MIRAGE SCHOOL (12308 W THUNDERBIRD RD in EL MIRAGE, AZ)
(National Center for Education Statistics) - STATE ID-102 Organizations: DYSART UNIFIED DISTRICT (SCHOOL DISTRICT)
VULCAN MATERIALS CO (14521 N. 115TH. AVE. in EL MIRAGE, AZ)
AIR SYNTHETIC MINOR (AIRS/AFS) CRITERIA AND HAZARDOUS AIR POLLUTANT INVENTORY (Inventory of air pollution sources) (Resource Conservation and Recovery Act (tracking hazardous waste)) TRI REPORTER (Tracking of toxic chemicals releasing facilities) Business SIC classification: ASPHALT PAVING MIXTURES AND BLOCKS Business NAICS classification: ASPHALT PAVING MIXTURE AND BLOCK MANUFACTURING. Organizations: DKM AND HUNT COMPANIES (CONTACT/OWNER)
Alternative names: CALMAT OF AZ, INDUSTRIAL ASPHALT, VULCAN MATERIALS CO. SUN CITY
EL MIRAGE CITY OF (12000 WEST PEORIA AVENUE in EL MIRAGE, AZ)
National Pollutant Discharge Elimination System MAJOR (Tracking pollutant discharge elimination systems) - permit National Pollutant Discharge Elimination System NON-MAJOR (Tracking pollutant discharge elimination systems) - permit Conditionally Exempt Small Quantity Generators, less than 100 kg/month of hazardous waste (Resource Conservation and Recovery Act (tracking hazardous waste)) Business SIC classification: SEWERAGE SYSTEMS Organizations: CITY OF ELMIRAGE (CONTACT/OWNER)
, CITY OF EL MIRAGE (CONTACT/OWNER)
Alternative names: CITY OF EL MIRAGE, EL MIRAGE WWTP
APS COMPANY EL MIRAGE CONSTRUCTION (501 NORTHRUP in EL MIRAGE, AZ)
(Resource Conservation and Recovery Act (tracking hazardous waste)) Organizations: AZ PUBLIC SERVICE CO (CONTACT/OWNER)
EL MIRAGE YARD (12052 W NORTHERN AVE in EL MIRAGE, AZ)
(Resource Conservation and Recovery Act (tracking hazardous waste)) Organizations: KIEWET WESTERN CO (CONTACT/OPERATOR)
, KIEWIT WESTERN CO (CONTACT/OWNER)
CALMAT COMPANIES (14521 N 115TH AVE in EL MIRAGE, AZ)
Conditionally Exempt Small Quantity Generators, less than 100 kg/month of hazardous waste (Resource Conservation and Recovery Act (tracking hazardous waste)) - notification Business NAICS classification: CONSTRUCTION SAND AND GRAVEL MINING.; ASPHALT PAVING MIXTURE AND BLOCK MANUFACTURING.
HAULMARK INDUSTRIES INC. (8230 N EL MIRAGE AVE in EL MIRAGE, AZ)
Conditionally Exempt Small Quantity Generators, less than 100 kg/month of hazardous waste (Resource Conservation and Recovery Act (tracking hazardous waste)) - notification TRI REPORTER (Tracking of toxic chemicals releasing facilities) Business SIC classification: TRUCK TRAILERS Organizations: L MICHAEL ARNOLD (CONTACT/OWNER)
Alternative names: HAULMARK INDUSTRIES INC AZ
CONTECH CONSTRUCTION PRODUCTS (8260 N EL MIRAGE RD in EL MIRAGE, AZ)
Conditionally Exempt Small Quantity Generators, less than 100 kg/month of hazardous waste (Resource Conservation and Recovery Act (tracking hazardous waste)) Business NAICS classification: SHEET METAL WORK MANUFACTURING. Organizations: CONTECH CONSTRUCTION PRODUCTS INC (CONTACT/OWNER)
EL MIRAGE CRLF (SOUTH SIDE OF AZ 93 AND AGUA F in EL MIRAGE, AZ)
CRITERIA AND HAZARDOUS AIR POLLUTANT INVENTORY (Inventory of air pollution sources) Business SIC classification: REFUSE SYSTEMS Business NAICS classification: SOLID WASTE LANDFILL.
Housing units lacking complete plumbing facilities: 0.5% Housing units lacking complete kitchen facilities: 0.5%
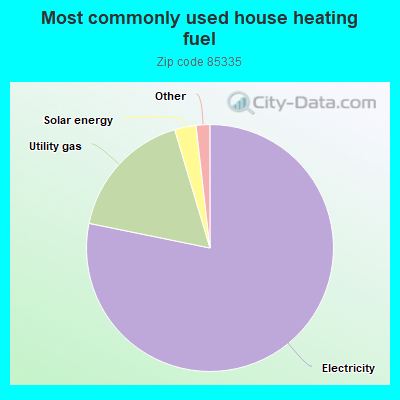
78.2%Electricity
17.2%Utility gas
2.8%Solar energy
0.8%No fuel used
0.6%Bottled, tank, or LP gas
Population in 1990: 5,234. Population change in the 1990s: +2,442 (+46.7%).
Place of birth for U.S.-born residents:
This state: 16,163
Northeast: 1,591
Midwest: 3,636
South: 2,646
West: 6,209
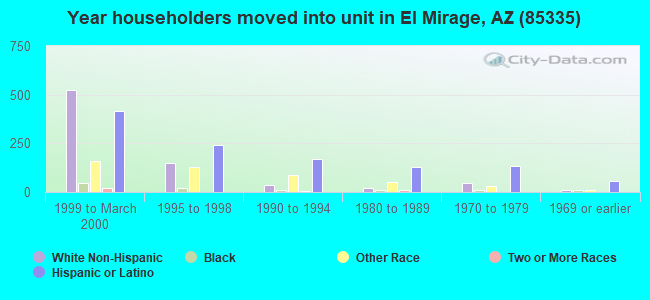
41% of the 85335 zip code residents lived in the same house 5 years ago. Out of people who lived in different houses, 77% lived in this county. Out of people who lived in different counties, 50% lived in Arizona.
92% of the 85335 zip code residents lived in the same house 1 year ago. Out of people who lived in different houses, 72% moved from this county. Out of people who lived in different houses, 4% moved from different county within same state. Out of people who lived in different houses, 23% moved from different state. Out of people who lived in different houses, 5% moved from abroad.
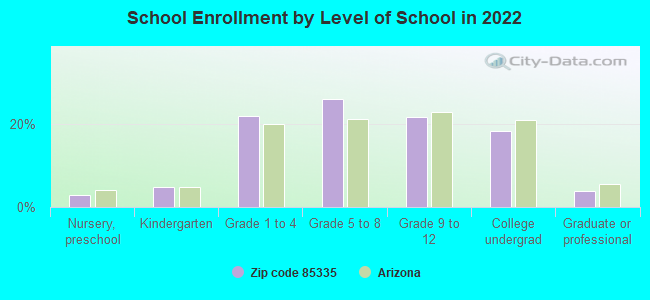
Private vs. public school enrollment:
Students in private schools in grades 1 to 8 (elementary and middle school): 416
Here:
9.2%
Arizona:
10.4%
Students in private schools in grades 9 to 12 (high school): 151
Here:
7.3%
Arizona:
8.8%
Students in private undergraduate colleges: 278
Here:
16.0%
Arizona:
13.1%
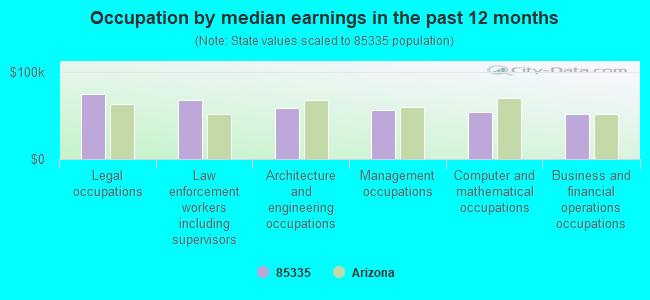
Occupation by median earnings in the past 12 months ($)
74,861Legal occupations
67,342Law enforcement workers including supervisors
58,149Architecture and engineering occupations
55,728Management occupations
54,233Computer and mathematical occupations
51,996Business and financial operations occupations
Companies with federal contracts located in this zip code:
BUNNEY'S, INC (14521 N 115 AVE in EL MIRAGE, AZ; small business) 50 employees, $4000000 revenue. Woman Owned Business
$120,000 with Federal Highway Administration for Construction of Structures and Facilities -- Highways, Roads, Streets, Bridges, and Railways (includes resurfacing). Signed on 2000-04-15. Completion date: 2000-07-15.
LARUE, CHERYL (11787 W ASTER DR in EL MIRAGE, AZ; small business)
$3,972 with Air Force for Maintenance, Repair and Rebuilding of Equipment -- Construction and Building Materials. Signed on 2005-05-05. Completion date: 2005-06-01.
Top industries in this zip code by the number of employees in 2005:
Accommodation and Food Services: Food Service Contractors (100-249 employees: 1 establishment)
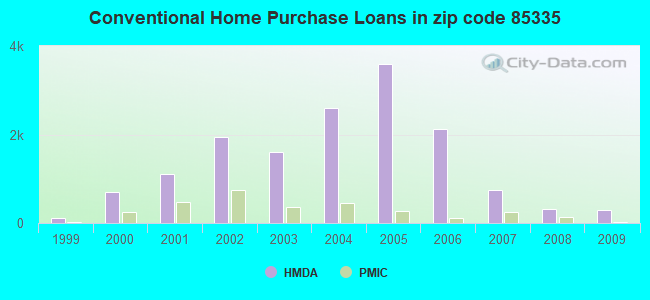
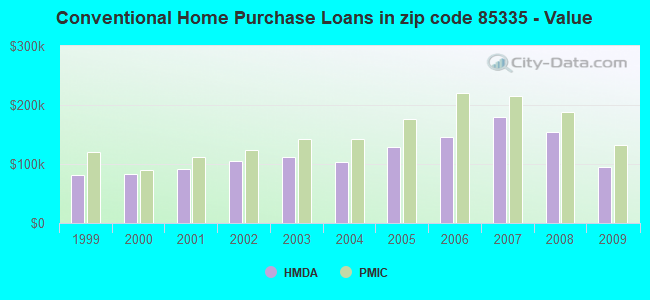
Detailed PMIC statistics for the following Tracts:0609.00
, 0610.06
2005 - 2018 National Fire Incident Reporting System (NFIRS) incidents
Based on the data from the years 2005 - 2018 the average number of fires per year is 50. The highest number of reported fires - 169 took place in 2018, and the least - 2 in 2009. The data has an increasing trend.
When looking into fire subcategories, the most incidents belonged to: Structure Fires (44.4%), and Outside Fires (33.3%).
Fire incident types reported to NFIRS in Zip Code 85335


 Nearest zip codes: 85363, 85379, 85351, 85307, 85374, 85309.


 Based on the data from the years 2005 - 2018 the average number of fires per year is 50. The highest number of reported fires - 169 took place in 2018, and the least - 2 in 2009. The data has an increasing trend.
 When looking into fire subcategories, the most incidents belonged to: Structure Fires (44.4%), and Outside Fires (33.3%).