Estimated zip code population in 2022: 42,903 Zip code population in 2010: 47,146 Zip code population in 2000: 28,163
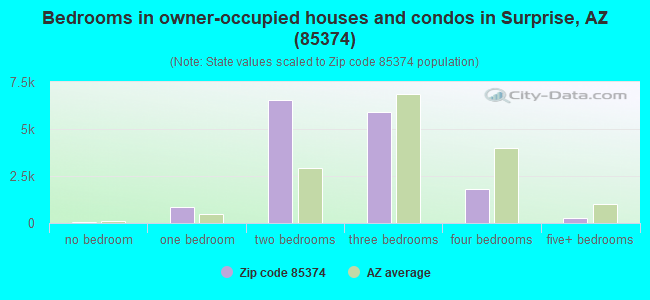
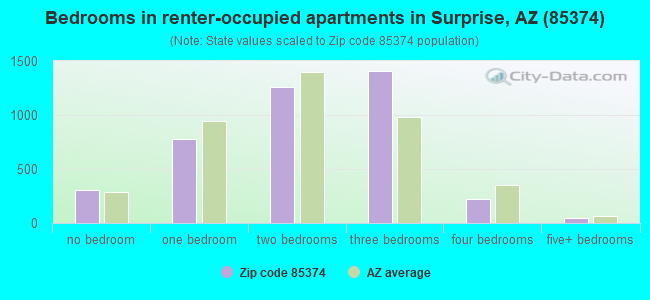
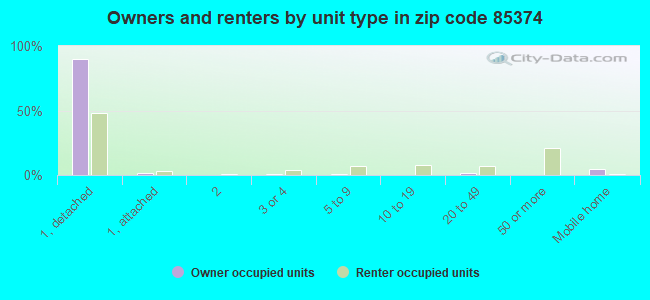
Houses and condos: 22,650 Renter-occupied apartments: 4,018
% of renters here:
21%
State:
33%
March 2022 cost of living index in zip code 85374: 101.5 (near average, U.S. average is 100)
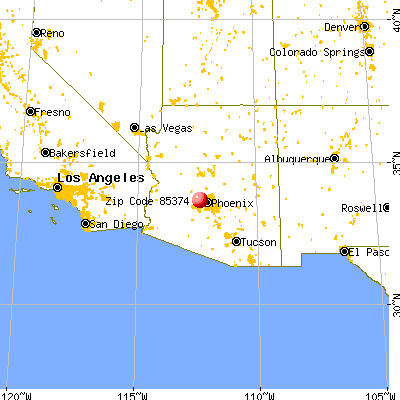
Land area: 16.2 sq. mi. Water area: 0.0 sq. mi.
Population density: 2,641 people per square mile
(average).
OSM Map
General Map
Google Map
MSN Map
OSM Map
General Map
Google Map
MSN Map
OSM Map
General Map
Google Map
MSN Map
OSM Map
General Map
Google Map
MSN Map
Please wait while loading the map...
Real estate property taxes paid for housing units in 2022:
This zip code:
0.4% ($1,649)
Arizona:
0.4% ($1,786)
Median real estate property taxes paid for housing units with mortgages in 2022: $1,528 (0.4%) Median real estate property taxes paid for housing units with no mortgage in 2022: $1,784 (0.5%)
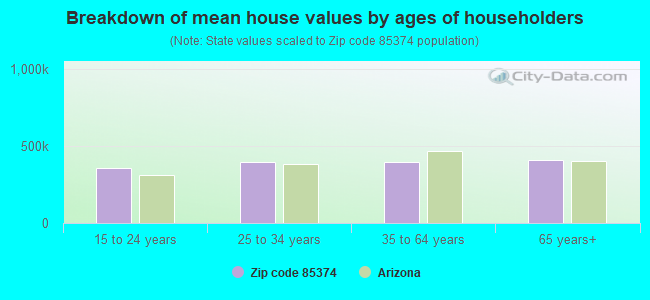
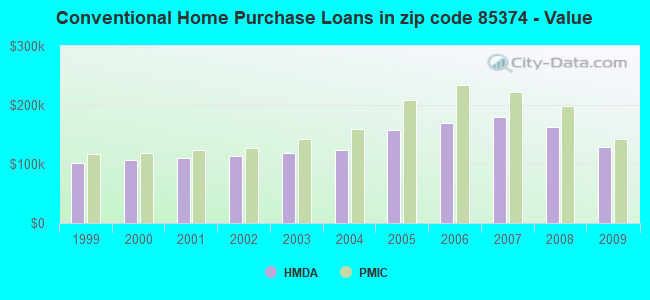
Estimated median house/condo value in 2022: $398,664
85374:
$398,664
Arizona:
$402,800
According to our research of Arizona and other state lists, there were 20 registered sex offenders living in 85374 zip code as of April 27, 2024. The ratio of all residents to sex offenders in zip code 85374 is 2,335 to 1. The ratio of registered sex offenders to all residents in this zip code is much lower than the state average.
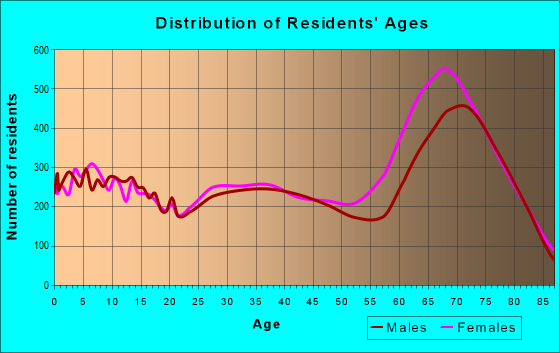
Median resident age:
This zip code:
58.5 years
Arizona median age:
38.8 years
Average household size:
This zip code:
2.2 people
Arizona:
2.5 people
Averages for the 2020 tax year for zip code 85374, filed in 2021:
Average Adjusted Gross Income (AGI) in 2020: $62,988 (Individual Income Tax Returns)
Here:
$62,988
State:
$73,499
Salary/wage: $49,544 (reported on 60.4% of returns)
Here:
$49,544
State:
$59,499
(% of AGI for various income ranges: 965.6% for AGIs below $25k, 3121.0% for AGIs $25k-50k, 5221.5% for AGIs $50k-75k, 7204.9% for AGIs $75k-100k, 12860.1% for AGIs $100k-200k, 38585.0% for AGIs over 200k)
Taxable interest for individuals: $2,085 (reported on 36.8% of returns)
This zip code:
$2,085
Arizona:
$2,325
(% of AGI for various income ranges: 40.3% for AGIs below $25k, 46.2% for AGIs $25k-50k, 115.0% for AGIs $50k-75k, 140.6% for AGIs $75k-100k, 291.7% for AGIs $100k-200k, 2577.1% for AGIs over 200k)
Ordinary dividends: $7,196 (reported on 26.5% of returns)
Here:
$7,196
State:
$8,711
(% of AGI for various income ranges: 78.1% for AGIs below $25k, 88.5% for AGIs $25k-50k, 198.0% for AGIs $50k-75k, 367.6% for AGIs $75k-100k, 823.5% for AGIs $100k-200k, 7876.4% for AGIs over 200k)
Net capital gain/loss in AGI: +$14,823 (reported on 24.7% of returns)
Here:
+$14,823
State:
+$31,332
(% of AGI for various income ranges: 12.3% for AGIs below $25k, 46.2% for AGIs $25k-50k, 155.4% for AGIs $50k-75k, 357.1% for AGIs $75k-100k, 1395.0% for AGIs $100k-200k, 30901.4% for AGIs over 200k)
Profit/loss from business: +$10,472 (reported on 11.7% of returns)
Here:
+$10,472
State:
+$13,214
(% of AGI for various income ranges: 101.0% for AGIs below $25k, 130.4% for AGIs $25k-50k, 155.1% for AGIs $50k-75k, 219.2% for AGIs $75k-100k, 375.0% for AGIs $100k-200k, 3022.9% for AGIs over 200k)
Taxable individual retirement arrangement distribution: $21,742 (reported on 23.0% of returns)
85374:
$21,742
Arizona:
$23,364
(% of AGI for various income ranges: 173.1% for AGIs below $25k, 303.7% for AGIs $25k-50k, 642.8% for AGIs $50k-75k, 1226.7% for AGIs $75k-100k, 2428.2% for AGIs $100k-200k, 12372.1% for AGIs over 200k)
Self-employed (Keogh) retirement plans: $17,550 (reported on 0.2% of returns)
85374:
$17,550
Arizona:
$26,938
(% of AGI for various income ranges: 49.8% for AGIs $100k-200k)
Total itemized deductions: $32,478 (reported on 8.6% of returns)
Here:
$32,478
State:
$36,308
(% of AGI for various income ranges: 110.7% for AGIs below $25k, 198.6% for AGIs $25k-50k, 409.9% for AGIs $50k-75k, 595.9% for AGIs $75k-100k, 1207.4% for AGIs $100k-200k, 7242.1% for AGIs over 200k)
Charity contributions: $6,703 (reported on 7.3% of returns)
Here:
$6,703
State:
$11,955
(% of AGI for various income ranges: 7.2% for AGIs below $25k, 23.2% for AGIs $25k-50k, 56.9% for AGIs $50k-75k, 95.8% for AGIs $75k-100k, 271.1% for AGIs $100k-200k, 1613.6% for AGIs over 200k)
Taxes paid: $5,364 (reported on 8.5% of returns)
85374:
$5,364
State:
$6,820
(% of AGI for various income ranges: 11.9% for AGIs below $25k, 26.4% for AGIs $25k-50k, 61.4% for AGIs $50k-75k, 105.2% for AGIs $75k-100k, 236.4% for AGIs $100k-200k, 1112.1% for AGIs over 200k)
Earned income credit: $2,206 (reported on 9.9% of returns)
Here:
$2,206
State:
$2,383
(% of AGI for various income ranges: 66.3% for AGIs below $25k, 51.4% for AGIs $25k-50k, 1.2% for AGIs $50k-75k)
Percentage of individuals using paid preparers for their 2020 taxes: 92.0%
Here:
92%
State:
93%
(% for various income ranges: 90.6% for AGIs below $25k, 92.9% for AGIs $25k-50k, 91.6% for AGIs $50k-75k, 92.0% for AGIs $75k-100k, 92.9% for AGIs $100k-200k, 94.5% for AGIs over 200k)
Averages for the 2012 tax year for zip code 85374, filed in 2013:
Average Adjusted Gross Income (AGI) in 2012: $52,987 (Individual Income Tax Returns)
Here:
$52,987
State:
$57,644
Salary/wage: $40,506 (reported on 63.4% of returns)
Here:
$40,506
State:
$47,932
(% of AGI for various income ranges: 56.4% for AGIs below $25k, 59.1% for AGIs $25k-50k, 50.9% for AGIs $50k-75k, 49.0% for AGIs $75k-100k, 44.1% for AGIs $100k-200k, 27.1% for AGIs over 200k)
Taxable interest for individuals: $1,832 (reported on 41.2% of returns)
This zip code:
$1,832
Arizona:
$2,064
(% of AGI for various income ranges: 2.2% for AGIs below $25k, 1.1% for AGIs $25k-50k, 1.4% for AGIs $50k-75k, 1.1% for AGIs $75k-100k, 1.5% for AGIs $100k-200k, 1.9% for AGIs over 200k)
Ordinary dividends: $6,220 (reported on 28.2% of returns)
Here:
$6,220
State:
$7,268
(% of AGI for various income ranges: 3.9% for AGIs below $25k, 2.2% for AGIs $25k-50k, 2.2% for AGIs $50k-75k, 2.4% for AGIs $75k-100k, 3.3% for AGIs $100k-200k, 8.8% for AGIs over 200k)
Net capital gain/loss in AGI: +$5,831 (reported on 24.2% of returns)
Here:
+$5,831
State:
+$15,530
(% of AGI for various income ranges: 0.2% for AGIs $25k-50k, 0.5% for AGIs $50k-75k, 0.8% for AGIs $75k-100k, 2.9% for AGIs $100k-200k, 17.8% for AGIs over 200k)
Profit/loss from business: +$9,472 (reported on 12.0% of returns)
Here:
+$9,472
State:
+$12,323
(% of AGI for various income ranges: 5.7% for AGIs below $25k, 2.3% for AGIs $25k-50k, 1.3% for AGIs $50k-75k, 1.2% for AGIs $75k-100k, 1.6% for AGIs $100k-200k, 3.8% for AGIs over 200k)
Taxable individual retirement arrangement distribution: $18,384 (reported on 26.9% of returns)
85374:
$18,384
Arizona:
$18,280
(% of AGI for various income ranges: 10.3% for AGIs below $25k, 7.5% for AGIs $25k-50k, 7.5% for AGIs $50k-75k, 9.1% for AGIs $75k-100k, 10.9% for AGIs $100k-200k, 12.1% for AGIs over 200k)
Self-employment retirement plans: $17,660 (reported on 0.3% of returns)
85374:
$17,660
Arizona:
$22,154
Total itemized deductions: $20,093 (26% of AGI, reported on 38.0% of returns)
Here:
$20,093
State:
$23,651
Here:
25.9% of AGI
State:
20.6% of AGI
(% of AGI for various income ranges: 19.8% for AGIs below $25k, 15.3% for AGIs $25k-50k, 13.8% for AGIs $50k-75k, 13.6% for AGIs $75k-100k, 13.9% for AGIs $100k-200k, 12.3% for AGIs over 200k)
Charity contributions: $3,056 (reported on 32.7% of returns)
Here:
$3,056
State:
$4,114
(% of AGI for various income ranges: 1.5% for AGIs below $25k, 1.5% for AGIs $25k-50k, 1.6% for AGIs $50k-75k, 1.8% for AGIs $75k-100k, 2.2% for AGIs $100k-200k, 2.8% for AGIs over 200k)
Taxes paid: $4,714 (reported on 37.9% of returns)
85374:
$4,714
State:
$6,509
(% of AGI for various income ranges: 3.2% for AGIs below $25k, 2.9% for AGIs $25k-50k, 2.9% for AGIs $50k-75k, 3.2% for AGIs $75k-100k, 3.9% for AGIs $100k-200k, 4.4% for AGIs over 200k)
Earned income credit: $2,244 (reported on 13.2% of returns)
Here:
$2,244
State:
$2,432
(% of AGI for various income ranges: 4.8% for AGIs below $25k, 0.9% for AGIs $25k-50k)
Percentage of individuals using paid preparers for their 2012 taxes: 52.2%
Here:
52%
State:
52%
(% for various income ranges: 49.2% for AGIs below $25k, 49.2% for AGIs $25k-50k, 52.9% for AGIs $50k-75k, 54.2% for AGIs $75k-100k, 62.1% for AGIs $100k-200k, 81.8% for AGIs over 200k)
Averages for the 2004 tax year for zip code 85374, filed in 2005:
Average Adjusted Gross Income (AGI) in 2004: $46,432 (Individual Income Tax Returns)
Here:
$46,432
State:
$50,097
Salary/wage: $39,260 (reported on 72.3% of returns)
Here:
$39,260
State:
$42,146
(% of AGI for various income ranges: 216.7% for AGIs below $10k, 58.3% for AGIs $10k-25k, 66.5% for AGIs $25k-50k, 64.9% for AGIs $50k-75k, 63.7% for AGIs $75k-100k, 46.9% for AGIs over 100k)
Taxable interest for individuals: $2,129 (reported on 51.6% of returns)
This zip code:
$2,129
Arizona:
$2,374
(% of AGI for various income ranges: 31.5% for AGIs below $10k, 4.3% for AGIs $10k-25k, 2.2% for AGIs $25k-50k, 1.7% for AGIs $50k-75k, 1.8% for AGIs $75k-100k, 2.6% for AGIs over 100k)
Taxable dividends: $3,280 (reported on 31.1% of returns)
Here:
$3,280
State:
$3,888
(% of AGI for various income ranges: 27.2% for AGIs below $10k, 3.5% for AGIs $10k-25k, 1.8% for AGIs $25k-50k, 1.6% for AGIs $50k-75k, 1.6% for AGIs $75k-100k, 2.9% for AGIs over 100k)
Net capital gain/loss: +$8,404 (reported on 25.4% of returns)
Here:
+$8,404
State:
+$17,569
(% of AGI for various income ranges: -8.7% for AGIs below $10k, 1.5% for AGIs $10k-25k, 0.6% for AGIs $25k-50k, 1.2% for AGIs $50k-75k, 2.1% for AGIs $75k-100k, 16.4% for AGIs over 100k)
Profit/loss from business: +$7,207 (reported on 12.7% of returns)
Here:
+$7,207
State:
+$11,088
(% of AGI for various income ranges: 0.5% for AGIs below $10k, 3.9% for AGIs $10k-25k, 1.6% for AGIs $25k-50k, 1.3% for AGIs $50k-75k, 1.8% for AGIs $75k-100k, 2.6% for AGIs over 100k)
IRA payment deduction: $3,248 (reported on 2.5% of returns)
85374:
$3,248
Arizona:
$3,023
(% of AGI for various income ranges: 0.9% for AGIs below $10k, 0.3% for AGIs $10k-25k, 0.2% for AGIs $25k-50k, 0.2% for AGIs $50k-75k, 0.1% for AGIs $75k-100k, 0.1% for AGIs over 100k)
Self-employed pension: $14,110 (reported on 0.4% of returns)
Here:
$14,110
Arizona:
$15,785
(% of AGI for various income ranges: 0.1% for AGIs $25k-50k, 0.0% for AGIs $50k-75k, 0.1% for AGIs $75k-100k, 0.3% for AGIs over 100k)
Total itemized deductions: $16,476 (26% of AGI, reported on 50.4% of returns)
Here:
$16,476
State:
$19,781
Here:
26.5% of AGI
State:
21.8% of AGI
(% of AGI for various income ranges: 124.6% for AGIs below $10k, 20.5% for AGIs $10k-25k, 19.1% for AGIs $25k-50k, 18.0% for AGIs $50k-75k, 17.6% for AGIs $75k-100k, 13.8% for AGIs over 100k)
Charity contributions deductions: $2,233 (3% of AGI, reported on 44.6% of returns)
Here:
$2,233
State:
$3,389
Here:
3.5% of AGI
State:
3.5% of AGI
(% of AGI for various income ranges: 6.1% for AGIs below $10k, 1.8% for AGIs $10k-25k, 2.0% for AGIs $25k-50k, 2.2% for AGIs $50k-75k, 2.2% for AGIs $75k-100k, 2.3% for AGIs over 100k)
Total tax: $5,421 (reported on 78.8% of returns)
85374:
$5,421
State:
$8,323
(% of AGI for various income ranges: 6.4% for AGIs below $10k, 3.3% for AGIs $10k-25k, 6.0% for AGIs $25k-50k, 8.2% for AGIs $50k-75k, 10.2% for AGIs $75k-100k, 15.2% for AGIs over 100k)
Earned income credit: $1,670 (reported on 9.8% of returns)
Here:
$1,670
State:
$1,786
Percentage of individuals using paid preparers for their 2004 taxes: 61.6%
Here:
62%
State:
60%
(% for various income ranges: 58.4% for AGIs below $10k, 62.7% for AGIs $10k-25k, 60.4% for AGIs $25k-50k, 60.5% for AGIs $50k-75k, 62.3% for AGIs $75k-100k, 70.1% for AGIs over 100k)
Likely homosexual households (counted as self-reported same-sex unmarried-partner households)
Lesbian couples: 0.3% of all households
Gay men: 0.1% of all households
Household received Food Stamps/SNAP in the past 12 months: 805 Household did not receive Food Stamps/SNAP in the past 12 months: 18,575
Women who had a birth in the past 12 months: 480 (438 now married, 50 unmarried) Women who did not have a birth in the past 12 months: 6,137 (2,625 now married, 3,506 unmarried)
Housing units in zip code 85374 with a mortgage: 8,189 (414 second mortgage, 369 both second mortgage and home equity loan) Houses without a mortgage: 72
Median monthly owner costs for units with a mortgage: $1,418 Median monthly owner costs for units without a mortgage: $438
Residents with income below the poverty level in 2022:
This zip code:
8.4%
Whole state:
12.5%
Residents with income below 50% of the poverty level in 2022:
This zip code:
2.9%
Whole state:
6.0%
Median number of rooms in houses and condos:
Here:
5.6
State:
6.0
Median number of rooms in apartments:
Here:
4.4
State:
4.1
Notable locations in this zip code not listed on our city pages
Notable locations in zip code 85374: Beardsley Substation (A), Calderwood Station (B), Maricopa County Municipal Water Conservation District Number One (C), Maricopa County Superior Court Northwest Regional Center (D), West Valley Art Museum (E), Maricopa County Library District Northwest Regional Branch (F), Maricopa County Library District Hollyhock Branch (G), Surprise Town Hall (H), Surprise Fire Department Station 306 (I), Surprise Fire Department Station 305 (J), Surprise Fire Department Station 302 (K), Surprise Fire Department Station 301 (L), Surprise Police Department (M). Display/hide their locations on the map
Churches in zip code 85374 include: Grand Community Baptist Church (A), Grace Community Church (B), Gideon Missionary Baptist Church (C), First Country Baptist Church (D), Surprise Unitarian Universalist Church (E), Spirit of Grace Lutheran Church (F), Shepherd of the Valley Evangelical Lutheran Church (G), Radiant Church (H), Pan de Vida Lutheran Church (I). Display/hide their locations on the map
3,645 married couples with children.
1,919 single-parent households (325 men, 1,594 women).
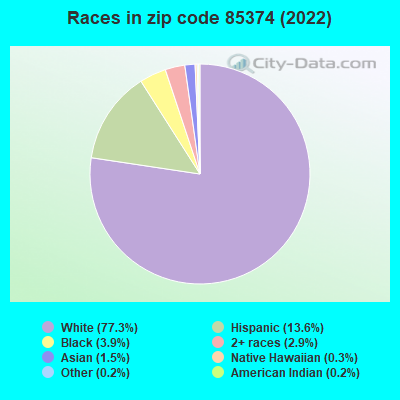
91.3% of residents of 85374 zip code speak English at home.
6.4% of residents speak Spanish at home (62% very well, 28% well, 10% not well).
1.8% of residents speak other Indo-European language at home (72% very well, 17% well, 9% not well, 1% not at all).
1.2% of residents speak Asian or Pacific Island language at home (65% very well, 30% well, 5% not at all).
0.5% of residents speak other language at home (80% very well, 20% well).
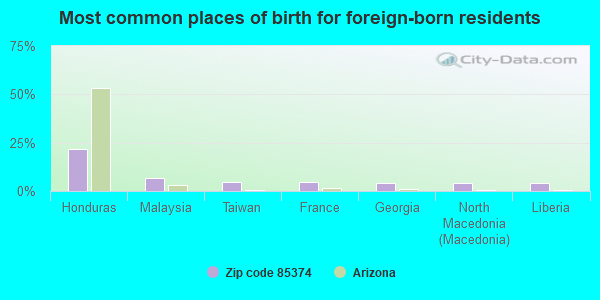
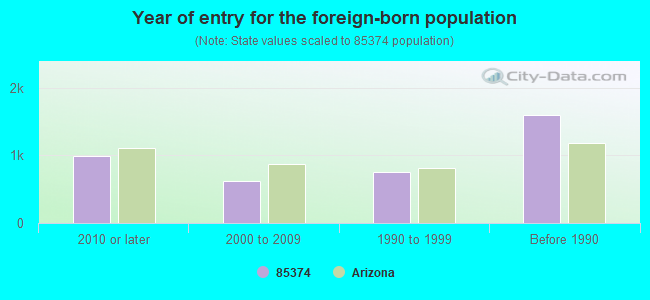
Foreign born population: 3,389 (7.9%) (65.5% of them are naturalized citizens)
(Resource Conservation and Recovery Act (tracking hazardous waste))
AUTO ZONE #2726 (13355 W GRAND AVE in SURPRISE, AZ)
(Resource Conservation and Recovery Act (tracking hazardous waste))
FRAZEE PAINT AND WALLCOVERING #102 (13706 W BELL RD STE 10 in SURPRISE, AZ)
Conditionally Exempt Small Quantity Generators, less than 100 kg/month of hazardous waste (Resource Conservation and Recovery Act (tracking hazardous waste)) Organizations: SURPRISE TOWN CENTER LC (CONTACT/OWNER)
HOME DEPOT USA INC HD 0483 (13760 W BELL RD in SURPRISE, AZ)
Small Quantity Generators, between 100 kg and 1000 kg of hazardous waste/month (Resource Conservation and Recovery Act (tracking hazardous waste)) Alternative names: HOME DEPOT 0483
NORTHWEST SERVICES FACILITY (12975 W BELL RD in SURPRISE, AZ)
(Resource Conservation and Recovery Act (tracking hazardous waste))
DYSART/BELL SERVICE CENTER MARICOPA CNT (16821 N DYSART RD in SURPRISE, AZ)
Conditionally Exempt Small Quantity Generators, less than 100 kg/month of hazardous waste (Resource Conservation and Recovery Act (tracking hazardous waste)) Business NAICS classification: AIR TRAFFIC CONTROL. Organizations: MARICOPA CO EQUIP SRVCS (CONTACT/OWNER)
Alternative names: MARICOPA COUNTY NORTH VALLEY SVC STN
FIRESTONE STORE 26CE (11541 W BELL RD in SURPRISE, AZ)
Conditionally Exempt Small Quantity Generators, less than 100 kg/month of hazardous waste (Resource Conservation and Recovery Act (tracking hazardous waste)) Business NAICS classification: GENERAL AUTOMOTIVE REPAIR.; ALL OTHER AUTOMOTIVE REPAIR AND MAINTENANCE. Organizations: BRIDGESTONE FIRESTONE INC (CONTACT/OWNER)
HANSON AGGREGATES ARIZONA INC (21801 N 115TH AVE in SUN CITY, AZ)
TRI REPORTER (Tracking of toxic chemicals releasing facilities) Business SIC classification: READY-MIXED CONCRETE
Housing units lacking complete plumbing facilities: 0.0% Housing units lacking complete kitchen facilities: 1.2%
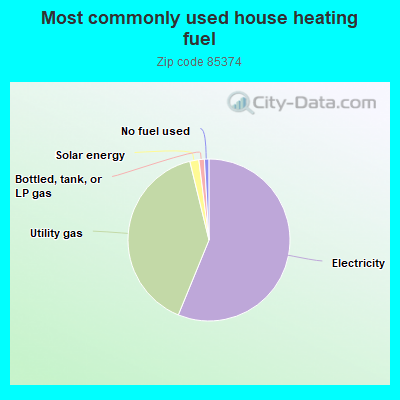
56.2%Electricity
40.0%Utility gas
1.8%Solar energy
1.1%Bottled, tank, or LP gas
0.9%No fuel used
Population in 1990: 5,042. Population change in the 1990s: +23,121 (+458.6%).
Place of birth for U.S.-born residents:
This state: 9,526
Northeast: 4,772
Midwest: 11,686
South: 3,362
West: 9,394
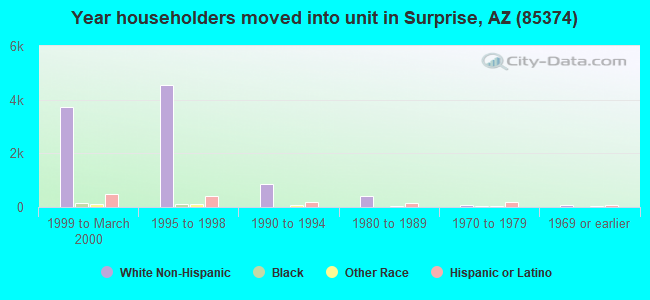
23% of the 85374 zip code residents lived in the same house 5 years ago. Out of people who lived in different houses, 47% lived in this county. Out of people who lived in different counties, 50% lived in Arizona.
87% of the 85374 zip code residents lived in the same house 1 year ago. Out of people who lived in different houses, 51% moved from this county. Out of people who lived in different houses, 2% moved from different county within same state. Out of people who lived in different houses, 42% moved from different state. Out of people who lived in different houses, 5% moved from abroad.
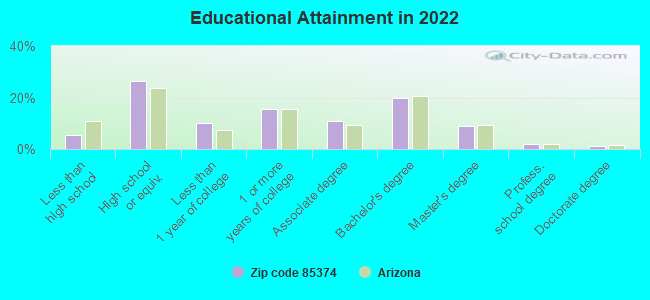
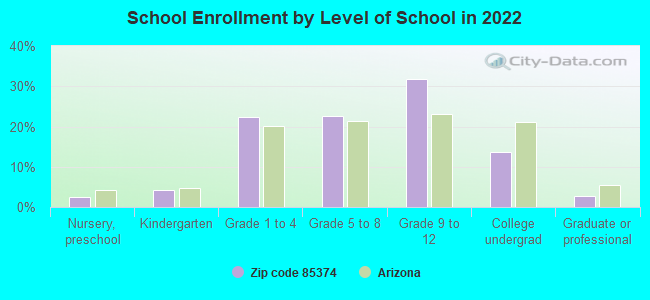
Private vs. public school enrollment:
Students in private schools in grades 1 to 8 (elementary and middle school): 145
Here:
5.4%
Arizona:
10.4%
Students in private schools in grades 9 to 12 (high school): 144
Here:
7.7%
Arizona:
8.8%
Students in private undergraduate colleges: 222
Here:
27.5%
Arizona:
13.1%
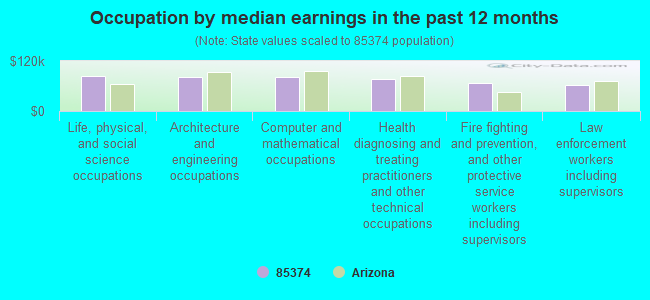
Occupation by median earnings in the past 12 months ($)
84,038Life, physical, and social science occupations
81,850Architecture and engineering occupations
81,009Computer and mathematical occupations
76,206Health diagnosing and treating practitioners and other technical occupations
67,789Fire fighting and prevention, and other protective service workers including supervisors
62,673Law enforcement workers including supervisors
Companies with federal contracts located in this zip code (SURPRISE, AZ):
HORNER GROUP LLC (12301 WEST BELL ROAD SUITE; small business) : $289,333 in 10 contractsfrom 2002 to 2005
Contracts for Motorcycles, Motor Scooters, and Bicycles, Vehicular Cab, Body, and Frame Structural Components, Miscellaneous Vehicular Components by Army, Air Force, Navy Signed by year:2000: $0; 2001: $0; 2002: $228,858; 2003: $0; 2004: $31,569; 2005: $28,906; 2006: $0.
Biggest contracts:
$101,590 with Army for Motorcycles, Motor Scooters, and Bicycles. Taking place in ND. Signed on 2002-05-28. Completion date: 2002-07-24.
$51,101 with Army for Motorcycles, Motor Scooters, and Bicycles. Signed on 2002-06-29. Completion date: 2002-09-16.
$30,575 with Air Force for Motorcycles, Motor Scooters, and Bicycles. Signed on 2002-04-02. Completion date: 2002-06-18.
$26,917, same as above.Signed on 2005-09-18. Completion date: 2005-11-15.
R AND K ENTERPRISES, LLC (15668 WEST SAGUARO LN; small business) : $191,880 in 2 contractsfrom 2004 to 2005
$98,280 with Air Force for General Health Care Services. Signed on 2005-09-28. Completion date: 2006-09-29.
$93,600, same as above.Signed on 2004-09-27. Completion date: 2005-09-29.
CARESCAPE, INC (13415 W WESTGATE DR #101; small business) : $79,200 in 2 contractsfrom 1999 to 2000
$42,000 with Air Force for Landscaping/Groundskeeping Services. Signed on 2000-10-27. Completion date: 2001-10-17.
$37,200, same as above.Signed on 1999-10-01. Completion date: 2000-09-30.
67TH AVENUE & ORANGEWOOD MOTOR (11449 W BELL RD; small business) : $52,599 in 2 contractsin 2005
$46,599 with Air Force for Maintenance, Repair and Rebuilding of Equipment -- Ground Effect Vehicles, Motor Vehicles, Trailers, and Cycles. Signed on 2005-07-07. Completion date: 2005-09-30.
$6,000, same as above.Signed on 2005-07-28. Completion date: 2005-09-30.
RASH, KEVIN D (16252 N LASSO DR; small business)
$14,560 with Air Force for Chaplain Services. Signed on 2005-10-01. Completion date: 2006-09-30.
SUN CITY AWNINGS & PATIOS INC (12669 WEST GRAND AVE; small business)
$11,612 with Air Force for Construction of Structures and Facilities -- Other Non-Building Facilities. Signed on 2002-07-15. Completion date: 2002-08-14.
Top industries in this zip code by the number of employees in 2005:
2005 - 2018 National Fire Incident Reporting System (NFIRS) incidents
According to the data from the years 2005 - 2018 the average number of fire incidents per year is 112. The highest number of reported fires - 209 took place in 2008, and the least - 0 in 2009. The data has a growing trend.
When looking into fire subcategories, the most reports belonged to: Outside Fires (42.8%), and Structure Fires (32.3%).
Fire incident types reported to NFIRS in Zip Code 85374


 Nearest zip codes: 85379, 85375, 85388, 85335, 85373, 85363.
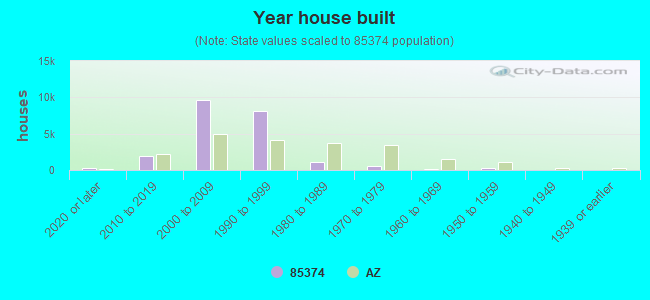


 According to the data from the years 2005 - 2018 the average number of fire incidents per year is 112. The highest number of reported fires - 209 took place in 2008, and the least - 0 in 2009. The data has a growing trend.
 When looking into fire subcategories, the most reports belonged to: Outside Fires (42.8%), and Structure Fires (32.3%).