Estimated zip code population in 2022: 21,234 Zip code population in 2010: 17,356 Zip code population in 2000: 12,643
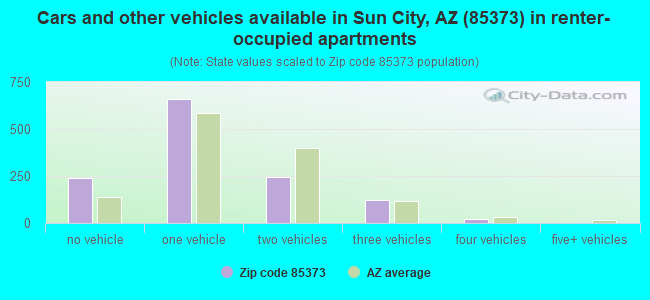
Houses and condos: 11,023 Renter-occupied apartments: 1,303
% of renters here:
13%
State:
33%
March 2022 cost of living index in zip code 85373: 102.0 (near average, U.S. average is 100)
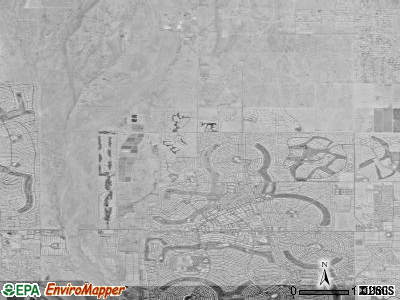
Land area: 11.4 sq. mi. Water area: 0.0 sq. mi.
Population density: 1,865 people per square mile
(low).
OSM Map
General Map
Google Map
MSN Map
OSM Map
General Map
Google Map
MSN Map
OSM Map
General Map
Google Map
MSN Map
OSM Map
General Map
Google Map
MSN Map
Please wait while loading the map...
Real estate property taxes paid for housing units in 2022:
This zip code:
0.4% ($1,403)
Arizona:
0.4% ($1,786)
Median real estate property taxes paid for housing units with mortgages in 2022: $1,585 (0.4%) Median real estate property taxes paid for housing units with no mortgage in 2022: $1,253 (0.4%)
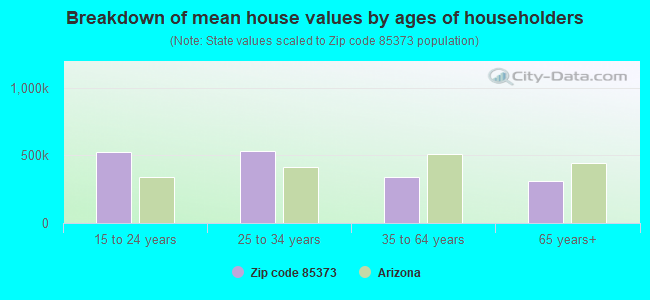
Estimated median house/condo value in 2022: $364,450
85373:
$364,450
Arizona:
$402,800
According to our research of Arizona and other state lists, there were 14 registered sex offenders living in 85373 zip code as of April 27, 2024. The ratio of all residents to sex offenders in zip code 85373 is 1,383 to 1. The ratio of registered sex offenders to all residents in this zip code is lower than the state average.
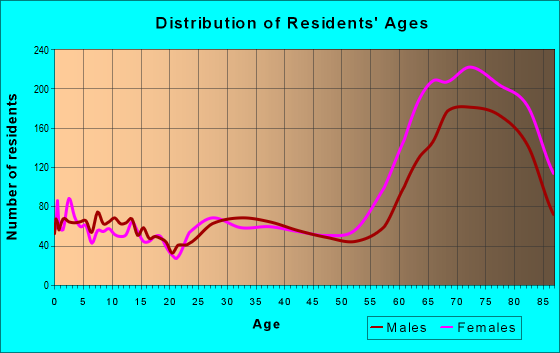
Median resident age:
This zip code:
65.0 years
Arizona median age:
38.8 years
Average household size:
This zip code:
2.1 people
Arizona:
2.5 people
Averages for the 2020 tax year for zip code 85373, filed in 2021:
Average Adjusted Gross Income (AGI) in 2020: $61,335 (Individual Income Tax Returns)
Here:
$61,335
State:
$73,499
Salary/wage: $57,843 (reported on 53.8% of returns)
Here:
$57,843
State:
$59,499
(% of AGI for various income ranges: 726.4% for AGIs below $25k, 2474.8% for AGIs $25k-50k, 4805.6% for AGIs $50k-75k, 7646.7% for AGIs $75k-100k, 15749.6% for AGIs $100k-200k, 48558.6% for AGIs over 200k)
Taxable interest for individuals: $1,462 (reported on 42.8% of returns)
This zip code:
$1,462
Arizona:
$2,325
(% of AGI for various income ranges: 60.4% for AGIs below $25k, 71.2% for AGIs $25k-50k, 92.6% for AGIs $50k-75k, 149.6% for AGIs $75k-100k, 210.4% for AGIs $100k-200k, 615.7% for AGIs over 200k)
Ordinary dividends: $5,008 (reported on 28.9% of returns)
Here:
$5,008
State:
$8,711
(% of AGI for various income ranges: 89.1% for AGIs below $25k, 141.0% for AGIs $25k-50k, 213.4% for AGIs $50k-75k, 333.2% for AGIs $75k-100k, 488.4% for AGIs $100k-200k, 3245.7% for AGIs over 200k)
Net capital gain/loss in AGI: +$10,915 (reported on 25.9% of returns)
Here:
+$10,915
State:
+$31,332
(% of AGI for various income ranges: 7.3% for AGIs below $25k, 77.9% for AGIs $25k-50k, 170.3% for AGIs $50k-75k, 406.1% for AGIs $75k-100k, 1170.3% for AGIs $100k-200k, 17345.7% for AGIs over 200k)
Profit/loss from business: +$10,129 (reported on 13.2% of returns)
Here:
+$10,129
State:
+$13,214
(% of AGI for various income ranges: 73.8% for AGIs below $25k, 155.1% for AGIs $25k-50k, 255.0% for AGIs $50k-75k, 216.3% for AGIs $75k-100k, 496.5% for AGIs $100k-200k, 2292.9% for AGIs over 200k)
Taxable individual retirement arrangement distribution: $16,504 (reported on 25.5% of returns)
85373:
$16,504
Arizona:
$23,364
(% of AGI for various income ranges: 264.7% for AGIs below $25k, 433.6% for AGIs $25k-50k, 715.1% for AGIs $50k-75k, 1013.9% for AGIs $75k-100k, 1501.5% for AGIs $100k-200k, 6400.0% for AGIs over 200k)
Total itemized deductions: $31,911 (reported on 9.1% of returns)
Here:
$31,911
State:
$36,308
(% of AGI for various income ranges: 139.7% for AGIs below $25k, 231.5% for AGIs $25k-50k, 444.4% for AGIs $50k-75k, 606.8% for AGIs $75k-100k, 1109.5% for AGIs $100k-200k, 7370.0% for AGIs over 200k)
Charity contributions: $9,923 (reported on 7.2% of returns)
Here:
$9,923
State:
$11,955
(% of AGI for various income ranges: 5.8% for AGIs below $25k, 30.1% for AGIs $25k-50k, 68.8% for AGIs $50k-75k, 100.9% for AGIs $75k-100k, 337.8% for AGIs $100k-200k, 3332.9% for AGIs over 200k)
Taxes paid: $5,066 (reported on 9.1% of returns)
85373:
$5,066
State:
$6,820
(% of AGI for various income ranges: 10.6% for AGIs below $25k, 25.3% for AGIs $25k-50k, 64.4% for AGIs $50k-75k, 114.9% for AGIs $75k-100k, 234.3% for AGIs $100k-200k, 997.1% for AGIs over 200k)
Earned income credit: $1,791 (reported on 5.8% of returns)
Here:
$1,791
State:
$2,383
(% of AGI for various income ranges: 30.2% for AGIs below $25k, 30.4% for AGIs $25k-50k)
Percentage of individuals using paid preparers for their 2020 taxes: 92.0%
Here:
92%
State:
93%
(% for various income ranges: 89.5% for AGIs below $25k, 93.1% for AGIs $25k-50k, 92.1% for AGIs $50k-75k, 94.0% for AGIs $75k-100k, 93.3% for AGIs $100k-200k, 95.7% for AGIs over 200k)
Averages for the 2012 tax year for zip code 85373, filed in 2013:
Average Adjusted Gross Income (AGI) in 2012: $49,992 (Individual Income Tax Returns)
Here:
$49,992
State:
$57,644
Salary/wage: $45,680 (reported on 52.9% of returns)
Here:
$45,680
State:
$47,932
(% of AGI for various income ranges: 36.1% for AGIs below $25k, 45.9% for AGIs $25k-50k, 49.0% for AGIs $50k-75k, 52.7% for AGIs $75k-100k, 55.0% for AGIs $100k-200k, 31.4% for AGIs over 200k)
Taxable interest for individuals: $1,916 (reported on 51.9% of returns)
This zip code:
$1,916
Arizona:
$2,064
(% of AGI for various income ranges: 3.9% for AGIs below $25k, 2.1% for AGIs $25k-50k, 1.7% for AGIs $50k-75k, 1.2% for AGIs $75k-100k, 1.6% for AGIs $100k-200k, 3.7% for AGIs over 200k)
Ordinary dividends: $5,454 (reported on 34.3% of returns)
Here:
$5,454
State:
$7,268
(% of AGI for various income ranges: 6.3% for AGIs below $25k, 3.5% for AGIs $25k-50k, 3.2% for AGIs $50k-75k, 3.3% for AGIs $75k-100k, 3.0% for AGIs $100k-200k, 6.9% for AGIs over 200k)
Net capital gain/loss in AGI: +$3,627 (reported on 29.2% of returns)
Here:
+$3,627
State:
+$15,530
(% of AGI for various income ranges: 0.2% for AGIs $25k-50k, 0.8% for AGIs $50k-75k, 1.5% for AGIs $75k-100k, 2.5% for AGIs $100k-200k, 17.7% for AGIs over 200k)
Profit/loss from business: +$8,304 (reported on 11.5% of returns)
Here:
+$8,304
State:
+$12,323
(% of AGI for various income ranges: 4.5% for AGIs below $25k, 2.5% for AGIs $25k-50k, 1.5% for AGIs $50k-75k, 1.3% for AGIs $75k-100k, 1.9% for AGIs $100k-200k)
Taxable individual retirement arrangement distribution: $13,005 (reported on 30.4% of returns)
85373:
$13,005
Arizona:
$18,280
(% of AGI for various income ranges: 14.2% for AGIs below $25k, 7.9% for AGIs $25k-50k, 6.7% for AGIs $50k-75k, 6.7% for AGIs $75k-100k, 7.8% for AGIs $100k-200k, 7.4% for AGIs over 200k)
Total itemized deductions: $18,858 (28% of AGI, reported on 40.5% of returns)
Here:
$18,858
State:
$23,651
Here:
27.8% of AGI
State:
20.6% of AGI
(% of AGI for various income ranges: 26.1% for AGIs below $25k, 16.6% for AGIs $25k-50k, 13.8% for AGIs $50k-75k, 12.9% for AGIs $75k-100k, 13.8% for AGIs $100k-200k, 14.5% for AGIs over 200k)
Charity contributions: $3,090 (reported on 34.8% of returns)
Here:
$3,090
State:
$4,114
(% of AGI for various income ranges: 2.1% for AGIs below $25k, 1.9% for AGIs $25k-50k, 2.0% for AGIs $50k-75k, 2.2% for AGIs $75k-100k, 2.3% for AGIs $100k-200k, 2.6% for AGIs over 200k)
Taxes paid: $3,843 (reported on 40.2% of returns)
85373:
$3,843
State:
$6,509
(% of AGI for various income ranges: 3.5% for AGIs below $25k, 2.7% for AGIs $25k-50k, 2.7% for AGIs $50k-75k, 3.0% for AGIs $75k-100k, 3.6% for AGIs $100k-200k, 3.3% for AGIs over 200k)
Earned income credit: $1,783 (reported on 6.8% of returns)
Here:
$1,783
State:
$2,432
(% of AGI for various income ranges: 1.8% for AGIs below $25k, 0.4% for AGIs $25k-50k)
Percentage of individuals using paid preparers for their 2012 taxes: 54.1%
Here:
54%
State:
52%
(% for various income ranges: 48.7% for AGIs below $25k, 52.6% for AGIs $25k-50k, 60.0% for AGIs $50k-75k, 57.8% for AGIs $75k-100k, 61.0% for AGIs $100k-200k, 66.7% for AGIs over 200k)
Averages for the 2004 tax year for zip code 85373, filed in 2005:
Average Adjusted Gross Income (AGI) in 2004: $44,658 (Individual Income Tax Returns)
Here:
$44,658
State:
$50,097
Salary/wage: $32,838 (reported on 42.0% of returns)
Here:
$32,838
State:
$42,146
(% of AGI for various income ranges: 44.6% for AGIs below $10k, 24.1% for AGIs $10k-25k, 31.9% for AGIs $25k-50k, 33.6% for AGIs $50k-75k, 41.9% for AGIs $75k-100k, 22.9% for AGIs over 100k)
Taxable interest for individuals: $3,268 (reported on 77.9% of returns)
This zip code:
$3,268
Arizona:
$2,374
(% of AGI for various income ranges: 24.8% for AGIs below $10k, 10.6% for AGIs $10k-25k, 6.8% for AGIs $25k-50k, 5.0% for AGIs $50k-75k, 3.9% for AGIs $75k-100k, 3.6% for AGIs over 100k)
Taxable dividends: $5,359 (reported on 53.9% of returns)
Here:
$5,359
State:
$3,888
(% of AGI for various income ranges: 22.4% for AGIs below $10k, 7.9% for AGIs $10k-25k, 6.2% for AGIs $25k-50k, 5.7% for AGIs $50k-75k, 4.6% for AGIs $75k-100k, 7.2% for AGIs over 100k)
Net capital gain/loss: +$4,790 (reported on 46.8% of returns)
Here:
+$4,790
State:
+$17,569
(% of AGI for various income ranges: -10.1% for AGIs below $10k, -0.1% for AGIs $10k-25k, 1.1% for AGIs $25k-50k, 2.1% for AGIs $50k-75k, 3.8% for AGIs $75k-100k, 14.6% for AGIs over 100k)
Profit/loss from business: +$7,579 (reported on 9.8% of returns)
Here:
+$7,579
State:
+$11,088
(% of AGI for various income ranges: 4.9% for AGIs below $10k, 3.0% for AGIs $10k-25k, 1.4% for AGIs $25k-50k, 1.4% for AGIs $50k-75k, 2.6% for AGIs $75k-100k, 0.9% for AGIs over 100k)
Profit/loss from farming: +$3,800 (reported on 0.2% of returns)
Here:
+$3,800
State:
-$7,013
IRA payment deduction: $3,283 (reported on 2.2% of returns)
85373:
$3,283
Arizona:
$3,023
(% of AGI for various income ranges: 0.2% for AGIs $10k-25k, 0.3% for AGIs $25k-50k, 0.2% for AGIs $50k-75k, 0.2% for AGIs $75k-100k)
Self-employed pension: $6,000 (reported on 0.3% of returns)
Here:
$6,000
Arizona:
$15,785
Total itemized deductions: $16,598 (27% of AGI, reported on 42.5% of returns)
Here:
$16,598
State:
$19,781
Here:
26.7% of AGI
State:
21.8% of AGI
(% of AGI for various income ranges: 43.5% for AGIs below $10k, 23.0% for AGIs $10k-25k, 17.0% for AGIs $25k-50k, 15.7% for AGIs $50k-75k, 15.9% for AGIs $75k-100k, 10.6% for AGIs over 100k)
Charity contributions deductions: $3,120 (5% of AGI, reported on 39.6% of returns)
Here:
$3,120
State:
$3,389
Here:
4.9% of AGI
State:
3.5% of AGI
(% of AGI for various income ranges: 3.7% for AGIs below $10k, 3.0% for AGIs $10k-25k, 2.7% for AGIs $25k-50k, 2.7% for AGIs $50k-75k, 3.2% for AGIs $75k-100k, 2.5% for AGIs over 100k)
Total tax: $5,466 (reported on 79.7% of returns)
85373:
$5,466
State:
$8,323
(% of AGI for various income ranges: 1.8% for AGIs below $10k, 3.1% for AGIs $10k-25k, 7.0% for AGIs $25k-50k, 9.4% for AGIs $50k-75k, 11.1% for AGIs $75k-100k, 14.8% for AGIs over 100k)
Earned income credit: $995 (reported on 3.1% of returns)
Here:
$995
State:
$1,786
Percentage of individuals using paid preparers for their 2004 taxes: 69.6%
Here:
70%
State:
60%
(% for various income ranges: 67.4% for AGIs below $10k, 69.8% for AGIs $10k-25k, 69.6% for AGIs $25k-50k, 69.8% for AGIs $50k-75k, 70.3% for AGIs $75k-100k, 72.6% for AGIs over 100k)
Likely homosexual households (counted as self-reported same-sex unmarried-partner households)
Lesbian couples: 0.5% of all households
Gay men: 0.1% of all households
Household received Food Stamps/SNAP in the past 12 months: 548 Household did not receive Food Stamps/SNAP in the past 12 months: 9,236
Women who had a birth in the past 12 months: 89 (91 now married, 0 unmarried) Women who did not have a birth in the past 12 months: 2,430 (1,370 now married, 1,045 unmarried)
Housing units in zip code 85373 with a mortgage: 4,401 (275 second mortgage, 209 both second mortgage and home equity loan) Houses without a mortgage: 36
Median monthly owner costs for units with a mortgage: $1,410 Median monthly owner costs for units without a mortgage: $443
Residents with income below the poverty level in 2022:
This zip code:
8.2%
Whole state:
12.5%
Residents with income below 50% of the poverty level in 2022:
This zip code:
4.5%
Whole state:
6.0%
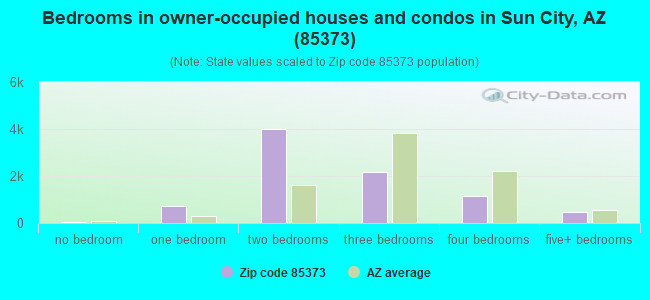
Median number of rooms in houses and condos:
Here:
5.6
State:
6.0
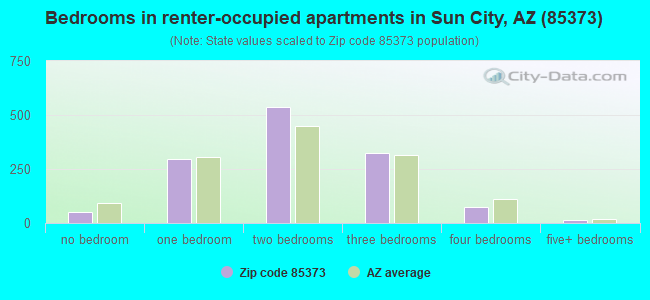
Median number of rooms in apartments:
Here:
4.7
State:
4.1
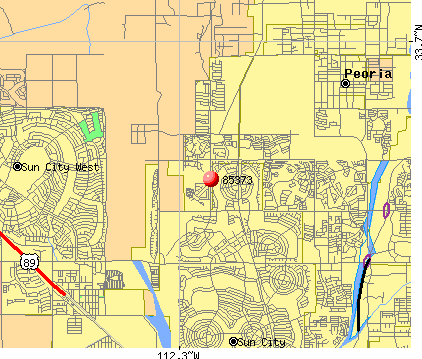
Notable locations in this zip code not listed on our city pages
Notable locations in zip code 85373: Union Hills Golf Course (A), Willow Brook Golf Course (B), Willow Creek Golf Course (C), Sun City Fire District Station 131 (D). Display/hide their locations on the map
Churches in zip code 85373 include: Grace Bible Church (A), American Lutheran Church of Sun City (B), The Congregational Church of Sun City (C), Sun City Christian Church (D), Willowbrook United Methodist Church (E). Display/hide their locations on the map
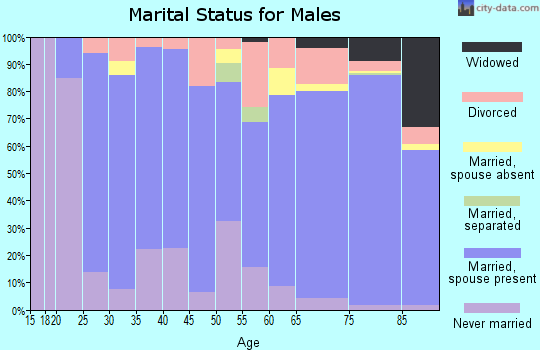
2,076 married couples with children.
509 single-parent households (163 men, 346 women).
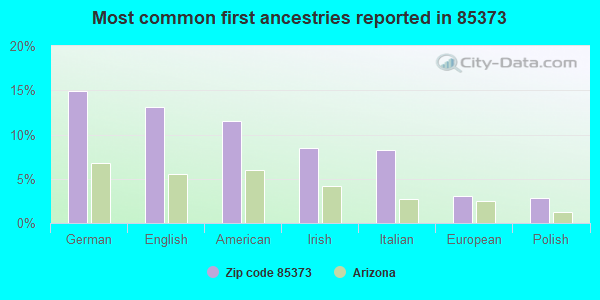
94.0% of residents of 85373 zip code speak English at home.
3.8% of residents speak Spanish at home (73% very well, 13% well, 14% not well).
1.6% of residents speak other Indo-European language at home (61% very well, 31% well, 8% not well).
0.7% of residents speak Asian or Pacific Island language at home (47% very well, 14% well, 39% not well).
1.3% of residents speak other language at home (78% very well, 22% well).
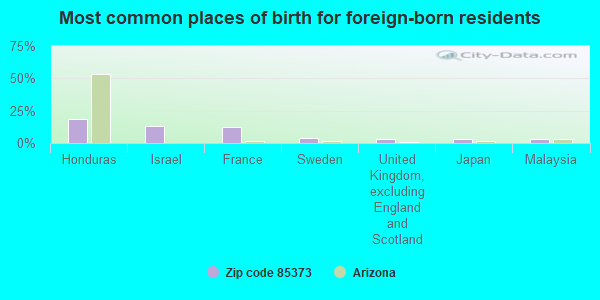
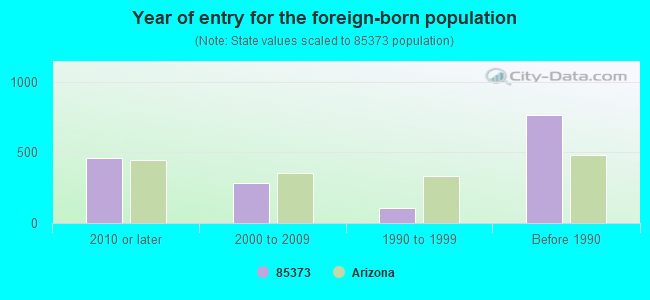
Foreign born population: 1,322 (6.2%) (63.0% of them are naturalized citizens)
Facilities with environmental interests located in this zip code:
CEMEX SUN CITY (24004 NORTH 107TH AVENUE in SUN CITY, AZ)
CRITERIA AND HAZARDOUS AIR POLLUTANT INVENTORY (Inventory of air pollution sources) TRI REPORTER (Tracking of toxic chemicals releasing facilities) Business SIC classification: CONSTRUCTION SAND AND GRAVEL; READY-MIXED CONCRETE Alternative names: CEMEX CONSTRUCTION MATERIALS L.P. ATTN: ENVIRONMENTAL, CEMEX USA (SUN CITY)
Housing units lacking complete plumbing facilities: 0.2% Housing units lacking complete kitchen facilities: 0.5%
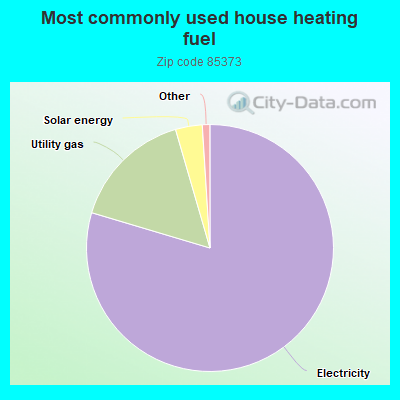
79.7%Electricity
15.9%Utility gas
3.5%Solar energy
Population in 1990: 25,878.
Place of birth for U.S.-born residents:
This state: 5,289
Northeast: 2,718
Midwest: 6,665
South: 1,478
West: 3,298
49% of the 85373 zip code residents lived in the same house 5 years ago. Out of people who lived in different houses, 59% lived in this county. Out of people who lived in different counties, 50% lived in Arizona.
88% of the 85373 zip code residents lived in the same house 1 year ago. Out of people who lived in different houses, 66% moved from this county. Out of people who lived in different houses, 1% moved from different county within same state. Out of people who lived in different houses, 29% moved from different state. Out of people who lived in different houses, 3% moved from abroad.
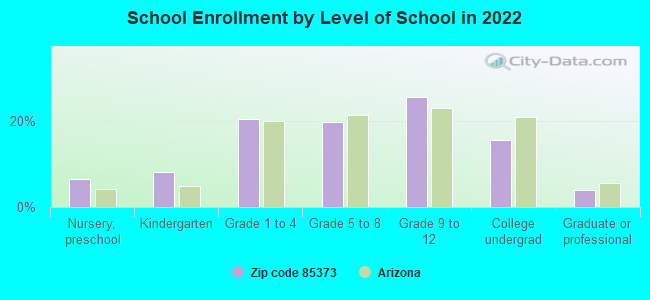
Private vs. public school enrollment:
Students in private schools in grades 1 to 8 (elementary and middle school): 59
Here:
5.4%
Arizona:
10.4%
Students in private schools in grades 9 to 12 (high school):
Here:
0.0%
Arizona:
8.8%
Students in private undergraduate colleges: 53
Here:
12.6%
Arizona:
13.1%
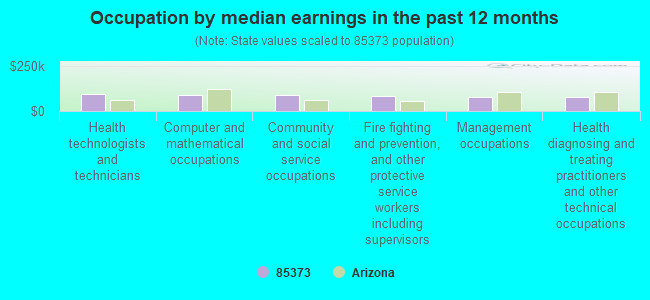
Occupation by median earnings in the past 12 months ($)
92,676Health technologists and technicians
90,061Computer and mathematical occupations
89,047Community and social service occupations
84,606Fire fighting and prevention, and other protective service workers including supervisors
80,202Management occupations
78,325Health diagnosing and treating practitioners and other technical occupations
Top industries in this zip code by the number of employees in 2005:
Health Care and Social Assistance: Homes for the Elderly (100-249 employees: 1 establishment, 50-99 employees: 1 establishment, 20-49 employees: 1 establishment)
Other Services (except Public Administration): Religious Organizations (20-49: 1, 10-19: 4, 5-9: 3, 1-4: 3)
Accommodation and Food Services: Limited-Service Restaurants (20-49: 3)
Arts, Entertainment, and Recreation: Golf Courses and Country Clubs (50-99: 1)
Health Care and Social Assistance: Nursing Care Facilities (50-99: 1)
Health Care and Social Assistance: Services for the Elderly and Persons with Disabilities (50-99: 1)
Real Estate and Rental and Leasing: Lessors of Other Real Estate Property (20-49: 1)
People in group quarters in 2010:
253 people in nursing facilities/skilled-nursing facilities
19 people in group homes intended for adults
People in group quarters in 2000:
112 people in nursing homes
105 people in homes for the mentally ill
Fatal accident statistics in 2014:
Fatal accident count: 1
Vehicles involved in fatal accidents: 1
Fatal accidents caused by drunken drivers: 1
Fatalities: 1
Persons involved in fatal accidents: 1
Pedestrians involved in fatal accidents: 0
Fatal accident statistics in 2013:
Fatal accident count: 2
Vehicles involved in fatal accidents: 4
Fatal accidents caused by drunken drivers: 0
Fatalities: 2
Persons involved in fatal accidents: 3
Pedestrians involved in fatal accidents: 0
Home Mortgage Disclosure Act Aggregated Statistics For Year 2009 (Based on 2 full and 8 partial tracts)
A) FHA, FSA/RHS & VA Home Purchase Loans
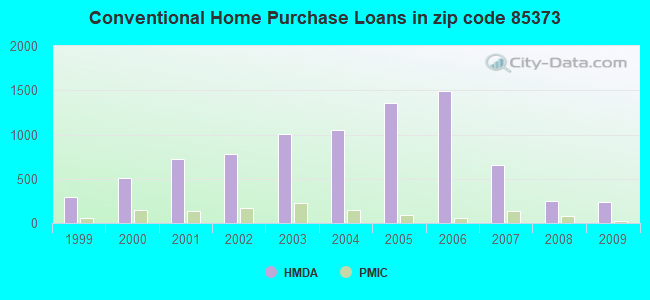
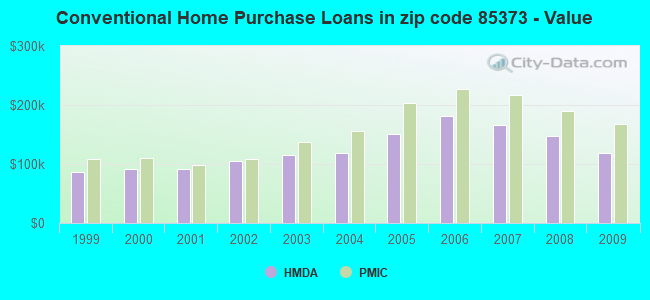
B) Conventional Home Purchase Loans
C) Refinancings
D) Home Improvement Loans
F) Non-occupant Loans on < 5 Family Dwellings (A B C & D)
G) Loans On Manufactured Home Dwelling (A B C & D)
Number
Average Value
Number
Average Value
Number
Average Value
Number
Average Value
Number
Average Value
Number
Average Value
LOANS ORIGINATED
218
$160,408
238
$118,630
563
$142,289
13
$82,936
143
$108,236
2
$96,120
APPLICATIONS APPROVED, NOT ACCEPTED
11
$162,809
16
$125,792
44
$159,704
9
$23,052
6
$127,700
0
$0
APPLICATIONS DENIED
22
$159,140
24
$159,933
202
$173,578
7
$54,776
31
$146,280
0
$0
APPLICATIONS WITHDRAWN
21
$157,358
19
$125,624
105
$172,174
5
$95,866
12
$126,610
2
$24,520
FILES CLOSED FOR INCOMPLETENESS
2
$144,580
5
$151,782
23
$153,156
4
$51,515
8
$86,941
0
$0
Aggregated Statistics For Year 2008 (Based on 2 full and 8 partial tracts)
A) FHA, FSA/RHS & VA Home Purchase Loans
B) Conventional Home Purchase Loans
C) Refinancings
D) Home Improvement Loans
E) Loans on Dwellings For 5+ Families
F) Non-occupant Loans on < 5 Family Dwellings (A B C & D)
G) Loans On Manufactured Home Dwelling (A B C & D)
Number
Average Value
Number
Average Value
Number
Average Value
Number
Average Value
Number
Average Value
Number
Average Value
Number
Average Value
LOANS ORIGINATED
193
$191,909
251
$147,694
368
$161,715
27
$58,995
2
$4,140,995
107
$139,747
11
$73,765
APPLICATIONS APPROVED, NOT ACCEPTED
19
$203,326
34
$155,091
59
$153,546
14
$52,033
0
$0
7
$121,580
2
$62,900
APPLICATIONS DENIED
35
$207,753
42
$195,827
238
$200,975
44
$74,985
0
$0
27
$147,002
15
$55,113
APPLICATIONS WITHDRAWN
16
$191,132
30
$168,456
125
$190,462
4
$16,618
0
$0
15
$129,314
0
$0
FILES CLOSED FOR INCOMPLETENESS
3
$227,747
2
$240,300
20
$205,424
8
$112,182
0
$0
2
$131,355
0
$0
Aggregated Statistics For Year 2007 (Based on 2 full and 8 partial tracts)
A) FHA, FSA/RHS & VA Home Purchase Loans
B) Conventional Home Purchase Loans
C) Refinancings
D) Home Improvement Loans
F) Non-occupant Loans on < 5 Family Dwellings (A B C & D)
G) Loans On Manufactured Home Dwelling (A B C & D)
Number
Average Value
Number
Average Value
Number
Average Value
Number
Average Value
Number
Average Value
Number
Average Value
LOANS ORIGINATED
38
$210,191
658
$165,745
636
$181,126
97
$84,893
208
$155,971
8
$114,444
APPLICATIONS APPROVED, NOT ACCEPTED
2
$113,775
100
$157,174
138
$195,948
41
$66,597
37
$155,369
8
$78,464
APPLICATIONS DENIED
12
$196,726
129
$197,038
308
$217,462
73
$96,214
57
$197,152
19
$56,359
APPLICATIONS WITHDRAWN
5
$183,840
82
$164,417
191
$186,287
13
$124,345
28
$177,872
0
$0
FILES CLOSED FOR INCOMPLETENESS
0
$0
23
$236,230
70
$225,091
9
$82,453
3
$157,363
0
$0
Aggregated Statistics For Year 2006 (Based on 2 full and 8 partial tracts)
A) FHA, FSA/RHS & VA Home Purchase Loans
B) Conventional Home Purchase Loans
C) Refinancings
D) Home Improvement Loans
E) Loans on Dwellings For 5+ Families
F) Non-occupant Loans on < 5 Family Dwellings (A B C & D)
G) Loans On Manufactured Home Dwelling (A B C & D)
Number
Average Value
Number
Average Value
Number
Average Value
Number
Average Value
Number
Average Value
Number
Average Value
Number
Average Value
LOANS ORIGINATED
28
$224,017
1,493
$181,245
985
$186,513
147
$83,228
0
$0
282
$167,597
29
$39,864
APPLICATIONS APPROVED, NOT ACCEPTED
0
$0
153
$187,895
144
$184,802
41
$67,104
0
$0
26
$166,118
8
$45,965
APPLICATIONS DENIED
4
$145,748
371
$189,389
353
$209,832
87
$69,026
1
$62,970
75
$191,889
31
$60,627
APPLICATIONS WITHDRAWN
5
$184,488
126
$160,729
291
$193,567
31
$95,708
0
$0
33
$190,903
4
$92,685
FILES CLOSED FOR INCOMPLETENESS
0
$0
47
$145,266
80
$205,683
5
$80,348
0
$0
4
$188,215
0
$0
Aggregated Statistics For Year 2005 (Based on 2 full and 8 partial tracts)
A) FHA, FSA/RHS & VA Home Purchase Loans
B) Conventional Home Purchase Loans
C) Refinancings
D) Home Improvement Loans
F) Non-occupant Loans on < 5 Family Dwellings (A B C & D)
G) Loans On Manufactured Home Dwelling (A B C & D)
Number
Average Value
Number
Average Value
Number
Average Value
Number
Average Value
Number
Average Value
Number
Average Value
LOANS ORIGINATED
22
$199,835
1,360
$150,062
1,374
$165,317
151
$86,497
444
$146,243
22
$67,808
APPLICATIONS APPROVED, NOT ACCEPTED
0
$0
144
$138,455
163
$144,052
44
$55,773
43
$152,561
10
$45,524
APPLICATIONS DENIED
4
$145,945
193
$164,177
369
$158,590
89
$78,510
45
$161,318
20
$90,263
APPLICATIONS WITHDRAWN
3
$155,510
134
$157,814
236
$157,518
31
$108,449
47
$157,733
4
$55,415
FILES CLOSED FOR INCOMPLETENESS
0
$0
27
$156,096
120
$179,747
11
$77,615
5
$138,214
0
$0
Aggregated Statistics For Year 2004 (Based on 2 full and 8 partial tracts)
A) FHA, FSA/RHS & VA Home Purchase Loans
B) Conventional Home Purchase Loans
C) Refinancings
D) Home Improvement Loans
F) Non-occupant Loans on < 5 Family Dwellings (A B C & D)
G) Loans On Manufactured Home Dwelling (A B C & D)
Number
Average Value
Number
Average Value
Number
Average Value
Number
Average Value
Number
Average Value
Number
Average Value
LOANS ORIGINATED
64
$146,344
1,046
$118,234
839
$129,697
75
$38,197
284
$111,690
10
$50,072
APPLICATIONS APPROVED, NOT ACCEPTED
2
$151,935
68
$125,892
150
$132,152
29
$47,704
19
$97,359
4
$26,878
APPLICATIONS DENIED
7
$100,390
91
$114,346
356
$129,608
75
$40,150
25
$115,263
18
$60,133
APPLICATIONS WITHDRAWN
3
$149,963
83
$127,404
246
$133,302
18
$54,870
20
$127,973
4
$53,452
FILES CLOSED FOR INCOMPLETENESS
0
$0
19
$107,413
46
$136,625
5
$102,808
2
$74,735
0
$0
Aggregated Statistics For Year 2003 (Based on 2 full and 8 partial tracts)
A) FHA, FSA/RHS & VA Home Purchase Loans
B) Conventional Home Purchase Loans
C) Refinancings
D) Home Improvement Loans
F) Non-occupant Loans on < 5 Family Dwellings (A B C & D)
Number
Average Value
Number
Average Value
Number
Average Value
Number
Average Value
Number
Average Value
LOANS ORIGINATED
94
$136,421
1,011
$114,671
2,056
$112,424
94
$28,971
293
$102,712
APPLICATIONS APPROVED, NOT ACCEPTED
6
$83,848
65
$127,819
257
$113,755
31
$26,120
17
$123,271
APPLICATIONS DENIED
10
$117,534
84
$89,770
411
$114,389
59
$25,972
17
$93,372
APPLICATIONS WITHDRAWN
15
$113,461
90
$118,983
377
$124,574
10
$42,001
19
$102,946
FILES CLOSED FOR INCOMPLETENESS
1
$156,790
13
$135,908
46
$117,492
5
$74,070
1
$86,940
Aggregated Statistics For Year 2002 (Based on 6 partial tracts)
A) FHA, FSA/RHS & VA Home Purchase Loans
B) Conventional Home Purchase Loans
C) Refinancings
D) Home Improvement Loans
F) Non-occupant Loans on < 5 Family Dwellings (A B C & D)
Number
Average Value
Number
Average Value
Number
Average Value
Number
Average Value
Number
Average Value
LOANS ORIGINATED
75
$127,171
781
$105,316
780
$93,638
31
$28,964
186
$88,571
APPLICATIONS APPROVED, NOT ACCEPTED
3
$122,950
47
$91,469
101
$95,660
12
$21,199
12
$92,431
APPLICATIONS DENIED
3
$157,223
67
$115,330
182
$83,176
44
$38,588
7
$99,840
APPLICATIONS WITHDRAWN
8
$111,495
124
$147,760
113
$105,296
6
$14,567
17
$123,565
FILES CLOSED FOR INCOMPLETENESS
0
$0
12
$154,872
24
$109,314
0
$0
2
$108,865
Aggregated Statistics For Year 2001 (Based on 6 partial tracts)
A) FHA, FSA/RHS & VA Home Purchase Loans
B) Conventional Home Purchase Loans
C) Refinancings
D) Home Improvement Loans
F) Non-occupant Loans on < 5 Family Dwellings (A B C & D)
Number
Average Value
Number
Average Value
Number
Average Value
Number
Average Value
Number
Average Value
LOANS ORIGINATED
178
$122,225
718
$91,969
608
$92,665
39
$29,029
155
$95,403
APPLICATIONS APPROVED, NOT ACCEPTED
6
$92,107
49
$82,522
98
$79,491
18
$20,237
5
$104,878
APPLICATIONS DENIED
166
$100,639
181
$109,440
249
$91,890
60
$24,649
7
$95,147
APPLICATIONS WITHDRAWN
65
$114,288
124
$130,892
108
$101,863
7
$32,517
13
$136,300
FILES CLOSED FOR INCOMPLETENESS
3
$91,677
16
$89,260
29
$105,286
0
$0
0
$0
Aggregated Statistics For Year 2000 (Based on 6 partial tracts)
A) FHA, FSA/RHS & VA Home Purchase Loans
B) Conventional Home Purchase Loans
C) Refinancings
D) Home Improvement Loans
F) Non-occupant Loans on < 5 Family Dwellings (A B C & D)
Number
Average Value
Number
Average Value
Number
Average Value
Number
Average Value
Number
Average Value
LOANS ORIGINATED
137
$113,209
511
$90,894
128
$64,396
87
$26,606
84
$86,089
APPLICATIONS APPROVED, NOT ACCEPTED
7
$114,487
55
$101,825
36
$77,747
35
$25,344
7
$90,423
APPLICATIONS DENIED
150
$105,230
124
$103,328
98
$77,877
73
$27,658
3
$50,040
APPLICATIONS WITHDRAWN
16
$99,991
40
$98,392
49
$61,612
9
$48,609
9
$47,583
FILES CLOSED FOR INCOMPLETENESS
4
$63,430
11
$113,660
16
$107,169
0
$0
6
$112,885
Aggregated Statistics For Year 1999 (Based on 3 partial tracts)
A) FHA, FSA/RHS & VA Home Purchase Loans
B) Conventional Home Purchase Loans
C) Refinancings
D) Home Improvement Loans
F) Non-occupant Loans on < 5 Family Dwellings (A B C & D)
2004 - 2018 National Fire Incident Reporting System (NFIRS) incidents
According to the data from the years 2004 - 2018 the average number of fire incidents per year is 19. The highest number of reported fires - 45 took place in 2010, and the least - 0 in 2005. The data has a growing trend.
When looking into fire subcategories, the most reports belonged to: Outside Fires (44.9%), and Structure Fires (36.8%).
Fire incident types reported to NFIRS in Zip Code 85373


+$3,800
-$7,013
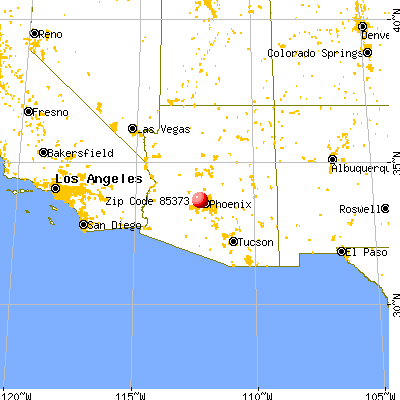
 Nearest zip codes: 85382, 85351, 85375, 85335, 85374, 85363.
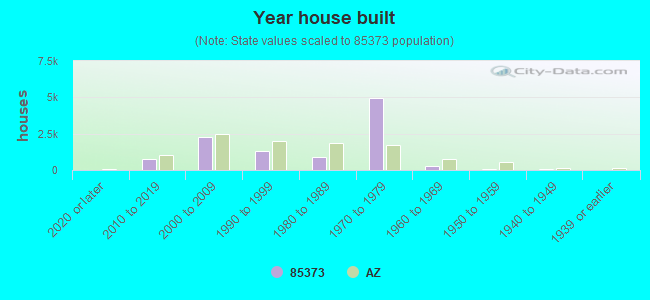


 According to the data from the years 2004 - 2018 the average number of fire incidents per year is 19. The highest number of reported fires - 45 took place in 2010, and the least - 0 in 2005. The data has a growing trend.
 When looking into fire subcategories, the most reports belonged to: Outside Fires (44.9%), and Structure Fires (36.8%).