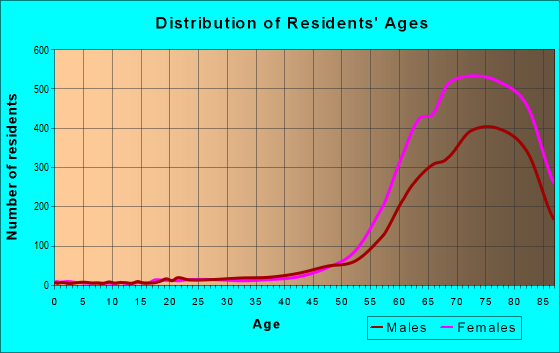
Estimated zip code population in 2022: 28,582 Zip code population in 2010: 27,789 Zip code population in 2000: 28,800
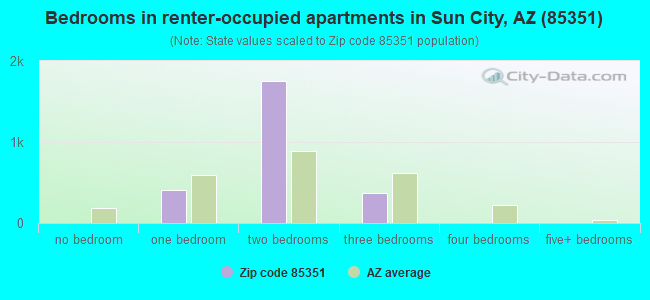
Houses and condos: 21,094 Renter-occupied apartments: 2,590
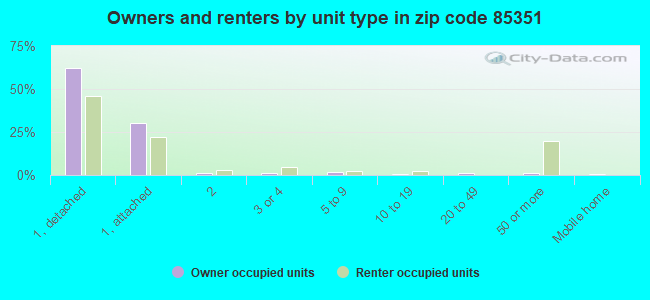
% of renters here:
14%
State:
33%
March 2022 cost of living index in zip code 85351: 100.4 (near average, U.S. average is 100)
Land area: 10.8 sq. mi. Water area: 0.2 sq. mi.
Population density: 2,639 people per square mile
(average).
OSM Map
General Map
Google Map
MSN Map
OSM Map
General Map
Google Map
MSN Map
OSM Map
General Map
Google Map
MSN Map
OSM Map
General Map
Google Map
MSN Map
Please wait while loading the map...
Real estate property taxes paid for housing units in 2022:
This zip code:
0.3% ($915)
Arizona:
0.4% ($1,786)
Median real estate property taxes paid for housing units with mortgages in 2022: $898 (0.3%) Median real estate property taxes paid for housing units with no mortgage in 2022: $924 (0.3%)
Averages for the 2020 tax year for zip code 85351, filed in 2021:
Average Adjusted Gross Income (AGI) in 2020: $50,268 (Individual Income Tax Returns)
Here:
$50,268
State:
$73,499
Salary/wage: $38,920 (reported on 39.9% of returns)
Here:
$38,920
State:
$59,499
(% of AGI for various income ranges: 530.6% for AGIs below $25k, 2074.2% for AGIs $25k-50k, 3846.8% for AGIs $50k-75k, 5293.2% for AGIs $75k-100k, 9496.8% for AGIs $100k-200k, 39211.7% for AGIs over 200k)
Taxable interest for individuals: $1,612 (reported on 47.4% of returns)
This zip code:
$1,612
Arizona:
$2,325
(% of AGI for various income ranges: 57.0% for AGIs below $25k, 77.9% for AGIs $25k-50k, 156.3% for AGIs $50k-75k, 196.7% for AGIs $75k-100k, 495.1% for AGIs $100k-200k, 2450.0% for AGIs over 200k)
Ordinary dividends: $5,885 (reported on 33.3% of returns)
Here:
$5,885
State:
$8,711
(% of AGI for various income ranges: 109.9% for AGIs below $25k, 158.9% for AGIs $25k-50k, 343.7% for AGIs $50k-75k, 682.6% for AGIs $75k-100k, 1362.7% for AGIs $100k-200k, 8156.7% for AGIs over 200k)
Net capital gain/loss in AGI: +$11,964 (reported on 29.4% of returns)
Here:
+$11,964
State:
+$31,332
(% of AGI for various income ranges: 22.7% for AGIs below $25k, 83.1% for AGIs $25k-50k, 274.2% for AGIs $50k-75k, 723.2% for AGIs $75k-100k, 2337.0% for AGIs $100k-200k, 47070.0% for AGIs over 200k)
Profit/loss from business: +$7,623 (reported on 9.6% of returns)
Here:
+$7,623
State:
+$13,214
(% of AGI for various income ranges: 76.7% for AGIs below $25k, 111.4% for AGIs $25k-50k, 125.7% for AGIs $50k-75k, 269.0% for AGIs $75k-100k, 394.0% for AGIs $100k-200k, 106.7% for AGIs over 200k)
Taxable individual retirement arrangement distribution: $16,114 (reported on 30.4% of returns)
85351:
$16,114
Arizona:
$23,364
(% of AGI for various income ranges: 296.0% for AGIs below $25k, 500.8% for AGIs $25k-50k, 934.9% for AGIs $50k-75k, 1489.4% for AGIs $75k-100k, 3257.8% for AGIs $100k-200k, 17451.7% for AGIs over 200k)
Total itemized deductions: $34,335 (reported on 9.3% of returns)
Here:
$34,335
State:
$36,308
(% of AGI for various income ranges: 164.0% for AGIs below $25k, 295.6% for AGIs $25k-50k, 652.0% for AGIs $50k-75k, 870.7% for AGIs $75k-100k, 2015.6% for AGIs $100k-200k, 15593.3% for AGIs over 200k)
Charity contributions: $8,313 (reported on 8.0% of returns)
Here:
$8,313
State:
$11,955
(% of AGI for various income ranges: 13.5% for AGIs below $25k, 43.1% for AGIs $25k-50k, 119.2% for AGIs $50k-75k, 180.0% for AGIs $75k-100k, 477.0% for AGIs $100k-200k, 4953.3% for AGIs over 200k)
Taxes paid: $3,746 (reported on 9.2% of returns)
85351:
$3,746
State:
$6,820
(% of AGI for various income ranges: 11.8% for AGIs below $25k, 27.3% for AGIs $25k-50k, 66.3% for AGIs $50k-75k, 119.2% for AGIs $75k-100k, 267.0% for AGIs $100k-200k, 1498.3% for AGIs over 200k)
Earned income credit: $872 (reported on 4.2% of returns)
Here:
$872
State:
$2,383
(% of AGI for various income ranges: 12.1% for AGIs below $25k, 7.0% for AGIs $25k-50k)
Percentage of individuals using paid preparers for their 2020 taxes: 90.5%
Here:
90%
State:
93%
(% for various income ranges: 89.5% for AGIs below $25k, 91.5% for AGIs $25k-50k, 90.4% for AGIs $50k-75k, 92.4% for AGIs $75k-100k, 90.0% for AGIs $100k-200k, 89.7% for AGIs over 200k)
Averages for the 2012 tax year for zip code 85351, filed in 2013:
Average Adjusted Gross Income (AGI) in 2012: $41,967 (Individual Income Tax Returns)
Here:
$41,967
State:
$57,644
Salary/wage: $29,476 (reported on 37.5% of returns)
Here:
$29,476
State:
$47,932
(% of AGI for various income ranges: 25.8% for AGIs below $25k, 32.5% for AGIs $25k-50k, 25.5% for AGIs $50k-75k, 24.5% for AGIs $75k-100k, 25.0% for AGIs $100k-200k, 18.2% for AGIs over 200k)
Taxable interest for individuals: $2,018 (reported on 58.9% of returns)
This zip code:
$2,018
Arizona:
$2,064
(% of AGI for various income ranges: 4.3% for AGIs below $25k, 2.9% for AGIs $25k-50k, 2.5% for AGIs $50k-75k, 2.3% for AGIs $75k-100k, 2.7% for AGIs $100k-200k, 2.8% for AGIs over 200k)
Ordinary dividends: $5,873 (reported on 41.3% of returns)
Here:
$5,873
State:
$7,268
(% of AGI for various income ranges: 6.6% for AGIs below $25k, 4.3% for AGIs $25k-50k, 4.9% for AGIs $50k-75k, 4.9% for AGIs $75k-100k, 7.5% for AGIs $100k-200k, 8.9% for AGIs over 200k)
Net capital gain/loss in AGI: +$4,418 (reported on 34.7% of returns)
Here:
+$4,418
State:
+$15,530
(% of AGI for various income ranges: 0.9% for AGIs $25k-50k, 1.3% for AGIs $50k-75k, 2.3% for AGIs $75k-100k, 4.9% for AGIs $100k-200k, 28.0% for AGIs over 200k)
Profit/loss from business: +$5,950 (reported on 8.9% of returns)
Here:
+$5,950
State:
+$12,323
(% of AGI for various income ranges: 2.8% for AGIs below $25k, 1.2% for AGIs $25k-50k, 0.9% for AGIs $50k-75k, 0.7% for AGIs $75k-100k, 1.5% for AGIs $100k-200k)
Taxable individual retirement arrangement distribution: $12,002 (reported on 38.9% of returns)
85351:
$12,002
Arizona:
$18,280
(% of AGI for various income ranges: 13.8% for AGIs below $25k, 9.4% for AGIs $25k-50k, 9.8% for AGIs $50k-75k, 11.0% for AGIs $75k-100k, 12.7% for AGIs $100k-200k, 11.8% for AGIs over 200k)
Self-employment retirement plans: $11,600 (reported on 0.2% of returns)
85351:
$11,600
Arizona:
$22,154
Total itemized deductions: $20,480 (35% of AGI, reported on 34.4% of returns)
Here:
$20,480
State:
$23,651
Here:
35.3% of AGI
State:
20.6% of AGI
(% of AGI for various income ranges: 26.7% for AGIs below $25k, 18.1% for AGIs $25k-50k, 14.0% for AGIs $50k-75k, 13.7% for AGIs $75k-100k, 14.9% for AGIs $100k-200k, 14.1% for AGIs over 200k)
Charity contributions: $3,558 (reported on 29.9% of returns)
Here:
$3,558
State:
$4,114
(% of AGI for various income ranges: 2.5% for AGIs below $25k, 2.2% for AGIs $25k-50k, 2.4% for AGIs $50k-75k, 2.5% for AGIs $75k-100k, 3.0% for AGIs $100k-200k, 2.7% for AGIs over 200k)
Taxes paid: $3,178 (reported on 34.2% of returns)
85351:
$3,178
State:
$6,509
(% of AGI for various income ranges: 3.1% for AGIs below $25k, 2.3% for AGIs $25k-50k, 2.2% for AGIs $50k-75k, 2.5% for AGIs $75k-100k, 2.9% for AGIs $100k-200k, 3.3% for AGIs over 200k)
Earned income credit: $807 (reported on 4.6% of returns)
Here:
$807
State:
$2,432
(% of AGI for various income ranges: 0.6% for AGIs below $25k)
Percentage of individuals using paid preparers for their 2012 taxes: 56.0%
Here:
56%
State:
52%
(% for various income ranges: 47.6% for AGIs below $25k, 57.4% for AGIs $25k-50k, 63.8% for AGIs $50k-75k, 69.4% for AGIs $75k-100k, 72.0% for AGIs $100k-200k, 75.0% for AGIs over 200k)
Averages for the 2004 tax year for zip code 85351, filed in 2005:
Average Adjusted Gross Income (AGI) in 2004: $36,219 (Individual Income Tax Returns)
Here:
$36,219
State:
$50,097
Salary/wage: $25,129 (reported on 36.8% of returns)
Here:
$25,129
State:
$42,146
(% of AGI for various income ranges: 38.8% for AGIs below $10k, 24.0% for AGIs $10k-25k, 29.6% for AGIs $25k-50k, 27.5% for AGIs $50k-75k, 25.9% for AGIs $75k-100k, 17.5% for AGIs over 100k)
Taxable interest for individuals: $3,354 (reported on 78.5% of returns)
This zip code:
$3,354
Arizona:
$2,374
(% of AGI for various income ranges: 29.0% for AGIs below $10k, 10.0% for AGIs $10k-25k, 6.7% for AGIs $25k-50k, 5.6% for AGIs $50k-75k, 6.3% for AGIs $75k-100k, 6.8% for AGIs over 100k)
Taxable dividends: $5,175 (reported on 53.4% of returns)
Here:
$5,175
State:
$3,888
(% of AGI for various income ranges: 23.2% for AGIs below $10k, 7.4% for AGIs $10k-25k, 6.2% for AGIs $25k-50k, 6.3% for AGIs $50k-75k, 7.7% for AGIs $75k-100k, 10.1% for AGIs over 100k)
Net capital gain/loss: +$4,698 (reported on 46.5% of returns)
Here:
+$4,698
State:
+$17,569
(% of AGI for various income ranges: -17.4% for AGIs below $10k, -0.2% for AGIs $10k-25k, 1.2% for AGIs $25k-50k, 3.0% for AGIs $50k-75k, 6.6% for AGIs $75k-100k, 22.2% for AGIs over 100k)
Profit/loss from business: +$6,842 (reported on 9.1% of returns)
Here:
+$6,842
State:
+$11,088
(% of AGI for various income ranges: 6.9% for AGIs below $10k, 1.9% for AGIs $10k-25k, 1.7% for AGIs $25k-50k, 1.4% for AGIs $50k-75k, 1.3% for AGIs $75k-100k, 1.8% for AGIs over 100k)
Profit/loss from farming: +$1,250 (reported on 0.1% of returns)
Here:
+$1,250
State:
-$7,013
IRA payment deduction: $3,570 (reported on 2.0% of returns)
85351:
$3,570
Arizona:
$3,023
(% of AGI for various income ranges: 0.5% for AGIs below $10k, 0.2% for AGIs $10k-25k, 0.3% for AGIs $25k-50k, 0.2% for AGIs $50k-75k, 0.2% for AGIs $75k-100k, 0.1% for AGIs over 100k)
Self-employed pension: $8,980 (reported on 0.3% of returns)
Here:
$8,980
Arizona:
$15,785
Total itemized deductions: $17,995 (37% of AGI, reported on 37.0% of returns)
Here:
$17,995
State:
$19,781
Here:
36.6% of AGI
State:
21.8% of AGI
(% of AGI for various income ranges: 73.8% for AGIs below $10k, 24.7% for AGIs $10k-25k, 18.0% for AGIs $25k-50k, 14.6% for AGIs $50k-75k, 14.9% for AGIs $75k-100k, 16.5% for AGIs over 100k)
Charity contributions deductions: $3,597 (7% of AGI, reported on 33.6% of returns)
Here:
$3,597
State:
$3,389
Here:
7.1% of AGI
State:
3.5% of AGI
(% of AGI for various income ranges: 4.5% for AGIs below $10k, 3.0% for AGIs $10k-25k, 2.9% for AGIs $25k-50k, 2.9% for AGIs $50k-75k, 3.4% for AGIs $75k-100k, 4.6% for AGIs over 100k)
Total tax: $4,424 (reported on 76.2% of returns)
85351:
$4,424
State:
$8,323
(% of AGI for various income ranges: 2.3% for AGIs below $10k, 3.0% for AGIs $10k-25k, 7.1% for AGIs $25k-50k, 10.2% for AGIs $50k-75k, 11.3% for AGIs $75k-100k, 15.4% for AGIs over 100k)
Earned income credit: $598 (reported on 2.6% of returns)
Here:
$598
State:
$1,786
Percentage of individuals using paid preparers for their 2004 taxes: 71.4%
Here:
71%
State:
60%
(% for various income ranges: 69.4% for AGIs below $10k, 70.4% for AGIs $10k-25k, 70.5% for AGIs $25k-50k, 73.7% for AGIs $50k-75k, 77.2% for AGIs $75k-100k, 79.0% for AGIs over 100k)
Likely homosexual households (counted as self-reported same-sex unmarried-partner households)
Lesbian couples: 0.1% of all households
Gay men: 0.1% of all households
Household received Food Stamps/SNAP in the past 12 months: 1,120 Household did not receive Food Stamps/SNAP in the past 12 months: 16,886
Women who had a birth in the past 12 months: 16 (16 now married, 0 unmarried) Women who did not have a birth in the past 12 months: 774 (202 now married, 575 unmarried)
Housing units in zip code 85351 with a mortgage: 7,367 (300 second mortgage, 314 both second mortgage and home equity loan) Houses without a mortgage: 145
Median monthly owner costs for units with a mortgage: $1,014 Median monthly owner costs for units without a mortgage: $363
Residents with income below the poverty level in 2022:
This zip code:
8.6%
Whole state:
12.5%
Residents with income below 50% of the poverty level in 2022:
This zip code:
3.0%
Whole state:
6.0%
Median number of rooms in houses and condos:
Here:
5.4
State:
6.0
Median number of rooms in apartments:
Here:
4.4
State:
4.1
Notable locations in this zip code not listed on our city pages
Notable locations in zip code 85351: Marinette Substation (A), Lakes East Golf Course (B), Lakes West Golf Course (C), North Golf Course (D), South Golf Course (E), Sun City Country Club (F), Palmbrook Country Club Golf Course (G), Quail Run Golf Course (H), Riverview Golf Course (I), Marinette Railroad Station (J), Maricopa County Library District Sun City Branch (K), Sun City Community Hall (L), Sun City Fire District Station 133 (M), Sun City Fire District Station 132 (N). Display/hide their locations on the map
Shopping Centers: Circle Shopping Center (1), Grand Avenue Shopping Center (2), Greenway Terrace Shopping Center (3), La Ronde Shopping Center (4), Plaza del Sol Shopping Center (5), Sun Bowl Plaza Shopping Center (6), Thunderbird Plaza Shopping Center (7), Grand Center Shopping Center (8), La Ronde Center East Shopping Center (9). Display/hide their locations on the map
Churches in zip code 85351 include: Fountain of Life Lutheran Church (A), First United Methodist Church (B), First Presbyterian Church of Sun City (C), First Church of Christ Scientist (D), First Christian Church (E), First Baptist Church of Sun City (F), Faith Presbyterian Church (G), Bellevue Heights Church (H), All Saints of the Desert Episcopal Church (I). Display/hide their locations on the map
In group quarters: 206 (-1 institutionalized population)
Size of family households: 7,833 2-persons, 652 3-persons, 84 4-persons, 42 5-persons
Size of nonfamily households: 8,559 1-person, 910 2-persons, 17 5-persons
19 married couples with children.
0 single-parent households ().
97.6% of residents of 85351 zip code speak English at home.
2.5% of residents speak Spanish at home (91% very well, 9% well).
1.5% of residents speak other Indo-European language at home (74% very well, 17% well, 9% not well).
0.3% of residents speak Asian or Pacific Island language at home (83% well, 17% not well).
0.6% of residents speak other language at home (26% very well, 48% well, 5% not well, 20% not at all).
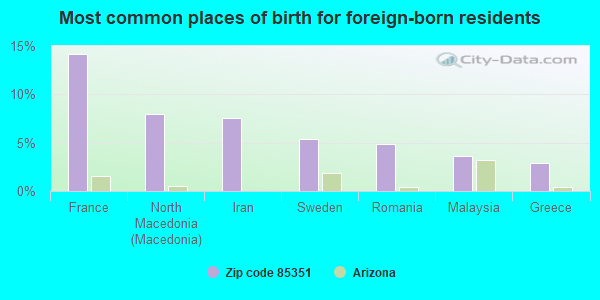
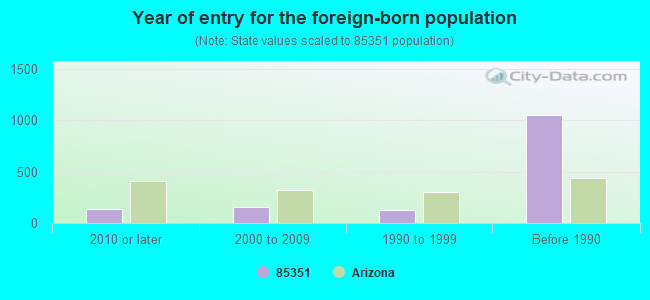
Foreign born population: 1,312 (4.6%) (81.0% of them are naturalized citizens)
Major facilities with environmental interests located in this zip code:
VULCAN MATERIALS CO (11495 W HATFIELD RD in SUN CITY, AZ)
Small Quantity Generators, between 100 kg and 1000 kg of hazardous waste/month (Resource Conservation and Recovery Act (tracking hazardous waste)) USED OIL PROGRAM (Resource Conservation and Recovery Act (tracking hazardous waste)) TRI REPORTER (Tracking of toxic chemicals releasing facilities) Business SIC classification: ASPHALT PAVING MIXTURES AND BLOCKS Organizations: VULCAN MATERIALS COMPANY (CONTACT/OPERATOR)
, BRUCE DYER (CONTACT/OWNER)
Alternative names: NEW WEST MATERIALS SUN CITY 309, VULCAN MATERIALS CO - PEORIA
BECRAFT CLEANERS (14817 N DEL WEBB BLVD in SUN CITY, AZ)
BOB BROWN AIR CONDITIONING (10020 SANTA FE DR in SUN CITY, AZ)
(Resource Conservation and Recovery Act (tracking hazardous waste)) Business NAICS classification: APPLIANCE REPAIR AND MAINTENANCE.
EXXON CO USA 73265 (14626 N DEL WEBB BLVD in SUN CITY, AZ)
(Resource Conservation and Recovery Act (tracking hazardous waste))
FRYS FOOD & DRUG STORES #122 (10660 NW GRAND AVE in SUN CITY, AZ)
(Resource Conservation and Recovery Act (tracking hazardous waste)) Organizations: KROGER CO (CONTACT/OWNER)
Alternative names: FRYS FOOD & DRUG STORES 122, FRYS FOOD STORES 122
NORTHWEST VALLEY NEWSPAPER (10102 W SANTA FE DR in SUN CITY, AZ)
(Resource Conservation and Recovery Act (tracking hazardous waste)) Organizations: OTTAWAY NEWSPAPERS INC (CONTACT/OWNER)
Alternative names: NEWS SUN INC
BECRAFT CLNRS AND LAUNDRY INC (10763 W PEORIA AVE in SUN CITY, AZ)
Small Quantity Generators, between 100 kg and 1000 kg of hazardous waste/month (Resource Conservation and Recovery Act (tracking hazardous waste)) - notification Organizations: ST CLAIR CHARLES (CONTACT/OWNER)
EXXONMOBIL OIL CORP 10760 (9848 W BELL RD in SUN CITY, AZ)
Conditionally Exempt Small Quantity Generators, less than 100 kg/month of hazardous waste (Resource Conservation and Recovery Act (tracking hazardous waste)) - notification Organizations: MOBIL OIL CORP MKTG ENVIRON (CONTACT/OWNER)
Alternative names: MOBIL OIL CORP SS 800
EXXONMOBIL OIL CORP 12388 (13404 N DEL WEBB BLVD NWC in SUN CITY, AZ)
Conditionally Exempt Small Quantity Generators, less than 100 kg/month of hazardous waste (Resource Conservation and Recovery Act (tracking hazardous waste)) - notification Organizations: MOBIL OIL CORP MKTG ENVIRON (CONTACT/OWNER)
Alternative names: MOBIL OIL CORP SS MX9
FOX ENTERPRISES, INC. (10919 DEANNE DR. in SUN CITY, AZ)
COMPLIANCE ACTIVITY (Tracking inspections of insecticide, fungicide, and rodenticide, and toxic substances)
GREENWAY TERRACE CLEANERS (15420 N 99TH AVE in SUN CITY, AZ)
Small Quantity Generators, between 100 kg and 1000 kg of hazardous waste/month (Resource Conservation and Recovery Act (tracking hazardous waste)) - notification Organizations: HENDERSON WILLIAM (CONTACT/OWNER)
ARCO FACILITY NO 1509 (10303 W GRAND AVE in SUN CITY, AZ)
Small Quantity Generators, between 100 kg and 1000 kg of hazardous waste/month (Resource Conservation and Recovery Act (tracking hazardous waste)) - notification Organizations: BP WEST COAST PRODUCTS LLC (CONTACT/OWNER)
Alternative names: ARCO NO 1509
AUTOMOTIVE DYNAMICS (10222 SANTA FE DR in SUN CITY, AZ)
Conditionally Exempt Small Quantity Generators, less than 100 kg/month of hazardous waste (Resource Conservation and Recovery Act (tracking hazardous waste)) - notification Organizations: CHUCK NIDAY (CONTACT/OWNER)
Housing units lacking complete plumbing facilities: 1.4% Housing units lacking complete kitchen facilities: 1.7%
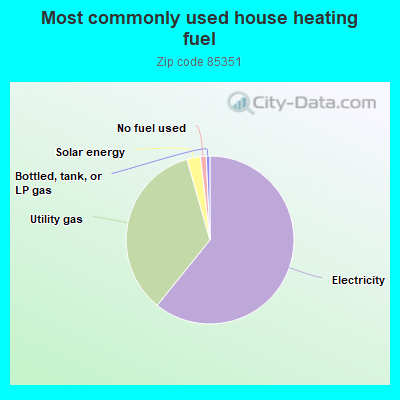
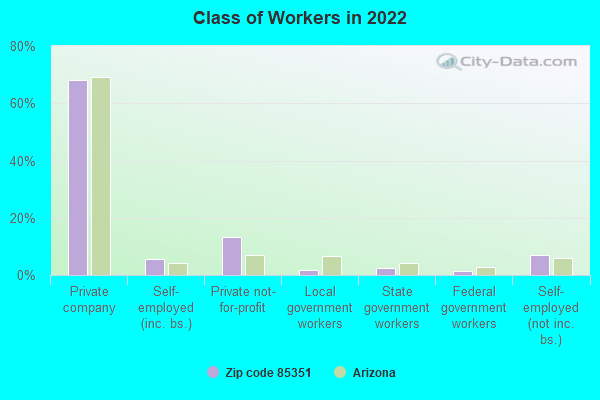
60.7%Electricity
34.7%Utility gas
2.6%Solar energy
1.1%No fuel used
0.7%Bottled, tank, or LP gas
Population in 1990: 31,102.
Place of birth for U.S.-born residents:
This state: 2,195
Northeast: 3,817
Midwest: 12,265
South: 2,529
West: 6,008
60% of the 85351 zip code residents lived in the same house 5 years ago. Out of people who lived in different houses, 54% lived in this county. Out of people who lived in different counties, 50% lived in Arizona.
88% of the 85351 zip code residents lived in the same house 1 year ago. Out of people who lived in different houses, 48% moved from this county. Out of people who lived in different houses, 3% moved from different county within same state. Out of people who lived in different houses, 50% moved from different state. Out of people who lived in different houses, 2% moved from abroad.
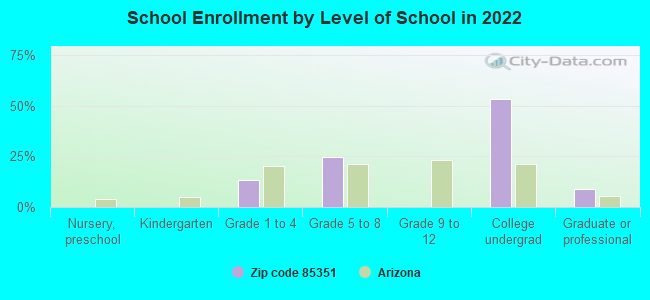
Private vs. public school enrollment:
Students in private schools in grades 1 to 8 (elementary and middle school): 64
Here:
50.5%
Arizona:
10.4%
Students in private undergraduate colleges: 45
Here:
25.6%
Arizona:
13.1%
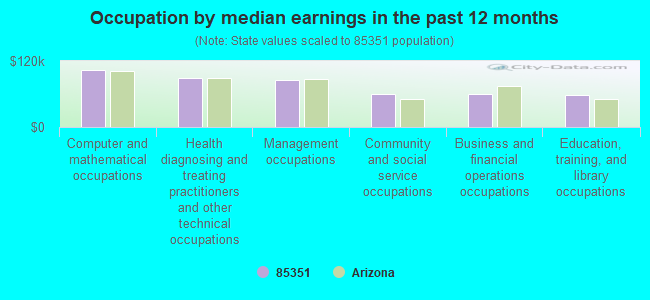
Occupation by median earnings in the past 12 months ($)
104,064Computer and mathematical occupations
88,260Health diagnosing and treating practitioners and other technical occupations
85,052Management occupations
59,586Community and social service occupations
59,375Business and financial operations occupations
58,556Education, training, and library occupations
Companies with federal contracts located in this zip code:
CHADMAR SALES (16822 N MEADOW PARK DR in SUN CITY, AZ; small business) : $67,515 in 2 contractsfrom 2002 to 2003
$51,940 with Air Force for Miscellaneous Items. Signed on 2003-09-30. Completion date: 2003-09-30.
$15,575 with Air Force for Signs, Advertising Displays, and Identification Plates. Signed on 2002-05-13. Completion date: 2002-05-13.
ENVIRO-SAFE INDUSTRIAL SALES (9227 W ARROWHEAD DR in SUN CITY, AZ; small business) : $36,750 in 2 contractsin 2005
$27,450 with Navy for Valves, Nonpowered. Signed on 2005-09-14. Completion date: 2005-10-31.
$9,300 with Navy for Miscellaneous Items. Signed on 2005-08-17. Completion date: 2005-11-04.
Top industries in this zip code by the number of employees in 2005:
Health Care and Social Assistance: General Medical and Surgical Hospitals (over 1000 employees: 1 establishment)
Management of Companies and Enterprises: Corporate, Subsidiary, and Regional Managing Offices (500-999: 1, 1-4: 1)
Health Care and Social Assistance: Continuing Care Retirement Communities (250-499: 1, 100-249: 1)
Health Care and Social Assistance: Home Health Care Services (250-499: 1, 50-99: 1, 20-49: 2, 5-9: 1)
Health Care and Social Assistance: Offices of Physicians (except Mental Health Specialists) (20-49: 7, 10-19: 5, 5-9: 7, 1-4: 40)
2004 - 2018 National Fire Incident Reporting System (NFIRS) incidents
According to the data from the years 2004 - 2018 the average number of fire incidents per year is 28. The highest number of reported fires - 85 took place in 2018, and the least - 0 in 2008. The data has a growing trend.
When looking into fire subcategories, the most reports belonged to: Structure Fires (57.5%), and Outside Fires (23.5%).
Fire incident types reported to NFIRS in Zip Code 85351


+$1,250
-$7,013
 Nearest zip codes: 85363, 85335, 85345, 85381, 85382, 85373.


 According to the data from the years 2004 - 2018 the average number of fire incidents per year is 28. The highest number of reported fires - 85 took place in 2018, and the least - 0 in 2008. The data has a growing trend.
 When looking into fire subcategories, the most reports belonged to: Structure Fires (57.5%), and Outside Fires (23.5%).