Estimated zip code population in 2022: 42,230 Zip code population in 2010: 40,454 Zip code population in 2000: 37,575
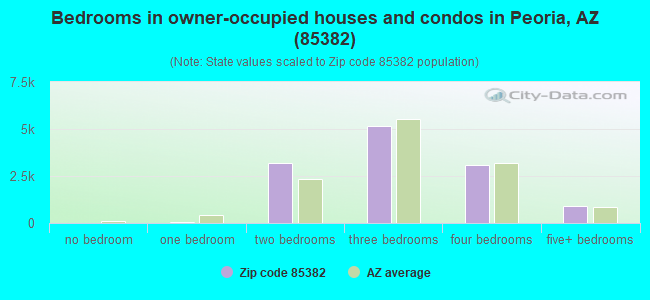
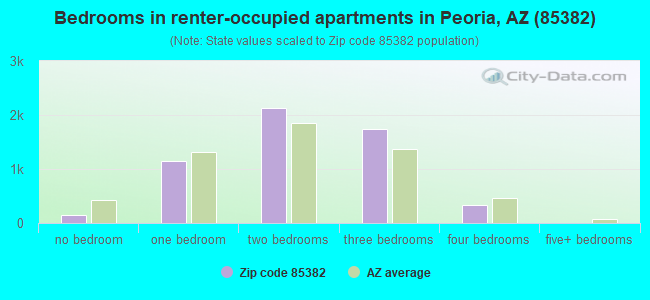
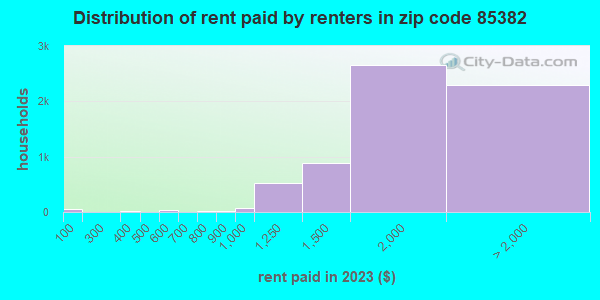
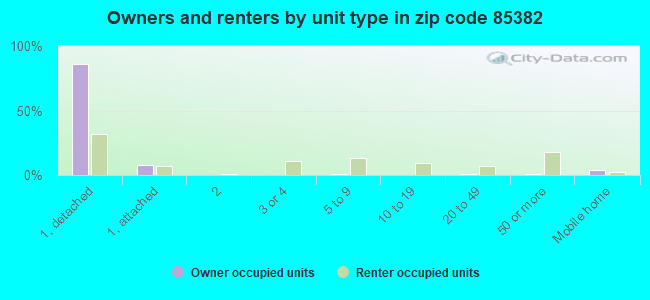
Houses and condos: 19,829 Renter-occupied apartments: 5,427
% of renters here:
30%
State:
33%
March 2022 cost of living index in zip code 85382: 101.5 (near average, U.S. average is 100)
Land area: 9.8 sq. mi. Water area: 0.1 sq. mi.
Population density: 4,289 people per square mile
(average).
OSM Map
General Map
Google Map
MSN Map
OSM Map
General Map
Google Map
MSN Map
OSM Map
General Map
Google Map
MSN Map
OSM Map
General Map
Google Map
MSN Map
Please wait while loading the map...
Real estate property taxes paid for housing units in 2022:
This zip code:
0.4% ($1,945)
Arizona:
0.4% ($1,786)
Median real estate property taxes paid for housing units with mortgages in 2022: $1,918 (0.4%) Median real estate property taxes paid for housing units with no mortgage in 2022: $2,027 (0.5%)
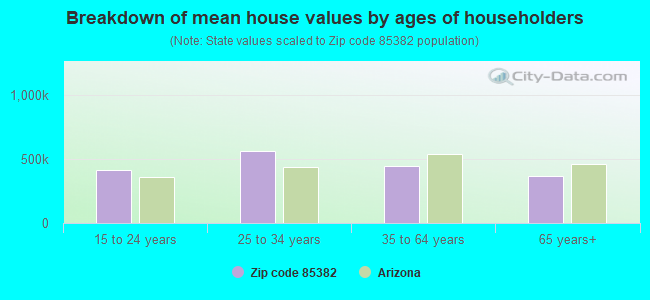
Estimated median house/condo value in 2022: $457,944
85382:
$457,944
Arizona:
$402,800
According to our research of Arizona and other state lists, there were 30 registered sex offenders living in 85382 zip code as of April 27, 2024. The ratio of all residents to sex offenders in zip code 85382 is 1,342 to 1. The ratio of registered sex offenders to all residents in this zip code is lower than the state average.
Median resident age:
This zip code:
45.5 years
Arizona median age:
38.8 years
Average household size:
This zip code:
2.3 people
Arizona:
2.5 people
Averages for the 2020 tax year for zip code 85382, filed in 2021:
Average Adjusted Gross Income (AGI) in 2020: $70,249 (Individual Income Tax Returns)
Here:
$70,249
State:
$73,499
Salary/wage: $62,475 (reported on 75.5% of returns)
Here:
$62,475
State:
$59,499
(% of AGI for various income ranges: 1105.4% for AGIs below $25k, 3484.9% for AGIs $25k-50k, 6469.6% for AGIs $50k-75k, 9807.4% for AGIs $75k-100k, 18665.1% for AGIs $100k-200k, 64448.3% for AGIs over 200k)
Taxable interest for individuals: $1,280 (reported on 30.9% of returns)
This zip code:
$1,280
Arizona:
$2,325
(% of AGI for various income ranges: 21.6% for AGIs below $25k, 28.8% for AGIs $25k-50k, 57.7% for AGIs $50k-75k, 89.2% for AGIs $75k-100k, 102.0% for AGIs $100k-200k, 740.4% for AGIs over 200k)
Ordinary dividends: $5,391 (reported on 21.7% of returns)
Here:
$5,391
State:
$8,711
(% of AGI for various income ranges: 45.1% for AGIs below $25k, 59.1% for AGIs $25k-50k, 142.0% for AGIs $50k-75k, 230.8% for AGIs $75k-100k, 359.2% for AGIs $100k-200k, 2848.3% for AGIs over 200k)
Net capital gain/loss in AGI: +$14,944 (reported on 20.6% of returns)
Here:
+$14,944
State:
+$31,332
(% of AGI for various income ranges: 12.5% for AGIs below $25k, 28.9% for AGIs $25k-50k, 118.9% for AGIs $50k-75k, 229.0% for AGIs $75k-100k, 604.9% for AGIs $100k-200k, 18600.0% for AGIs over 200k)
Profit/loss from business: +$11,036 (reported on 15.1% of returns)
Here:
+$11,036
State:
+$13,214
(% of AGI for various income ranges: 121.1% for AGIs below $25k, 192.7% for AGIs $25k-50k, 242.2% for AGIs $50k-75k, 342.8% for AGIs $75k-100k, 443.4% for AGIs $100k-200k, 1600.4% for AGIs over 200k)
Taxable individual retirement arrangement distribution: $18,557 (reported on 13.4% of returns)
85382:
$18,557
Arizona:
$23,364
(% of AGI for various income ranges: 111.2% for AGIs below $25k, 175.1% for AGIs $25k-50k, 371.5% for AGIs $50k-75k, 572.3% for AGIs $75k-100k, 919.4% for AGIs $100k-200k, 2627.5% for AGIs over 200k)
Self-employed (Keogh) retirement plans: $14,717 (reported on 0.3% of returns)
85382:
$14,717
Arizona:
$26,938
(% of AGI for various income ranges: 4.1% for AGIs below $25k, 34.7% for AGIs $100k-200k)
Total itemized deductions: $31,549 (reported on 10.2% of returns)
Here:
$31,549
State:
$36,308
(% of AGI for various income ranges: 113.6% for AGIs below $25k, 170.4% for AGIs $25k-50k, 453.8% for AGIs $50k-75k, 643.3% for AGIs $75k-100k, 1066.3% for AGIs $100k-200k, 6692.9% for AGIs over 200k)
Charity contributions: $7,482 (reported on 8.6% of returns)
Here:
$7,482
State:
$11,955
(% of AGI for various income ranges: 6.9% for AGIs below $25k, 19.7% for AGIs $25k-50k, 66.0% for AGIs $50k-75k, 121.7% for AGIs $75k-100k, 274.0% for AGIs $100k-200k, 1546.7% for AGIs over 200k)
Taxes paid: $5,691 (reported on 10.1% of returns)
85382:
$5,691
State:
$6,820
(% of AGI for various income ranges: 9.8% for AGIs below $25k, 21.2% for AGIs $25k-50k, 71.9% for AGIs $50k-75k, 121.5% for AGIs $75k-100k, 251.6% for AGIs $100k-200k, 1026.7% for AGIs over 200k)
Earned income credit: $2,142 (reported on 9.8% of returns)
Here:
$2,142
State:
$2,383
(% of AGI for various income ranges: 62.4% for AGIs below $25k, 51.5% for AGIs $25k-50k, 1.1% for AGIs $50k-75k)
Percentage of individuals using paid preparers for their 2020 taxes: 92.5%
Here:
92%
State:
93%
(% for various income ranges: 90.8% for AGIs below $25k, 93.4% for AGIs $25k-50k, 92.2% for AGIs $50k-75k, 92.1% for AGIs $75k-100k, 94.0% for AGIs $100k-200k, 93.8% for AGIs over 200k)
Averages for the 2012 tax year for zip code 85382, filed in 2013:
Average Adjusted Gross Income (AGI) in 2012: $58,833 (Individual Income Tax Returns)
Here:
$58,833
State:
$57,644
Salary/wage: $53,677 (reported on 77.4% of returns)
Here:
$53,677
State:
$47,932
(% of AGI for various income ranges: 66.2% for AGIs below $25k, 70.0% for AGIs $25k-50k, 69.6% for AGIs $50k-75k, 73.6% for AGIs $75k-100k, 75.3% for AGIs $100k-200k, 55.9% for AGIs over 200k)
Taxable interest for individuals: $1,279 (reported on 37.6% of returns)
This zip code:
$1,279
Arizona:
$2,064
(% of AGI for various income ranges: 1.9% for AGIs below $25k, 0.9% for AGIs $25k-50k, 0.8% for AGIs $50k-75k, 0.7% for AGIs $75k-100k, 0.7% for AGIs $100k-200k, 0.8% for AGIs over 200k)
Ordinary dividends: $4,361 (reported on 23.2% of returns)
Here:
$4,361
State:
$7,268
(% of AGI for various income ranges: 2.9% for AGIs below $25k, 1.9% for AGIs $25k-50k, 1.6% for AGIs $50k-75k, 1.4% for AGIs $75k-100k, 1.5% for AGIs $100k-200k, 1.9% for AGIs over 200k)
Net capital gain/loss in AGI: +$3,429 (reported on 19.4% of returns)
Here:
+$3,429
State:
+$15,530
(% of AGI for various income ranges: 0.1% for AGIs $25k-50k, 0.3% for AGIs $50k-75k, 0.6% for AGIs $75k-100k, 1.1% for AGIs $100k-200k, 6.2% for AGIs over 200k)
Profit/loss from business: +$10,350 (reported on 14.2% of returns)
Here:
+$10,350
State:
+$12,323
(% of AGI for various income ranges: 6.6% for AGIs below $25k, 3.2% for AGIs $25k-50k, 2.6% for AGIs $50k-75k, 1.7% for AGIs $75k-100k, 2.0% for AGIs $100k-200k, 1.9% for AGIs over 200k)
Taxable individual retirement arrangement distribution: $15,160 (reported on 16.3% of returns)
85382:
$15,160
Arizona:
$18,280
(% of AGI for various income ranges: 6.0% for AGIs below $25k, 4.6% for AGIs $25k-50k, 4.0% for AGIs $50k-75k, 4.1% for AGIs $75k-100k, 3.9% for AGIs $100k-200k, 4.1% for AGIs over 200k)
Self-employment retirement plans: $13,300 (reported on 0.3% of returns)
85382:
$13,300
Arizona:
$22,154
Total itemized deductions: $19,888 (23% of AGI, reported on 42.9% of returns)
Here:
$19,888
State:
$23,651
Here:
22.6% of AGI
State:
20.6% of AGI
(% of AGI for various income ranges: 18.6% for AGIs below $25k, 14.4% for AGIs $25k-50k, 14.5% for AGIs $50k-75k, 14.8% for AGIs $75k-100k, 14.4% for AGIs $100k-200k, 11.7% for AGIs over 200k)
Charity contributions: $3,247 (reported on 37.2% of returns)
Here:
$3,247
State:
$4,114
(% of AGI for various income ranges: 1.4% for AGIs below $25k, 1.6% for AGIs $25k-50k, 1.9% for AGIs $50k-75k, 2.1% for AGIs $75k-100k, 2.3% for AGIs $100k-200k, 2.5% for AGIs over 200k)
Taxes paid: $4,774 (reported on 42.8% of returns)
85382:
$4,774
State:
$6,509
(% of AGI for various income ranges: 2.7% for AGIs below $25k, 2.5% for AGIs $25k-50k, 2.9% for AGIs $50k-75k, 3.5% for AGIs $75k-100k, 4.1% for AGIs $100k-200k, 4.4% for AGIs over 200k)
Earned income credit: $1,943 (reported on 11.3% of returns)
Here:
$1,943
State:
$2,432
(% of AGI for various income ranges: 4.1% for AGIs below $25k, 0.8% for AGIs $25k-50k)
Percentage of individuals using paid preparers for their 2012 taxes: 49.5%
Here:
50%
State:
52%
(% for various income ranges: 43.0% for AGIs below $25k, 48.0% for AGIs $25k-50k, 53.1% for AGIs $50k-75k, 53.0% for AGIs $75k-100k, 55.9% for AGIs $100k-200k, 70.6% for AGIs over 200k)
Averages for the 2004 tax year for zip code 85382, filed in 2005:
Average Adjusted Gross Income (AGI) in 2004: $53,773 (Individual Income Tax Returns)
Here:
$53,773
State:
$50,097
Salary/wage: $49,543 (reported on 78.2% of returns)
Here:
$49,543
State:
$42,146
(% of AGI for various income ranges: 160.4% for AGIs below $10k, 61.9% for AGIs $10k-25k, 70.2% for AGIs $25k-50k, 75.1% for AGIs $50k-75k, 78.7% for AGIs $75k-100k, 67.0% for AGIs over 100k)
Taxable interest for individuals: $1,800 (reported on 54.1% of returns)
This zip code:
$1,800
Arizona:
$2,374
(% of AGI for various income ranges: 16.1% for AGIs below $10k, 4.5% for AGIs $10k-25k, 2.4% for AGIs $25k-50k, 1.4% for AGIs $50k-75k, 1.1% for AGIs $75k-100k, 1.5% for AGIs over 100k)
Taxable dividends: $3,214 (reported on 30.7% of returns)
Here:
$3,214
State:
$3,888
(% of AGI for various income ranges: 11.4% for AGIs below $10k, 3.6% for AGIs $10k-25k, 2.2% for AGIs $25k-50k, 1.4% for AGIs $50k-75k, 1.2% for AGIs $75k-100k, 1.9% for AGIs over 100k)
Net capital gain/loss: +$6,582 (reported on 26.4% of returns)
Here:
+$6,582
State:
+$17,569
(% of AGI for various income ranges: -5.1% for AGIs below $10k, 0.2% for AGIs $10k-25k, 0.6% for AGIs $25k-50k, 0.7% for AGIs $50k-75k, 1.3% for AGIs $75k-100k, 8.1% for AGIs over 100k)
Profit/loss from business: +$10,248 (reported on 14.2% of returns)
Here:
+$10,248
State:
+$11,088
(% of AGI for various income ranges: 7.4% for AGIs below $10k, 5.0% for AGIs $10k-25k, 2.6% for AGIs $25k-50k, 2.0% for AGIs $50k-75k, 2.2% for AGIs $75k-100k, 3.0% for AGIs over 100k)
IRA payment deduction: $3,108 (reported on 2.6% of returns)
85382:
$3,108
Arizona:
$3,023
(% of AGI for various income ranges: 0.5% for AGIs below $10k, 0.2% for AGIs $10k-25k, 0.3% for AGIs $25k-50k, 0.1% for AGIs $50k-75k, 0.1% for AGIs $75k-100k, 0.1% for AGIs over 100k)
Self-employed pension: $9,767 (reported on 0.6% of returns)
Here:
$9,767
Arizona:
$15,785
(% of AGI for various income ranges: 0.1% for AGIs $25k-50k, 0.1% for AGIs $50k-75k, 0.0% for AGIs $75k-100k, 0.2% for AGIs over 100k)
Total itemized deductions: $17,880 (24% of AGI, reported on 55.8% of returns)
Here:
$17,880
State:
$19,781
Here:
24.2% of AGI
State:
21.8% of AGI
(% of AGI for various income ranges: 49.9% for AGIs below $10k, 21.9% for AGIs $10k-25k, 19.8% for AGIs $25k-50k, 19.5% for AGIs $50k-75k, 19.1% for AGIs $75k-100k, 15.7% for AGIs over 100k)
Charity contributions deductions: $2,655 (3% of AGI, reported on 50.5% of returns)
Here:
$2,655
State:
$3,389
Here:
3.5% of AGI
State:
3.5% of AGI
(% of AGI for various income ranges: 3.0% for AGIs below $10k, 2.0% for AGIs $10k-25k, 2.2% for AGIs $25k-50k, 2.2% for AGIs $50k-75k, 2.5% for AGIs $75k-100k, 2.9% for AGIs over 100k)
Total tax: $6,885 (reported on 82.9% of returns)
85382:
$6,885
State:
$8,323
(% of AGI for various income ranges: 4.6% for AGIs below $10k, 4.0% for AGIs $10k-25k, 6.8% for AGIs $25k-50k, 8.6% for AGIs $50k-75k, 9.9% for AGIs $75k-100k, 15.6% for AGIs over 100k)
Earned income credit: $1,532 (reported on 6.9% of returns)
Here:
$1,532
State:
$1,786
Percentage of individuals using paid preparers for their 2004 taxes: 57.3%
Here:
57%
State:
60%
(% for various income ranges: 49.6% for AGIs below $10k, 56.9% for AGIs $10k-25k, 56.7% for AGIs $25k-50k, 59.1% for AGIs $50k-75k, 58.9% for AGIs $75k-100k, 63.0% for AGIs over 100k)
Likely homosexual households (counted as self-reported same-sex unmarried-partner households)
Lesbian couples: 0.2% of all households
Gay men: 0.1% of all households
Household received Food Stamps/SNAP in the past 12 months: 1,064 Household did not receive Food Stamps/SNAP in the past 12 months: 16,754
Women who had a birth in the past 12 months: 348 (297 now married, 55 unmarried) Women who did not have a birth in the past 12 months: 8,738 (3,883 now married, 4,840 unmarried)
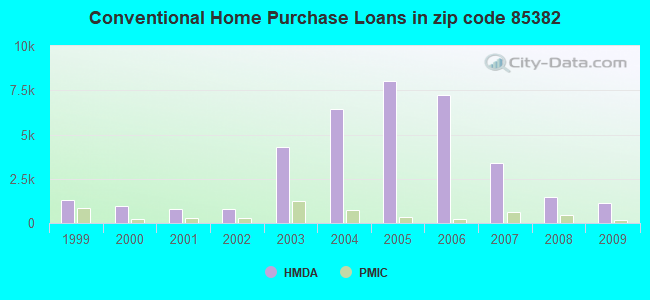
Housing units in zip code 85382 with a mortgage: 8,411 (610 second mortgage, 40 home equity loan, 448 both second mortgage and home equity loan) Houses without a mortgage: 74
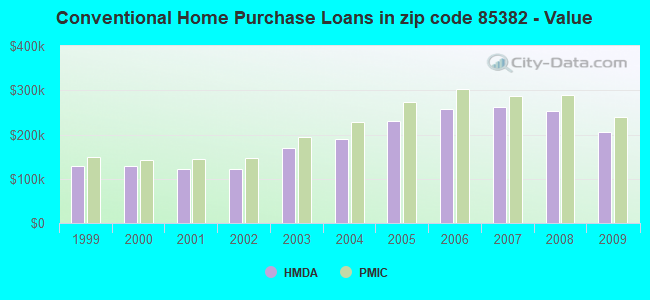
Median monthly owner costs for units with a mortgage: $1,759 Median monthly owner costs for units without a mortgage: $492
Residents with income below the poverty level in 2022:
This zip code:
8.6%
Whole state:
12.5%
Residents with income below 50% of the poverty level in 2022:
This zip code:
2.9%
Whole state:
6.0%
Median number of rooms in houses and condos:
Here:
6.0
State:
6.0
Median number of rooms in apartments:
Here:
4.1
State:
4.1
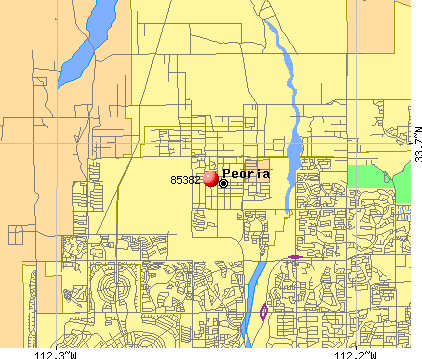
Notable locations in this zip code not listed on our city pages
Notable locations in zip code 85382: Peoria Public Library Sunrise Mountain Branch (A), Greenway Sports Complex (B), Peoria Fire Department Station 192 (C). Display/hide their locations on the map
5,490 married couples with children.
1,726 single-parent households (298 men, 1,428 women).
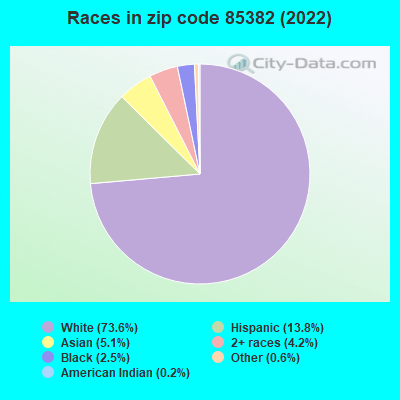
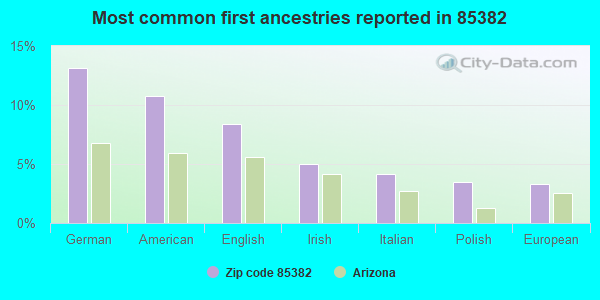
85.6% of residents of 85382 zip code speak English at home.
6.2% of residents speak Spanish at home (67% very well, 21% well, 9% not well, 3% not at all).
2.4% of residents speak other Indo-European language at home (74% very well, 9% well, 15% not well, 2% not at all).
3.5% of residents speak Asian or Pacific Island language at home (48% very well, 23% well, 19% not well, 9% not at all).
2.9% of residents speak other language at home (60% very well, 27% well, 13% not well).
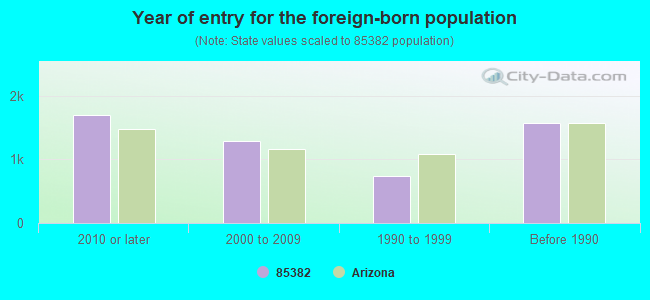
Foreign born population: 4,860 (11.5%) (64.3% of them are naturalized citizens)
Major facilities with environmental interests located in this zip code:
BIDDULPH ARROWHEAD LLC (8424 W BELL RD in PEORIA, AZ)
STATE MASTER (Arizona's Tracking Of The Environment) - AZURITE-6053, AIR PROGRAM Conditionally Exempt Small Quantity Generators, less than 100 kg/month of hazardous waste (Resource Conservation and Recovery Act (tracking hazardous waste)) - notification Organizations: KEMP BIDDULPH (CONTACT/OWNER)
Alternative names: BIDDULPH ARROWHEAD INC, BIDDULPH OLDSMOBILE IZUZU
APACHE ELEMENTARY SCHOOL (8633 W JOHN CABOT RD in PEORIA, AZ)
(Geographic Names Information System) (National Center for Education Statistics) - STATE ID-118 Organizations: PEORIA UNIFIED SCHOOL DISTRICT (SCHOOL DISTRICT)
COYOTE HILLS ELEMENTARY SCHOOL (21180 N. 87TH AVE. in PEORIA, AZ)
(National Center for Education Statistics) - STATE ID-127 Organizations: PEORIA UNIFIED SCHOOL DISTRICT (SCHOOL DISTRICT)
DESERT HARBOR ELEMENTARY SCHOOL (15585 N 91ST AVE in PEORIA, AZ)
(National Center for Education Statistics) - STATE ID-123 Organizations: PEORIA UNIFIED SCHOOL DISTRICT (SCHOOL DISTRICT)
FLETCHER HEIGHTS ELEMENTARY SCHOOL (7877 W. HILLCREST BLVD. in PEORIA, AZ)
(National Center for Education Statistics) - STATE ID-101 Organizations: NOBEL LEARNING COMMUNITIES, INC. (SCHOOL DISTRICT)
FRONTIER ELEMENTARY (21258 N 81ST AVE in PEORIA, AZ)
(National Center for Education Statistics) - STATE ID-125 Organizations: PEORIA UNIFIED SCHOOL DISTRICT (SCHOOL DISTRICT)
ZUNI HILLS ELEMENTARY SCHOOL (10851 W. WILLIAMS RD in PEORIA, AZ)
(National Center for Education Statistics) - STATE ID-128 Organizations: PEORIA UNIFIED SCHOOL DISTRICT (SCHOOL DISTRICT)
EMBASSY CLEANERS (8960 W BELL RD STE 109 in PEORIA, AZ)
(Resource Conservation and Recovery Act (tracking hazardous waste)) Organizations: L. D. INC (CONTACT/OPERATOR)
, MAGIC TOUCH CLEANERS CORP (CONTACT/OWNER)
, R&L 91ST & BELL LLC PERSONAL TOUCH PROPE (CONTACT/OWNER)
Alternative names: MAGIC TOUCH CLEANERS INC
FAST 1 HOUR FOTO (3602 W BELL RD in PEORIA, AZ)
(Resource Conservation and Recovery Act (tracking hazardous waste)) Organizations: FAST FOTO INC (CONTACT/OWNER)
ECONO LUBE N TUNE 350 (8880 W BELL RD in PEORIA, AZ)
(Resource Conservation and Recovery Act (tracking hazardous waste)) Organizations: SCOTT WALLIN (CONTACT/OWNER)
BRANDON'S FRONTIER CLEANERS (8385 W DEER VALLEY RD STE#116 in PEORIA, AZ)
Small Quantity Generators, between 100 kg and 1000 kg of hazardous waste/month (Resource Conservation and Recovery Act (tracking hazardous waste)) Organizations: BRANDON BORAN (CONTACT/OWNER)
FRYS FOOD & DRUG #74 (8375 W DEER VALLEY RD in PEORIA, AZ)
Conditionally Exempt Small Quantity Generators, less than 100 kg/month of hazardous waste (Resource Conservation and Recovery Act (tracking hazardous waste)) Organizations: FRYS FOOD AND DRUG (CONTACT/OPERATOR)
, KROGER CO (CONTACT/OWNER)
GOODWRENCH AUTO BODY (17311 N 91ST AVE in PEORIA, AZ)
Conditionally Exempt Small Quantity Generators, less than 100 kg/month of hazardous waste (Resource Conservation and Recovery Act (tracking hazardous waste)) Organizations: PEORIA PONTIAC GMC INC (CONTACT/OWNER)
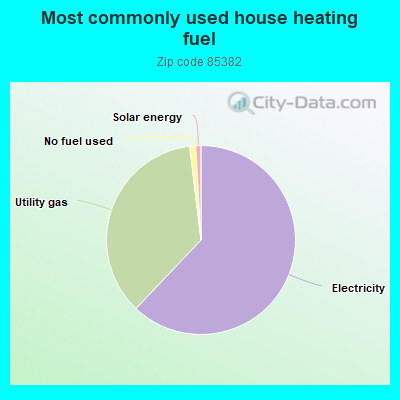
Housing units lacking complete plumbing facilities: 0.4% Housing units lacking complete kitchen facilities: 1.2%
61.9%Electricity
35.9%Utility gas
1.0%No fuel used
0.9%Solar energy
Population in 1990: 1,738. Population change in the 1990s: +35,837 (+2062.0%).
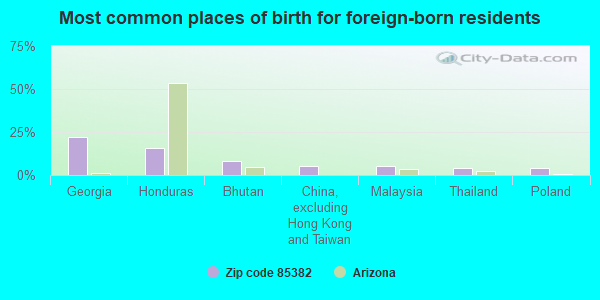
Place of birth for U.S.-born residents:
This state: 14,130
Northeast: 3,342
Midwest: 9,436
South: 2,756
West: 7,233
30% of the 85382 zip code residents lived in the same house 5 years ago. Out of people who lived in different houses, 64% lived in this county. Out of people who lived in different counties, 50% lived in Arizona.
86% of the 85382 zip code residents lived in the same house 1 year ago. Out of people who lived in different houses, 63% moved from this county. Out of people who lived in different houses, 3% moved from different county within same state. Out of people who lived in different houses, 30% moved from different state. Out of people who lived in different houses, 1% moved from abroad.
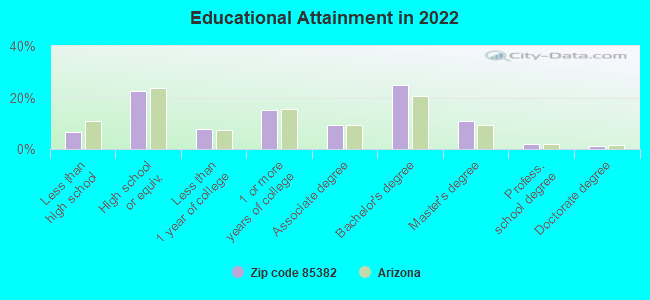
Private vs. public school enrollment:
Students in private schools in grades 1 to 8 (elementary and middle school): 365
Here:
10.0%
Arizona:
10.4%
Students in private schools in grades 9 to 12 (high school): 84
Here:
4.2%
Arizona:
8.8%
Students in private undergraduate colleges: 430
Here:
22.9%
Arizona:
13.1%
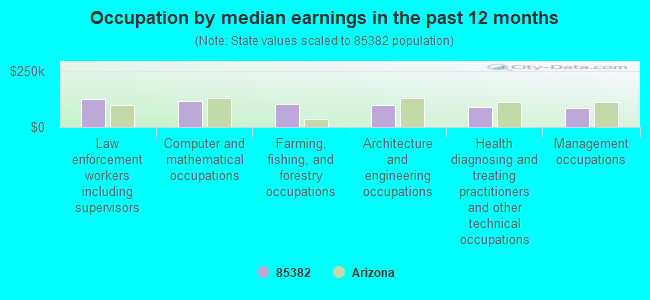
Occupation by median earnings in the past 12 months ($)
124,820Law enforcement workers including supervisors
115,328Computer and mathematical occupations
101,342Farming, fishing, and forestry occupations
98,847Architecture and engineering occupations
88,914Health diagnosing and treating practitioners and other technical occupations
84,807Management occupations
Companies with federal contracts located in this zip code (PEORIA, AZ):
CONSPECO, INC (8615 WEST KELTON LANE; small business) : $1,565,345 in 3 contractsfrom 2000 to 2003
$1,263,845 with Air Force for Construction of Structures and Facilities -- Other Airfield Structures. Signed on 2000-09-08. Completion date: 2001-07-05.
$293,400 with Air Force for Maintenance, Repair or Alteration of Real Property -- Sewage and Waste Facilities. Signed on 2003-09-08. Completion date: 2004-04-19.
$8,100 with Air Force for Construction of Structures and Facilities -- Other Airfield Structures. Signed on 2001-09-10. Completion date: 2001-11-16.
ENGLISH, ALAN (9179 W CHARLESTON AVE; small business)
$103,008 with Navy for Engineering and Technical Services. Signed on 2003-09-30. Completion date: 2004-10-05.
AN CHEVROLET ARROWHEAD INC (9055 W BELL RD)
$11,434 with Air Force for Maintenance, Repair and Rebuilding of Equipment -- Ground Effect Vehicles, Motor Vehicles, Trailers, and Cycles. Signed on 2006-05-26. Completion date: 2006-07-25.
KENNTH E FINKEN II (10621 W LOUISE DR; small business)
$3,995 with Air Force for Maintenance, Repair or Alteration of Real Property -- Office Buildings. Signed on 2002-05-13. Completion date: 2002-06-12.
Top industries in this zip code by the number of employees in 2005:
2004 - 2018 National Fire Incident Reporting System (NFIRS) incidents
Based on the data from the years 2004 - 2018 the average number of fire incidents per year is 10. The highest number of reported fires - 36 took place in 2007, and the least - 0 in 2005. The data has a growing trend.
When looking into fire subcategories, the most incidents belonged to: Structure Fires (47.4%), and Outside Fires (25.3%).
Fire incident types reported to NFIRS in Zip Code 85382

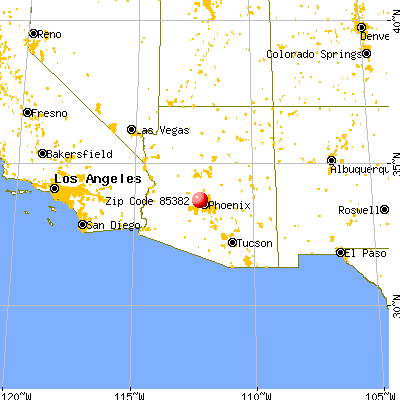


 Nearest zip codes: 85381, 85373, 85351, 85308, 85306, 85345.
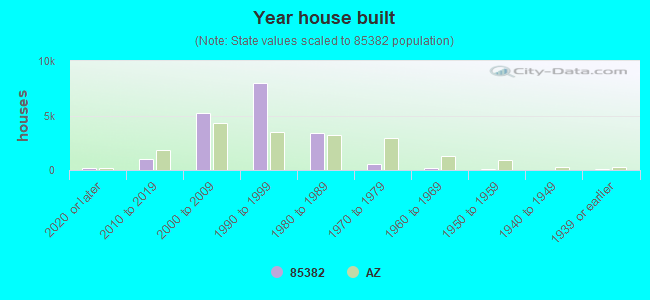


 Based on the data from the years 2004 - 2018 the average number of fire incidents per year is 10. The highest number of reported fires - 36 took place in 2007, and the least - 0 in 2005. The data has a growing trend.
 When looking into fire subcategories, the most incidents belonged to: Structure Fires (47.4%), and Outside Fires (25.3%).