Estimated zip code population in 2022: 63,411 Zip code population in 2010: 56,208 Zip code population in 2000: 52,752
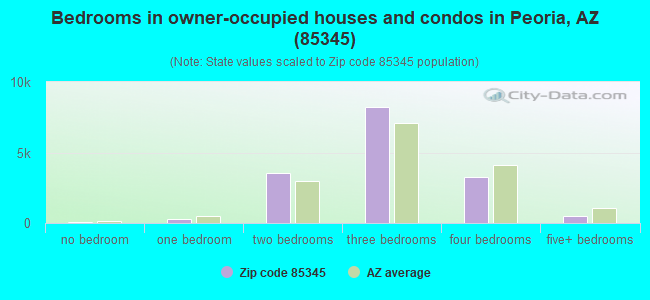
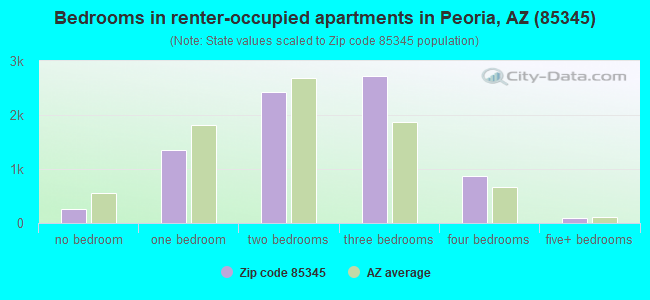
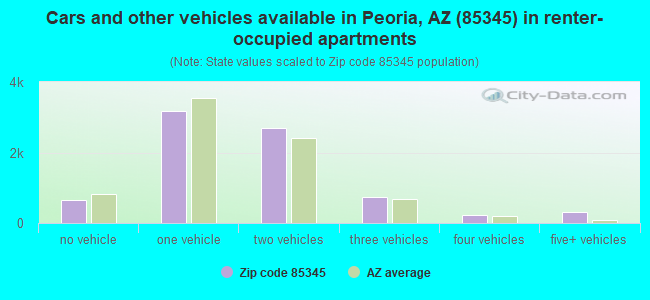
Houses and condos: 24,695 Renter-occupied apartments: 7,725
% of renters here:
33%
State:
33%
March 2022 cost of living index in zip code 85345: 100.1 (near average, U.S. average is 100)
Land area: 13.0 sq. mi. Water area: 0.0 sq. mi.
Population density: 4,859 people per square mile
(average).
OSM Map
General Map
Google Map
MSN Map
OSM Map
General Map
Google Map
MSN Map
OSM Map
General Map
Google Map
MSN Map
OSM Map
General Map
Google Map
MSN Map
Please wait while loading the map...
Real estate property taxes paid for housing units in 2022:
This zip code:
0.3% ($1,057)
Arizona:
0.4% ($1,786)
Median real estate property taxes paid for housing units with mortgages in 2022: $1,177 (0.3%) Median real estate property taxes paid for housing units with no mortgage in 2022: $815 (0.3%)
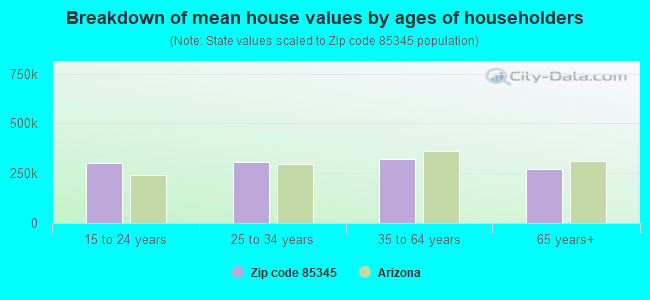
Estimated median house/condo value in 2022: $312,063
85345:
$312,063
Arizona:
$402,800
According to our research of Arizona and other state lists, there were 54 registered sex offenders living in 85345 zip code as of April 27, 2024. The ratio of all residents to sex offenders in zip code 85345 is 1,087 to 1. The ratio of registered sex offenders to all residents in this zip code is lower than the state average.
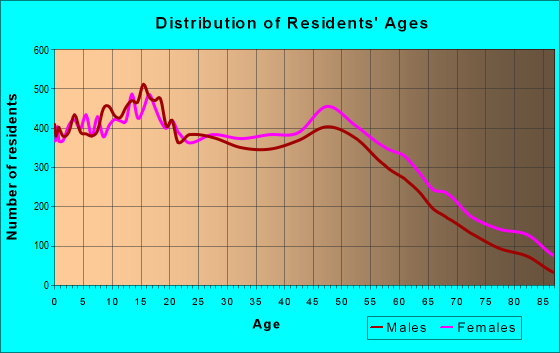
Median resident age:
This zip code:
37.4 years
Arizona median age:
38.8 years
Average household size:
This zip code:
2.7 people
Arizona:
2.5 people
Averages for the 2020 tax year for zip code 85345, filed in 2021:
Average Adjusted Gross Income (AGI) in 2020: $46,890 (Individual Income Tax Returns)
Here:
$46,890
State:
$73,499
Salary/wage: $44,715 (reported on 85.6% of returns)
Here:
$44,715
State:
$59,499
(% of AGI for various income ranges: 1179.9% for AGIs below $25k, 3900.7% for AGIs $25k-50k, 7300.2% for AGIs $50k-75k, 11266.9% for AGIs $75k-100k, 20009.2% for AGIs $100k-200k, 58430.0% for AGIs over 200k)
Taxable interest for individuals: $602 (reported on 13.6% of returns)
This zip code:
$602
Arizona:
$2,325
(% of AGI for various income ranges: 5.4% for AGIs below $25k, 3.9% for AGIs $25k-50k, 12.0% for AGIs $50k-75k, 23.0% for AGIs $75k-100k, 54.3% for AGIs $100k-200k, 323.3% for AGIs over 200k)
Ordinary dividends: $2,106 (reported on 7.1% of returns)
Here:
$2,106
State:
$8,711
(% of AGI for various income ranges: 7.0% for AGIs below $25k, 8.0% for AGIs $25k-50k, 22.1% for AGIs $50k-75k, 35.6% for AGIs $75k-100k, 81.8% for AGIs $100k-200k, 1363.3% for AGIs over 200k)
Net capital gain/loss in AGI: +$5,228 (reported on 7.2% of returns)
Here:
+$5,228
State:
+$31,332
(% of AGI for various income ranges: 4.1% for AGIs below $25k, 9.6% for AGIs $25k-50k, 25.2% for AGIs $50k-75k, 78.2% for AGIs $75k-100k, 319.6% for AGIs $100k-200k, 5918.3% for AGIs over 200k)
Profit/loss from business: +$8,755 (reported on 14.0% of returns)
Here:
+$8,755
State:
+$13,214
(% of AGI for various income ranges: 128.5% for AGIs below $25k, 124.9% for AGIs $25k-50k, 158.6% for AGIs $50k-75k, 232.4% for AGIs $75k-100k, 406.5% for AGIs $100k-200k, 3566.7% for AGIs over 200k)
Taxable individual retirement arrangement distribution: $12,660 (reported on 4.9% of returns)
85345:
$12,660
Arizona:
$23,364
(% of AGI for various income ranges: 36.0% for AGIs below $25k, 46.7% for AGIs $25k-50k, 93.3% for AGIs $50k-75k, 158.3% for AGIs $75k-100k, 333.5% for AGIs $100k-200k, 2770.0% for AGIs over 200k)
Total itemized deductions: $26,828 (reported on 4.1% of returns)
Here:
$26,828
State:
$36,308
(% of AGI for various income ranges: 29.2% for AGIs below $25k, 75.1% for AGIs $25k-50k, 157.8% for AGIs $50k-75k, 352.2% for AGIs $75k-100k, 726.5% for AGIs $100k-200k, 5593.3% for AGIs over 200k)
Charity contributions: $6,678 (reported on 3.2% of returns)
Here:
$6,678
State:
$11,955
(% of AGI for various income ranges: 1.9% for AGIs below $25k, 9.6% for AGIs $25k-50k, 23.3% for AGIs $50k-75k, 55.0% for AGIs $75k-100k, 199.2% for AGIs $100k-200k, 1671.7% for AGIs over 200k)
Taxes paid: $4,505 (reported on 4.0% of returns)
85345:
$4,505
State:
$6,820
(% of AGI for various income ranges: 3.3% for AGIs below $25k, 9.2% for AGIs $25k-50k, 27.3% for AGIs $50k-75k, 65.8% for AGIs $75k-100k, 141.4% for AGIs $100k-200k, 853.3% for AGIs over 200k)
Earned income credit: $2,334 (reported on 20.2% of returns)
Here:
$2,334
State:
$2,383
(% of AGI for various income ranges: 105.0% for AGIs below $25k, 76.0% for AGIs $25k-50k, 1.6% for AGIs $50k-75k)
Percentage of individuals using paid preparers for their 2020 taxes: 93.1%
Here:
93%
State:
93%
(% for various income ranges: 92.0% for AGIs below $25k, 94.0% for AGIs $25k-50k, 93.8% for AGIs $50k-75k, 93.2% for AGIs $75k-100k, 92.3% for AGIs $100k-200k, 94.7% for AGIs over 200k)
Averages for the 2012 tax year for zip code 85345, filed in 2013:
Average Adjusted Gross Income (AGI) in 2012: $39,589 (Individual Income Tax Returns)
Here:
$39,589
State:
$57,644
Salary/wage: $37,652 (reported on 87.8% of returns)
Here:
$37,652
State:
$47,932
(% of AGI for various income ranges: 77.8% for AGIs below $25k, 87.4% for AGIs $25k-50k, 84.8% for AGIs $50k-75k, 84.9% for AGIs $75k-100k, 81.4% for AGIs $100k-200k, 56.9% for AGIs over 200k)
Taxable interest for individuals: $570 (reported on 19.0% of returns)
This zip code:
$570
Arizona:
$2,064
(% of AGI for various income ranges: 0.4% for AGIs below $25k, 0.2% for AGIs $25k-50k, 0.3% for AGIs $50k-75k, 0.3% for AGIs $75k-100k, 0.2% for AGIs $100k-200k, 0.9% for AGIs over 200k)
Ordinary dividends: $1,678 (reported on 8.6% of returns)
Here:
$1,678
State:
$7,268
(% of AGI for various income ranges: 0.6% for AGIs below $25k, 0.2% for AGIs $25k-50k, 0.3% for AGIs $50k-75k, 0.3% for AGIs $75k-100k, 0.5% for AGIs $100k-200k, 0.5% for AGIs over 200k)
Net capital gain/loss in AGI: +$2,243 (reported on 6.3% of returns)
Here:
+$2,243
State:
+$15,530
(% of AGI for various income ranges: 0.1% for AGIs $25k-50k, 0.2% for AGIs $50k-75k, 0.2% for AGIs $75k-100k, 0.7% for AGIs $100k-200k, 8.2% for AGIs over 200k)
Profit/loss from business: +$7,790 (reported on 11.9% of returns)
Here:
+$7,790
State:
+$12,323
(% of AGI for various income ranges: 7.8% for AGIs below $25k, 1.7% for AGIs $25k-50k, 1.4% for AGIs $50k-75k, 1.0% for AGIs $75k-100k, 1.7% for AGIs $100k-200k)
Taxable individual retirement arrangement distribution: $10,767 (reported on 6.4% of returns)
85345:
$10,767
Arizona:
$18,280
(% of AGI for various income ranges: 2.2% for AGIs below $25k, 1.3% for AGIs $25k-50k, 1.4% for AGIs $50k-75k, 1.6% for AGIs $75k-100k, 2.9% for AGIs $100k-200k)
Total itemized deductions: $16,101 (25% of AGI, reported on 25.1% of returns)
Here:
$16,101
State:
$23,651
Here:
24.6% of AGI
State:
20.6% of AGI
(% of AGI for various income ranges: 6.9% for AGIs below $25k, 8.8% for AGIs $25k-50k, 10.8% for AGIs $50k-75k, 11.5% for AGIs $75k-100k, 13.0% for AGIs $100k-200k, 12.2% for AGIs over 200k)
Charity contributions: $2,534 (reported on 20.0% of returns)
Here:
$2,534
State:
$4,114
(% of AGI for various income ranges: 0.6% for AGIs below $25k, 0.8% for AGIs $25k-50k, 1.3% for AGIs $50k-75k, 1.7% for AGIs $75k-100k, 2.1% for AGIs $100k-200k, 2.8% for AGIs over 200k)
Taxes paid: $3,407 (reported on 25.0% of returns)
85345:
$3,407
State:
$6,509
(% of AGI for various income ranges: 0.9% for AGIs below $25k, 1.5% for AGIs $25k-50k, 2.2% for AGIs $50k-75k, 2.6% for AGIs $75k-100k, 3.5% for AGIs $100k-200k, 3.5% for AGIs over 200k)
Earned income credit: $2,402 (reported on 24.6% of returns)
Here:
$2,402
State:
$2,432
(% of AGI for various income ranges: 7.9% for AGIs below $25k, 1.4% for AGIs $25k-50k)
Percentage of individuals using paid preparers for their 2012 taxes: 47.5%
Here:
48%
State:
52%
(% for various income ranges: 45.7% for AGIs below $25k, 46.5% for AGIs $25k-50k, 50.3% for AGIs $50k-75k, 50.8% for AGIs $75k-100k, 54.0% for AGIs $100k-200k, 71.4% for AGIs over 200k)
Averages for the 2004 tax year for zip code 85345, filed in 2005:
Average Adjusted Gross Income (AGI) in 2004: $38,218 (Individual Income Tax Returns)
Here:
$38,218
State:
$50,097
Salary/wage: $36,844 (reported on 90.0% of returns)
Here:
$36,844
State:
$42,146
(% of AGI for various income ranges: 102.3% for AGIs below $10k, 82.7% for AGIs $10k-25k, 89.6% for AGIs $25k-50k, 89.4% for AGIs $50k-75k, 89.6% for AGIs $75k-100k, 73.0% for AGIs over 100k)
Taxable interest for individuals: $737 (reported on 29.8% of returns)
This zip code:
$737
Arizona:
$2,374
(% of AGI for various income ranges: 3.2% for AGIs below $10k, 1.0% for AGIs $10k-25k, 0.5% for AGIs $25k-50k, 0.3% for AGIs $50k-75k, 0.5% for AGIs $75k-100k, 0.7% for AGIs over 100k)
Taxable dividends: $1,093 (reported on 12.2% of returns)
Here:
$1,093
State:
$3,888
(% of AGI for various income ranges: 2.2% for AGIs below $10k, 0.6% for AGIs $10k-25k, 0.3% for AGIs $25k-50k, 0.2% for AGIs $50k-75k, 0.3% for AGIs $75k-100k, 0.4% for AGIs over 100k)
Net capital gain/loss: +$3,577 (reported on 9.6% of returns)
Here:
+$3,577
State:
+$17,569
(% of AGI for various income ranges: -0.4% for AGIs below $10k, 0.1% for AGIs $10k-25k, 0.2% for AGIs $25k-50k, 0.4% for AGIs $50k-75k, 0.8% for AGIs $75k-100k, 4.4% for AGIs over 100k)
Profit/loss from business: +$5,879 (reported on 11.1% of returns)
Here:
+$5,879
State:
+$11,088
(% of AGI for various income ranges: 3.1% for AGIs below $10k, 3.7% for AGIs $10k-25k, 1.6% for AGIs $25k-50k, 1.4% for AGIs $50k-75k, 0.8% for AGIs $75k-100k, 1.9% for AGIs over 100k)
IRA payment deduction: $2,410 (reported on 1.8% of returns)
85345:
$2,410
Arizona:
$3,023
(% of AGI for various income ranges: 0.2% for AGIs below $10k, 0.1% for AGIs $10k-25k, 0.1% for AGIs $25k-50k, 0.1% for AGIs $50k-75k, 0.1% for AGIs $75k-100k, 0.1% for AGIs over 100k)
Self-employed pension: $7,759 (reported on 0.1% of returns)
Here:
$7,759
Arizona:
$15,785
Total itemized deductions: $14,318 (25% of AGI, reported on 40.1% of returns)
Here:
$14,318
State:
$19,781
Here:
24.7% of AGI
State:
21.8% of AGI
(% of AGI for various income ranges: 12.1% for AGIs below $10k, 10.1% for AGIs $10k-25k, 15.1% for AGIs $25k-50k, 16.8% for AGIs $50k-75k, 16.1% for AGIs $75k-100k, 14.8% for AGIs over 100k)
Charity contributions deductions: $1,904 (3% of AGI, reported on 34.2% of returns)
Here:
$1,904
State:
$3,389
Here:
3.2% of AGI
State:
3.5% of AGI
(% of AGI for various income ranges: 0.7% for AGIs below $10k, 0.9% for AGIs $10k-25k, 1.5% for AGIs $25k-50k, 1.9% for AGIs $50k-75k, 2.0% for AGIs $75k-100k, 2.2% for AGIs over 100k)
Total tax: $4,232 (reported on 73.8% of returns)
85345:
$4,232
State:
$8,323
(% of AGI for various income ranges: 2.6% for AGIs below $10k, 3.6% for AGIs $10k-25k, 6.2% for AGIs $25k-50k, 8.1% for AGIs $50k-75k, 9.6% for AGIs $75k-100k, 15.8% for AGIs over 100k)
Earned income credit: $1,732 (reported on 17.9% of returns)
Here:
$1,732
State:
$1,786
Percentage of individuals using paid preparers for their 2004 taxes: 56.7%
Here:
57%
State:
60%
(% for various income ranges: 49.4% for AGIs below $10k, 59.3% for AGIs $10k-25k, 57.4% for AGIs $25k-50k, 57.8% for AGIs $50k-75k, 56.9% for AGIs $75k-100k, 58.1% for AGIs over 100k)
Likely homosexual households (counted as self-reported same-sex unmarried-partner households)
Lesbian couples: 0.2% of all households
Gay men: 0.1% of all households
Household received Food Stamps/SNAP in the past 12 months: 3,137 Household did not receive Food Stamps/SNAP in the past 12 months: 20,520
Women who had a birth in the past 12 months: 774 (435 now married, 333 unmarried) Women who did not have a birth in the past 12 months: 14,448 (5,582 now married, 8,875 unmarried)
Housing units in zip code 85345 with a mortgage: 10,462 (647 second mortgage, 9 home equity loan, 548 both second mortgage and home equity loan) Houses without a mortgage: 72
Median monthly owner costs for units with a mortgage: $1,328 Median monthly owner costs for units without a mortgage: $441
Residents with income below the poverty level in 2022:
This zip code:
13.5%
Whole state:
12.5%
Residents with income below 50% of the poverty level in 2022:
This zip code:
5.5%
Whole state:
6.0%
Median number of rooms in houses and condos:
Here:
5.6
State:
6.0
Median number of rooms in apartments:
Here:
4.5
State:
4.1
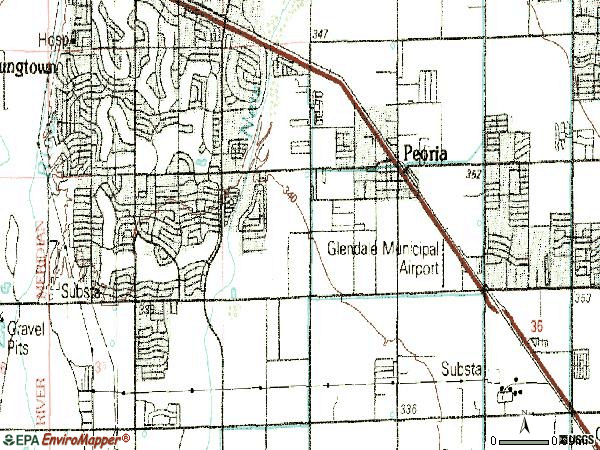
Notable locations in this zip code not listed on our city pages
Notable locations in zip code 85345: Peoria Substation (A), Agua Fria Steam Plant (B), Country Meadows Golf Course (C), Salt River Project Agua Fria Power Plant (D), Maricopa County Community Services (E), Peoria Public Library Main Branch (F), Peoria Town Hall (G), Peoria Fire Department Station 194 (H), Peoria Fire Department Station 191 (I), Peoria Police Department (J). Display/hide their locations on the map
Shopping Centers: Arrowhead Mall (1), Pueblo Plaza Shopping Center (2), Wagoner Plaza Shopping Center (3), Peoria Station Shopping Center (4), Peoria Town Center Shopping Center (5). Display/hide their locations on the map
Churches in zip code 85345 include: Harvest Church Assembly of God (A), First Presbyterian Church of Peoria (B), Emmanuel Pentecostal Holiness Church (C), Covenant Christian Center (D), Church at Cactus (E), Celebration Lutheran Church (F), Calvary Baptist Church (G), Antioch Church of God in Christ (H), Starting Point Church (I). Display/hide their locations on the map
7,177 married couples with children.
4,204 single-parent households (1,005 men, 3,199 women).
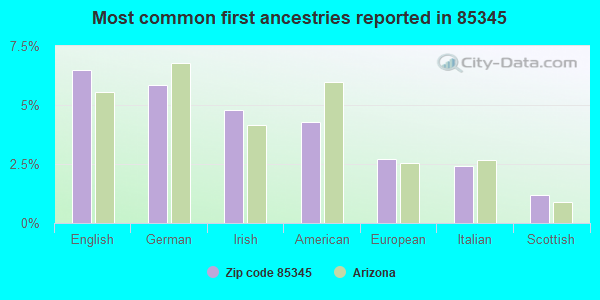
73.7% of residents of 85345 zip code speak English at home.
20.1% of residents speak Spanish at home (73% very well, 15% well, 8% not well, 4% not at all).
1.9% of residents speak other Indo-European language at home (76% very well, 16% well, 5% not well, 3% not at all).
2.9% of residents speak Asian or Pacific Island language at home (55% very well, 25% well, 19% not well, 1% not at all).
1.2% of residents speak other language at home (59% very well, 31% well, 8% not well, 3% not at all).
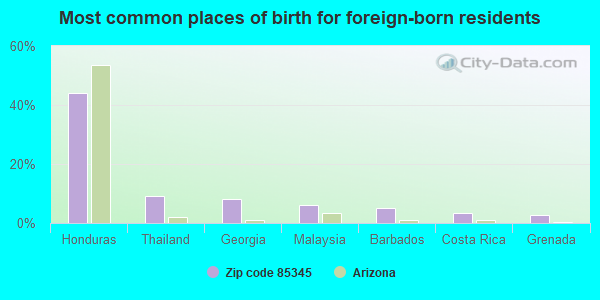
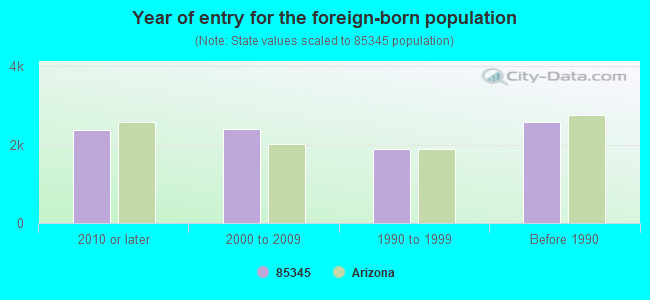
Foreign born population: 8,240 (13.0%) (56.4% of them are naturalized citizens)
Major facilities with environmental interests located in this zip code:
ALTA LOMA ELEMENTARY SCHOOL (9750 N. 87TH AVENUE in PEORIA, AZ)
(Geographic Names Information System) (National Center for Education Statistics) - STATE ID-106 Organizations: PEORIA UNIFIED SCHOOL DISTRICT (SCHOOL DISTRICT)
Alternative names: ALTA LOMA SCHOOL
APS PEORIA CENTRAL STORES (12175 NORTH 91ST AVE in PEORIA, AZ)
(Resource Conservation and Recovery Act (tracking hazardous waste)) Organizations: ARIZONA PUBLIC SERVICE CO (CONTACT/OWNER)
PARAMOUNT ACADEMY (11039 W. OLIVE in PEORIA, AZ)
(National Center for Education Statistics) - STATE ID-102 Organizations: PARAMOUNT EDUCATION STUDIES INC (SCHOOL DISTRICT)
OMBUDSMAN LEARNING CENTER - NORTHWEST (9516 W. PEORIA AVE in PEORIA, AZ)
(National Center for Education Statistics) - STATE ID-006 Organizations: OMBUDSMAN EDUCATIONAL SERVICES, LTD. (SCHOOL DISTRICT)
OASIS HIGH SCHOOL (8632 W. NORTHERN AVE. in PEORIA, AZ)
(National Center for Education Statistics) - STATE ID-002 Organizations: OMEGA SCHOOLS D.B.A. OMEGA ACADEMY, INC. (SCHOOL DISTRICT)
COTTON BOLL SCHOOL (8540 W BUTLER in PEORIA, AZ)
(National Center for Education Statistics) - STATE ID-111 Organizations: PEORIA UNIFIED SCHOOL DISTRICT (SCHOOL DISTRICT)
COUNTRY MEADOWS ELEMENTARY SCHOOL (8409 N. 111TH AVE. in PEORIA, AZ)
(National Center for Education Statistics) - STATE ID-126 Organizations: PEORIA UNIFIED SCHOOL DISTRICT (SCHOOL DISTRICT)
OAKCRAFT INCORPORATED (7733 WEST OLIVE AVE in PEORIA, AZ)
AIR MAJOR (AIRS/AFS) CRITERIA AND HAZARDOUS AIR POLLUTANT INVENTORY (Inventory of air pollution sources) Small Quantity Generators, between 100 kg and 1000 kg of hazardous waste/month (Resource Conservation and Recovery Act (tracking hazardous waste)) - notification TRI REPORTER (Tracking of toxic chemicals releasing facilities) Business SIC classification: WOOD KITCHEN CABINETS Organizations: DANIEL SPITLER (CONTACT/OWNER)
ARCO NO 5291 (9805 W PEORIA AVE in PEORIA, AZ)
(Resource Conservation and Recovery Act (tracking hazardous waste)) Organizations: PLATEAU INC (CONTACT/OWNER)
, SUBURBAN PROPANE GAS CORP (CONTACT/OWNER)
AG TEC INC (BEARSDLEY in PEORIA, AZ)
(Resource Conservation and Recovery Act (tracking hazardous waste)) Organizations: DYER H LEE (CONTACT/OWNER)
WESTERN FARM SERV DESERT DIV (WADDELL RD 1/2 MI W LITCHFIELD in PEORIA, AZ)
(Resource Conservation and Recovery Act (tracking hazardous waste)) Organizations: WESTERN FARM SERVICE INC (CONTACT/OWNER)
ARIZONA AGROCHEMICAL CO (RTE 1 BOX 508 in PEORIA, AZ)
(Resource Conservation and Recovery Act (tracking hazardous waste)) Organizations: CHEMICAL DISTRIBUTORS INCORPORATED (CONTACT/OWNER)
ORBIT CLEANERS AND LAUNDRY (9880 W PEORIA AVE in PEORIA, AZ)
(Resource Conservation and Recovery Act (tracking hazardous waste)) Organizations: ANTHONY MASSAHOS (CONTACT/OWNER)
Housing units lacking complete plumbing facilities: 0.4% Housing units lacking complete kitchen facilities: 1.9%
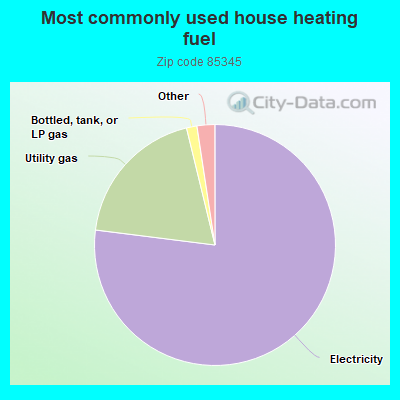
77.0%Electricity
19.2%Utility gas
1.4%Bottled, tank, or LP gas
0.9%Solar energy
0.8%No fuel used
0.6%Other fuel
Population in 1990: 37,607. Population change in the 1990s: +15,145 (+40.3%).
Place of birth for U.S.-born residents:
This state: 28,741
Northeast: 3,452
Midwest: 8,685
South: 3,673
West: 9,549
46% of the 85345 zip code residents lived in the same house 5 years ago. Out of people who lived in different houses, 69% lived in this county. Out of people who lived in different counties, 50% lived in Arizona.
89% of the 85345 zip code residents lived in the same house 1 year ago. Out of people who lived in different houses, 73% moved from this county. Out of people who lived in different houses, 3% moved from different county within same state. Out of people who lived in different houses, 19% moved from different state. Out of people who lived in different houses, 2% moved from abroad.
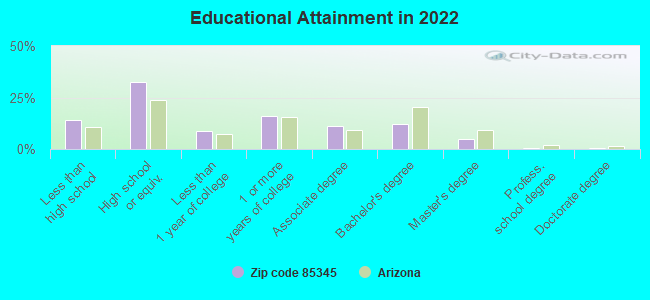
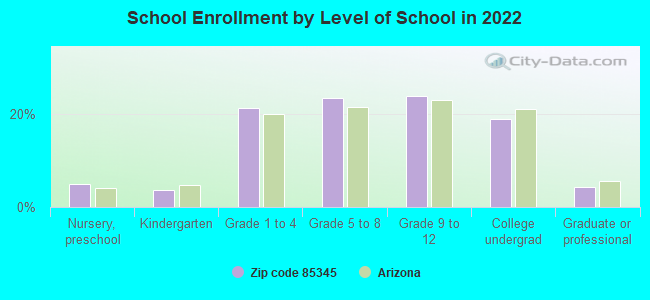
Private vs. public school enrollment:
Students in private schools in grades 1 to 8 (elementary and middle school): 393
Here:
6.3%
Arizona:
10.4%
Students in private schools in grades 9 to 12 (high school): 186
Here:
5.6%
Arizona:
8.8%
Students in private undergraduate colleges: 259
Here:
9.8%
Arizona:
13.1%
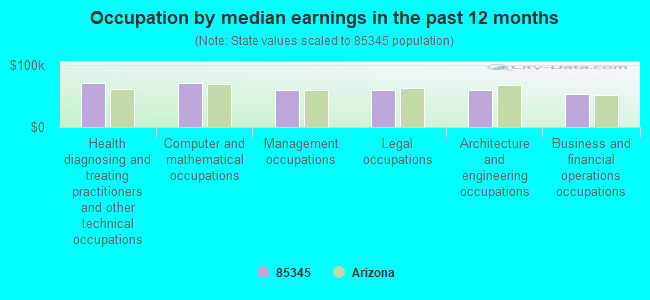
Occupation by median earnings in the past 12 months ($)
71,233Health diagnosing and treating practitioners and other technical occupations
71,157Computer and mathematical occupations
60,050Management occupations
59,877Legal occupations
59,485Architecture and engineering occupations
52,908Business and financial operations occupations
Companies with federal contracts located in this zip code (PEORIA, AZ):
NAVAJO PUMP & SUPPLY INC (7700 W OLIVE AVE; small business) : $455,947 in 25 contractsfrom 2000 to 2006
Contracts for Maintenance, Repair or Alteration of Real Property -- Miscellaneous Buildings, Maintenance, Repair or Alteration of Real Property -- Other Non-Building Facilities, Maintenance, Repair or Alteration of Real Property -- Heating and Cooling Plants, Maintenance, Repair and Rebuilding of Equipment -- Pumps and Compressors, and moreby Air Force, Bureau of Prisoners/Federal Prison System Signed by year:2000: $82,748; 2001: $65,479; 2002: $120,754; 2003: $65,576; 2004: $93,168; 2005: $2,222; 2006: $26,000.
Biggest contracts:
$72,000 with Air Force for Maintenance, Repair or Alteration of Real Property -- Miscellaneous Buildings. Signed on 2002-09-26. Completion date: 2002-11-20.
$54,662 with Air Force for Maintenance, Repair or Alteration of Real Property -- Other Non-Building Facilities. Signed on 2000-04-10. Completion date: 2000-05-25.
$52,787 with Air Force for Maintenance, Repair or Alteration of Real Property -- Heating and Cooling Plants. Signed on 2004-08-27. Completion date: 2004-10-09.
$30,000 with Air Force for Maintenance, Repair or Alteration of Real Property -- Other Non-Building Facilities. Signed on 2002-07-18. Completion date: 2002-07-31.
CUSTOM WOODWORKING & RMDLG (11782 N 91ST AVE STE 2; small business) : $38,728 in 2 contractsin 2002
$27,888 with Air Force for Office Furniture. Signed on 2002-07-26. Completion date: 2002-09-20.
$10,840 with Air Force for Maintenance, Repair or Alteration of Real Property -- Other Administrative Facilities and Service Buildings. Signed on 2002-03-07. Completion date: 2002-04-26.
JORDAN M SHAPIRO (9269 W GARY RD; small business) : $26,400 in 2 contractsin 2004
$25,000 with Army for ADP Software. Signed on 2004-05-14. Completion date: 2004-12-31.
$1,400, same as above.Signed on 2004-09-22. Completion date: 2004-12-31.
COYOTE TARGETED PROMOTIONS, IN (8641 N 85TH AVE; small business)
$17,000 with Air Force for Signs, Advertising Displays, and Identification Plates. Signed on 2006-02-10. Completion date: 2006-03-03.
ARIZONA TEMPLATES INC (10317 W GRISWOLD RD; small business) : $12,297 in 3 contractsfrom 2004 to 2005
$11,507 with Navy for Hardware, Commercial. Signed on 2004-06-16. Completion date: 2005-06-15.
$450, same as above.Signed on 2005-03-22. Completion date: 2005-03-29.
$340, same as above.Signed on 2005-01-14. Completion date: 2005-02-03.
S & L CONTRACTING COMPANY (12099 N 91ST AVE; small business)
$10,397 with Air Force for Maintenance, Repair or Alteration of Real Property -- Highways, Roads, Streets, Bridges, and Railways (includes resurfacing). Signed on 2002-03-29. Completion date: 2002-05-29.
AERODYN INDUSTRIES, L L C (8737 N 77TH DR; small business) : $10,235 in 2 contractsin 2005
$7,652 with Army for Coil, Flat, Leaf, and Wire Springs. Signed on 2005-01-10. Completion date: 2005-01-28.
$2,583 with Defense Logistics Agency for Airframe Structural Components. Signed on 2005-04-15. Completion date: 2005-05-20.
NEIMAN, KENNETH (7810 W PEORIA AVE LOT 156; small business)
$7,929 with Army for Facilities Operations Support Services. Signed on 2005-08-06. Completion date: 2005-09-06.
EVENSON, RAYMOND DEAN (8339 N 87TH DR; small business)
$7,450 with U.S. Army Corps of Engineers - civil program financing only for Other Natural Resources and Conservation Services. Taking place in ND. Signed on 2003-03-18. Completion date: 2003-09-30.
MOONLIGHT AUTOBODY (8738 W TOWNLEY AVE; small business)
$4,133 with Air Force for Other Professional Services. Signed on 2005-04-05. Completion date: 2005-04-04.
Top industries in this zip code by the number of employees in 2005:
2004 - 2018 National Fire Incident Reporting System (NFIRS) incidents
According to the data from the years 2004 - 2018 the average number of fire incidents per year is 82. The highest number of reported fires - 816 took place in 2004, and the least - 0 in 2009. The data has a dropping trend.
When looking into fire subcategories, the most reports belonged to: Other (41.3%), and Outside Fires (25.0%).
Fire incident types reported to NFIRS in Zip Code 85345


 Nearest zip codes: 85381, 85305, 85303, 85351, 85363, 85302.
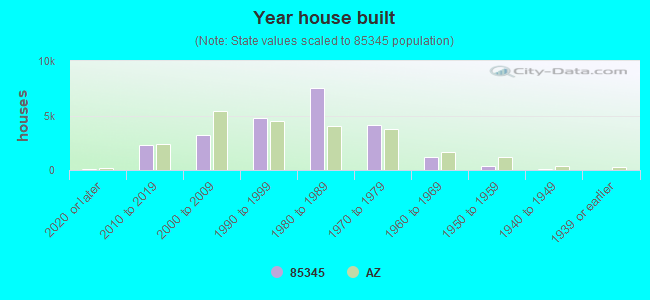


 According to the data from the years 2004 - 2018 the average number of fire incidents per year is 82. The highest number of reported fires - 816 took place in 2004, and the least - 0 in 2009. The data has a dropping trend.
 When looking into fire subcategories, the most reports belonged to: Other (41.3%), and Outside Fires (25.0%).