Sun City West, Arizona Submit your own pictures of this place and show them to the world
OSM Map
General Map
Google Map
MSN Map
OSM Map
General Map
Google Map
MSN Map
OSM Map
General Map
Google Map
MSN Map
OSM Map
General Map
Google Map
MSN Map
Please wait while loading the map...
Population in 2010: 24,535. Population change since 2000: -6.9%Males: 11,070 Females: 13,465
March 2022 cost of living index in Sun City West: 102.5 (near average, U.S. average is 100) Percentage of residents living in poverty in 2022: 7.5%for White Non-Hispanic residents , 22.8% for Black residents , 12.9% for Hispanic or Latino residents , 100.0% for American Indian residents , 13.6% for two or more races residents )
Profiles of local businesses
Business Search - 14 Million verified businesses
Data:
Median household income ($)
Median household income (% change since 2000)
Household income diversity
Ratio of average income to average house value (%)
Ratio of average income to average rent
Median household income ($) - White
Median household income ($) - Black or African American
Median household income ($) - Asian
Median household income ($) - Hispanic or Latino
Median household income ($) - American Indian and Alaska Native
Median household income ($) - Multirace
Median household income ($) - Other Race
Median household income for houses/condos with a mortgage ($)
Median household income for apartments without a mortgage ($)
Races - White alone (%)
Races - White alone (% change since 2000)
Races - Black alone (%)
Races - Black alone (% change since 2000)
Races - American Indian alone (%)
Races - American Indian alone (% change since 2000)
Races - Asian alone (%)
Races - Asian alone (% change since 2000)
Races - Hispanic (%)
Races - Hispanic (% change since 2000)
Races - Native Hawaiian and Other Pacific Islander alone (%)
Races - Native Hawaiian and Other Pacific Islander alone (% change since 2000)
Races - Two or more races (%)
Races - Two or more races (% change since 2000)
Races - Other race alone (%)
Races - Other race alone (% change since 2000)
Racial diversity
Unemployment (%)
Unemployment (% change since 2000)
Unemployment (%) - White
Unemployment (%) - Black or African American
Unemployment (%) - Asian
Unemployment (%) - Hispanic or Latino
Unemployment (%) - American Indian and Alaska Native
Unemployment (%) - Multirace
Unemployment (%) - Other Race
Population density (people per square mile)
Population - Males (%)
Population - Females (%)
Population - Males (%) - White
Population - Males (%) - Black or African American
Population - Males (%) - Asian
Population - Males (%) - Hispanic or Latino
Population - Males (%) - American Indian and Alaska Native
Population - Males (%) - Multirace
Population - Males (%) - Other Race
Population - Females (%) - White
Population - Females (%) - Black or African American
Population - Females (%) - Asian
Population - Females (%) - Hispanic or Latino
Population - Females (%) - American Indian and Alaska Native
Population - Females (%) - Multirace
Population - Females (%) - Other Race
Coronavirus confirmed cases (Apr 27, 2024)
Deaths caused by coronavirus (Apr 27, 2024)
Coronavirus confirmed cases (per 100k population) (Apr 27, 2024)
Deaths caused by coronavirus (per 100k population) (Apr 27, 2024)
Daily increase in number of cases (Apr 27, 2024)
Weekly increase in number of cases (Apr 27, 2024)
Cases doubled (in days) (Apr 27, 2024)
Hospitalized patients (Apr 18, 2022)
Negative test results (Apr 18, 2022)
Total test results (Apr 18, 2022)
COVID Vaccine doses distributed (per 100k population) (Sep 19, 2023)
COVID Vaccine doses administered (per 100k population) (Sep 19, 2023)
COVID Vaccine doses distributed (Sep 19, 2023)
COVID Vaccine doses administered (Sep 19, 2023)
Likely homosexual households (%)
Likely homosexual households (% change since 2000)
Likely homosexual households - Lesbian couples (%)
Likely homosexual households - Lesbian couples (% change since 2000)
Likely homosexual households - Gay men (%)
Likely homosexual households - Gay men (% change since 2000)
Cost of living index
Median gross rent ($)
Median contract rent ($)
Median monthly housing costs ($)
Median house or condo value ($)
Median house or condo value ($ change since 2000)
Mean house or condo value by units in structure - 1, detached ($)
Mean house or condo value by units in structure - 1, attached ($)
Mean house or condo value by units in structure - 2 ($)
Mean house or condo value by units in structure by units in structure - 3 or 4 ($)
Mean house or condo value by units in structure - 5 or more ($)
Mean house or condo value by units in structure - Boat, RV, van, etc. ($)
Mean house or condo value by units in structure - Mobile home ($)
Median house or condo value ($) - White
Median house or condo value ($) - Black or African American
Median house or condo value ($) - Asian
Median house or condo value ($) - Hispanic or Latino
Median house or condo value ($) - American Indian and Alaska Native
Median house or condo value ($) - Multirace
Median house or condo value ($) - Other Race
Median resident age
Resident age diversity
Median resident age - Males
Median resident age - Females
Median resident age - White
Median resident age - Black or African American
Median resident age - Asian
Median resident age - Hispanic or Latino
Median resident age - American Indian and Alaska Native
Median resident age - Multirace
Median resident age - Other Race
Median resident age - Males - White
Median resident age - Males - Black or African American
Median resident age - Males - Asian
Median resident age - Males - Hispanic or Latino
Median resident age - Males - American Indian and Alaska Native
Median resident age - Males - Multirace
Median resident age - Males - Other Race
Median resident age - Females - White
Median resident age - Females - Black or African American
Median resident age - Females - Asian
Median resident age - Females - Hispanic or Latino
Median resident age - Females - American Indian and Alaska Native
Median resident age - Females - Multirace
Median resident age - Females - Other Race
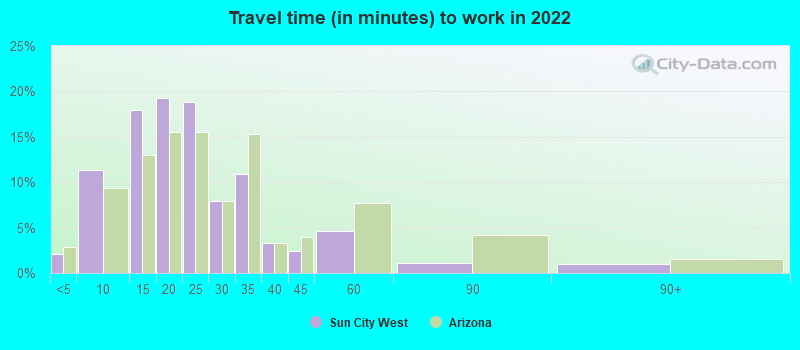
Commute - mean travel time to work (minutes)
Travel time to work - Less than 5 minutes (%)
Travel time to work - Less than 5 minutes (% change since 2000)
Travel time to work - 5 to 9 minutes (%)
Travel time to work - 5 to 9 minutes (% change since 2000)
Travel time to work - 10 to 19 minutes (%)
Travel time to work - 10 to 19 minutes (% change since 2000)
Travel time to work - 20 to 29 minutes (%)
Travel time to work - 20 to 29 minutes (% change since 2000)
Travel time to work - 30 to 39 minutes (%)
Travel time to work - 30 to 39 minutes (% change since 2000)
Travel time to work - 40 to 59 minutes (%)
Travel time to work - 40 to 59 minutes (% change since 2000)
Travel time to work - 60 to 89 minutes (%)
Travel time to work - 60 to 89 minutes (% change since 2000)
Travel time to work - 90 or more minutes (%)
Travel time to work - 90 or more minutes (% change since 2000)
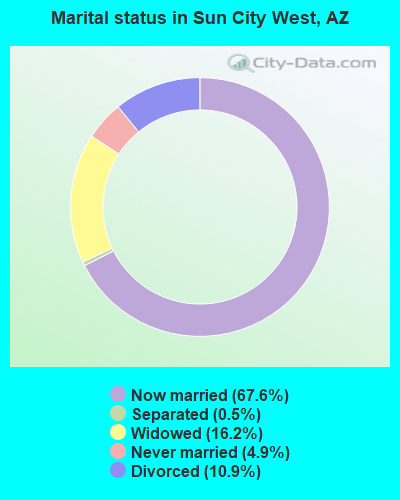
Marital status - Never married (%)
Marital status - Now married (%)
Marital status - Separated (%)
Marital status - Widowed (%)
Marital status - Divorced (%)
Median family income ($)
Median family income (% change since 2000)
Median non-family income ($)
Median non-family income (% change since 2000)
Median per capita income ($)
Median per capita income (% change since 2000)
Median family income ($) - White
Median family income ($) - Black or African American
Median family income ($) - Asian
Median family income ($) - Hispanic or Latino
Median family income ($) - American Indian and Alaska Native
Median family income ($) - Multirace
Median family income ($) - Other Race
Median year house/condo built
Median year apartment built
Year house built - Built 2005 or later (%)
Year house built - Built 2000 to 2004 (%)
Year house built - Built 1990 to 1999 (%)
Year house built - Built 1980 to 1989 (%)
Year house built - Built 1970 to 1979 (%)
Year house built - Built 1960 to 1969 (%)
Year house built - Built 1950 to 1959 (%)
Year house built - Built 1940 to 1949 (%)
Year house built - Built 1939 or earlier (%)
Average household size
Household density (households per square mile)
Average household size - White
Average household size - Black or African American
Average household size - Asian
Average household size - Hispanic or Latino
Average household size - American Indian and Alaska Native
Average household size - Multirace
Average household size - Other Race
Occupied housing units (%)
Vacant housing units (%)
Owner occupied housing units (%)
Renter occupied housing units (%)
Vacancy status - For rent (%)
Vacancy status - For sale only (%)
Vacancy status - Rented or sold, not occupied (%)
Vacancy status - For seasonal, recreational, or occasional use (%)
Vacancy status - For migrant workers (%)
Vacancy status - Other vacant (%)
Residents with income below the poverty level (%)
Residents with income below 50% of the poverty level (%)
Children below poverty level (%)
Poor families by family type - Married-couple family (%)
Poor families by family type - Male, no wife present (%)
Poor families by family type - Female, no husband present (%)
Poverty status for native-born residents (%)
Poverty status for foreign-born residents (%)
Poverty among high school graduates not in families (%)
Poverty among people who did not graduate high school not in families (%)
Residents with income below the poverty level (%) - White
Residents with income below the poverty level (%) - Black or African American
Residents with income below the poverty level (%) - Asian
Residents with income below the poverty level (%) - Hispanic or Latino
Residents with income below the poverty level (%) - American Indian and Alaska Native
Residents with income below the poverty level (%) - Multirace
Residents with income below the poverty level (%) - Other Race
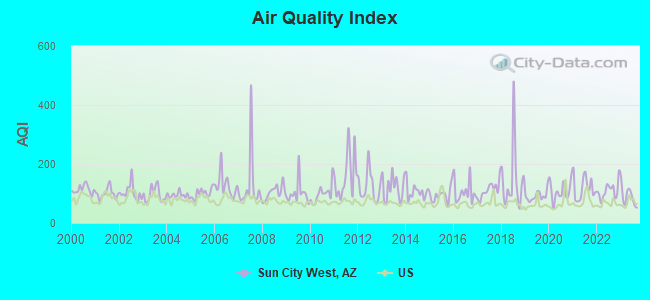
Air pollution - Air Quality Index (AQI)
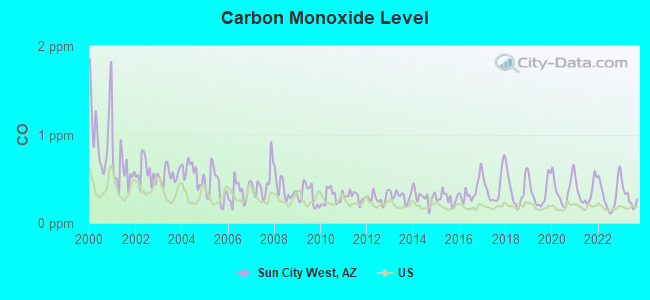
Air pollution - CO
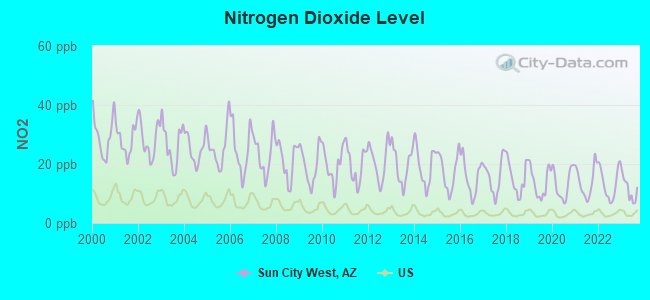
Air pollution - NO2
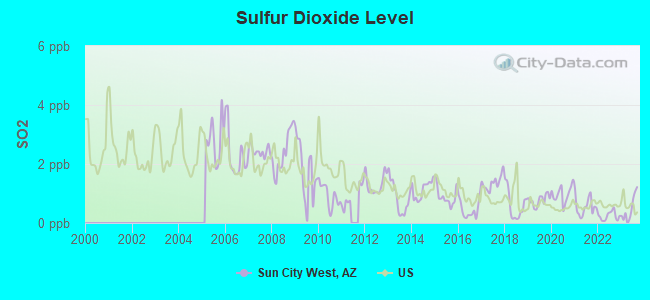
Air pollution - SO2
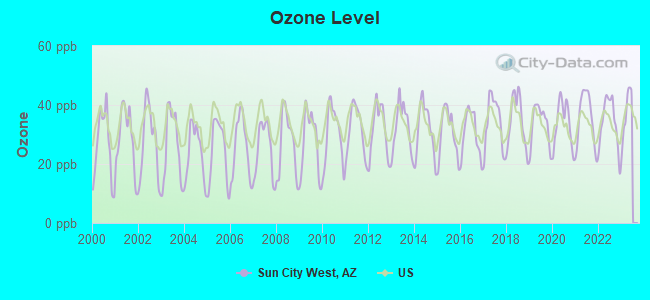
Air pollution - Ozone
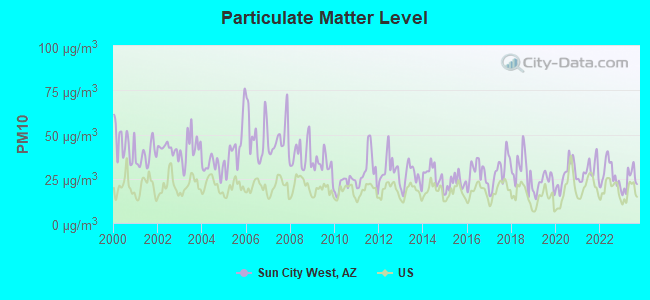
Air pollution - PM10
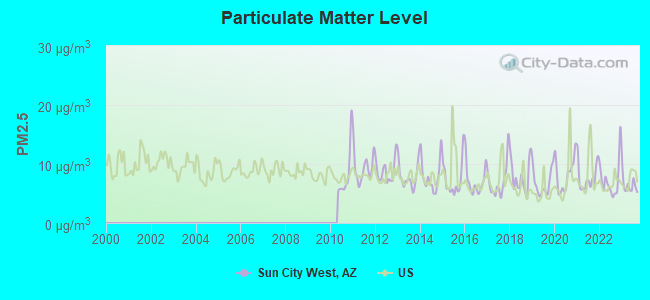
Air pollution - PM25
Air pollution - Pb
Crime - Murders per 100,000 population
Crime - Rapes per 100,000 population
Crime - Robberies per 100,000 population
Crime - Assaults per 100,000 population
Crime - Burglaries per 100,000 population
Crime - Thefts per 100,000 population
Crime - Auto thefts per 100,000 population
Crime - Arson per 100,000 population
Crime - City-data.com crime index
Crime - Violent crime index
Crime - Property crime index
Crime - Murders per 100,000 population (5 year average)
Crime - Rapes per 100,000 population (5 year average)
Crime - Robberies per 100,000 population (5 year average)
Crime - Assaults per 100,000 population (5 year average)
Crime - Burglaries per 100,000 population (5 year average)
Crime - Thefts per 100,000 population (5 year average)
Crime - Auto thefts per 100,000 population (5 year average)
Crime - Arson per 100,000 population (5 year average)
Crime - City-data.com crime index (5 year average)
Crime - Violent crime index (5 year average)
Crime - Property crime index (5 year average)
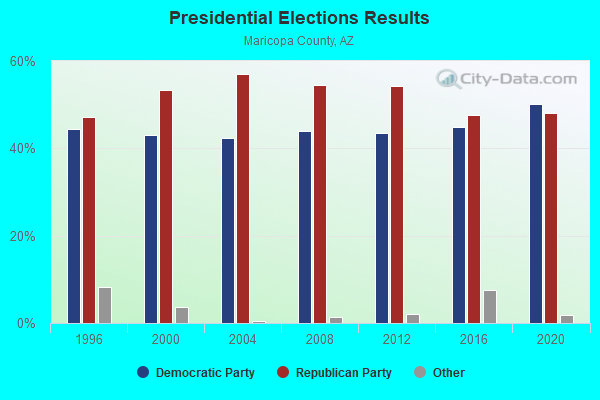
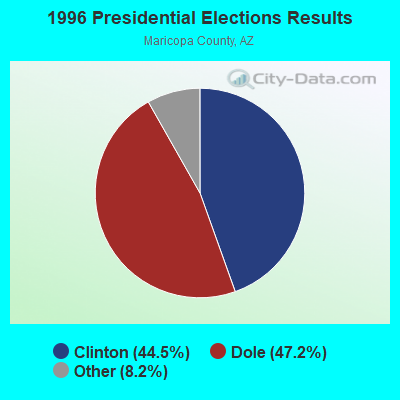
1996 Presidential Elections Results (%) - Democratic Party (Clinton)
1996 Presidential Elections Results (%) - Republican Party (Dole)
1996 Presidential Elections Results (%) - Other
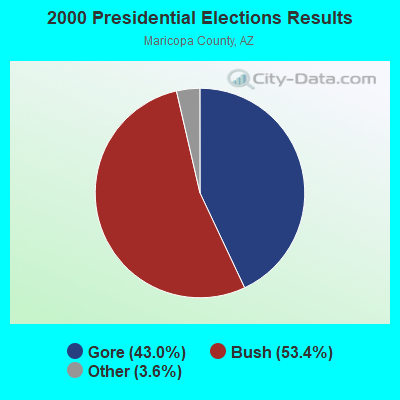
2000 Presidential Elections Results (%) - Democratic Party (Gore)
2000 Presidential Elections Results (%) - Republican Party (Bush)
2000 Presidential Elections Results (%) - Other
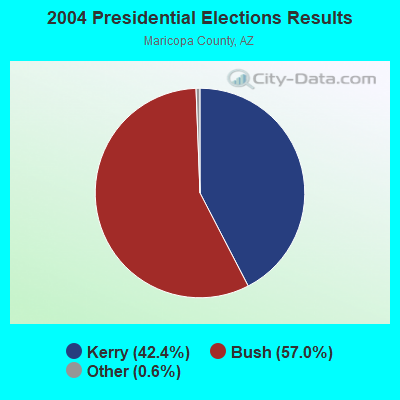
2004 Presidential Elections Results (%) - Democratic Party (Kerry)
2004 Presidential Elections Results (%) - Republican Party (Bush)
2004 Presidential Elections Results (%) - Other
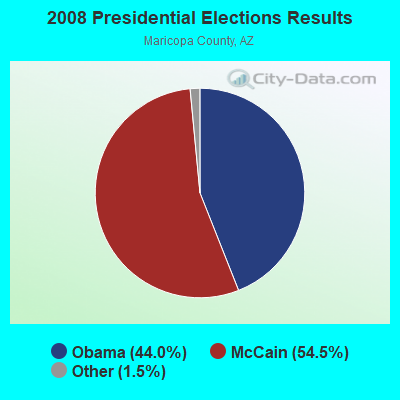
2008 Presidential Elections Results (%) - Democratic Party (Obama)
2008 Presidential Elections Results (%) - Republican Party (McCain)
2008 Presidential Elections Results (%) - Other
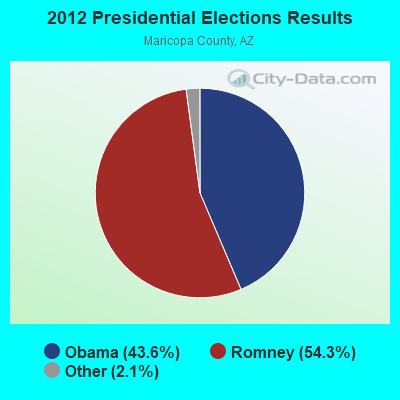
2012 Presidential Elections Results (%) - Democratic Party (Obama)
2012 Presidential Elections Results (%) - Republican Party (Romney)
2012 Presidential Elections Results (%) - Other
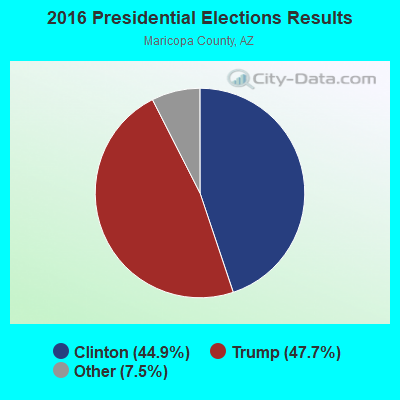
2016 Presidential Elections Results (%) - Democratic Party (Clinton)
2016 Presidential Elections Results (%) - Republican Party (Trump)
2016 Presidential Elections Results (%) - Other
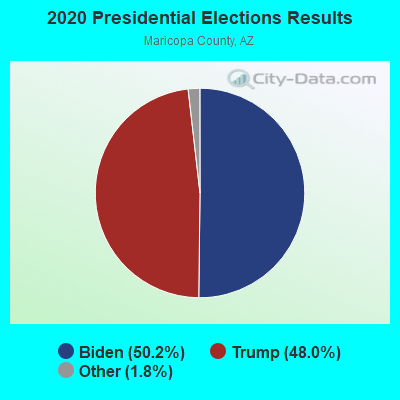
2020 Presidential Elections Results (%) - Democratic Party (Biden)
2020 Presidential Elections Results (%) - Republican Party (Trump)
2020 Presidential Elections Results (%) - Other
Ancestries Reported - Arab (%)
Ancestries Reported - Czech (%)
Ancestries Reported - Danish (%)
Ancestries Reported - Dutch (%)
Ancestries Reported - English (%)
Ancestries Reported - French (%)
Ancestries Reported - French Canadian (%)
Ancestries Reported - German (%)
Ancestries Reported - Greek (%)
Ancestries Reported - Hungarian (%)
Ancestries Reported - Irish (%)
Ancestries Reported - Italian (%)
Ancestries Reported - Lithuanian (%)
Ancestries Reported - Norwegian (%)
Ancestries Reported - Polish (%)
Ancestries Reported - Portuguese (%)
Ancestries Reported - Russian (%)
Ancestries Reported - Scotch-Irish (%)
Ancestries Reported - Scottish (%)
Ancestries Reported - Slovak (%)
Ancestries Reported - Subsaharan African (%)
Ancestries Reported - Swedish (%)
Ancestries Reported - Swiss (%)
Ancestries Reported - Ukrainian (%)
Ancestries Reported - United States (%)
Ancestries Reported - Welsh (%)
Ancestries Reported - West Indian (%)
Ancestries Reported - Other (%)
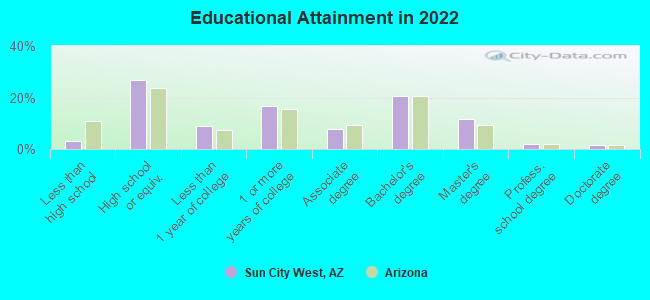
Educational Attainment - No schooling completed (%)
Educational Attainment - Less than high school (%)
Educational Attainment - High school or equivalent (%)
Educational Attainment - Less than 1 year of college (%)
Educational Attainment - 1 or more years of college (%)
Educational Attainment - Associate degree (%)
Educational Attainment - Bachelor's degree (%)
Educational Attainment - Master's degree (%)
Educational Attainment - Professional school degree (%)
Educational Attainment - Doctorate degree (%)
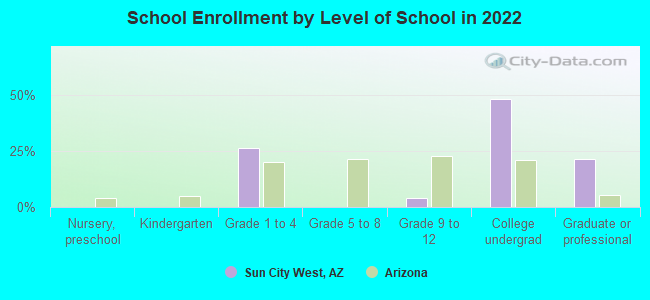
School Enrollment - Nursery, preschool (%)
School Enrollment - Kindergarten (%)
School Enrollment - Grade 1 to 4 (%)
School Enrollment - Grade 5 to 8 (%)
School Enrollment - Grade 9 to 12 (%)
School Enrollment - College undergrad (%)
School Enrollment - Graduate or professional (%)
School Enrollment - Not enrolled in school (%)
School enrollment - Public schools (%)
School enrollment - Private schools (%)
School enrollment - Not enrolled (%)
Median number of rooms in houses and condos
Median number of rooms in apartments
Housing units lacking complete plumbing facilities (%)
Housing units lacking complete kitchen facilities (%)
Density of houses
Urban houses (%)
Rural houses (%)
Households with people 60 years and over (%)
Households with people 65 years and over (%)
Households with people 75 years and over (%)
Households with one or more nonrelatives (%)
Households with no nonrelatives (%)
Population in households (%)
Family households (%)
Nonfamily households (%)
Population in families (%)
Family households with own children (%)
Median number of bedrooms in owner occupied houses
Mean number of bedrooms in owner occupied houses
Median number of bedrooms in renter occupied houses
Mean number of bedrooms in renter occupied houses
Median number of vehichles in owner occupied houses
Mean number of vehichles in owner occupied houses
Median number of vehichles in renter occupied houses
Mean number of vehichles in renter occupied houses
Mortgage status - with mortgage (%)
Mortgage status - with second mortgage (%)
Mortgage status - with home equity loan (%)
Mortgage status - with both second mortgage and home equity loan (%)
Mortgage status - without a mortgage (%)
Average family size
Average family size - White
Average family size - Black or African American
Average family size - Asian
Average family size - Hispanic or Latino
Average family size - American Indian and Alaska Native
Average family size - Multirace
Average family size - Other Race
Geographical mobility - Same house 1 year ago (%)
Geographical mobility - Moved within same county (%)
Geographical mobility - Moved from different county within same state (%)
Geographical mobility - Moved from different state (%)
Geographical mobility - Moved from abroad (%)
Place of birth - Born in state of residence (%)
Place of birth - Born in other state (%)
Place of birth - Native, outside of US (%)
Place of birth - Foreign born (%)
Housing units in structures - 1, detached (%)
Housing units in structures - 1, attached (%)
Housing units in structures - 2 (%)
Housing units in structures - 3 or 4 (%)
Housing units in structures - 5 to 9 (%)
Housing units in structures - 10 to 19 (%)
Housing units in structures - 20 to 49 (%)
Housing units in structures - 50 or more (%)
Housing units in structures - Mobile home (%)
Housing units in structures - Boat, RV, van, etc. (%)
House/condo owner moved in on average (years ago)
Renter moved in on average (years ago)
Year householder moved into unit - Moved in 1999 to March 2000 (%)
Year householder moved into unit - Moved in 1995 to 1998 (%)
Year householder moved into unit - Moved in 1990 to 1994 (%)
Year householder moved into unit - Moved in 1980 to 1989 (%)
Year householder moved into unit - Moved in 1970 to 1979 (%)
Year householder moved into unit - Moved in 1969 or earlier (%)
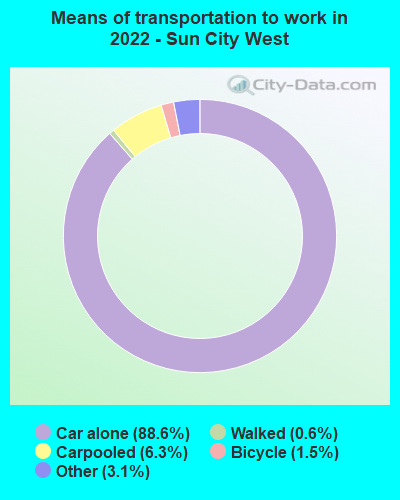
Means of transportation to work - Drove car alone (%)
Means of transportation to work - Carpooled (%)
Means of transportation to work - Public transportation (%)
Means of transportation to work - Bus or trolley bus (%)
Means of transportation to work - Streetcar or trolley car (%)
Means of transportation to work - Subway or elevated (%)
Means of transportation to work - Railroad (%)
Means of transportation to work - Ferryboat (%)
Means of transportation to work - Taxicab (%)
Means of transportation to work - Motorcycle (%)
Means of transportation to work - Bicycle (%)
Means of transportation to work - Walked (%)
Means of transportation to work - Other means (%)
Working at home (%)
Industry diversity
Most Common Industries - Agriculture, forestry, fishing and hunting, and mining (%)
Most Common Industries - Agriculture, forestry, fishing and hunting (%)
Most Common Industries - Mining, quarrying, and oil and gas extraction (%)
Most Common Industries - Construction (%)
Most Common Industries - Manufacturing (%)
Most Common Industries - Wholesale trade (%)
Most Common Industries - Retail trade (%)
Most Common Industries - Transportation and warehousing, and utilities (%)
Most Common Industries - Transportation and warehousing (%)
Most Common Industries - Utilities (%)
Most Common Industries - Information (%)
Most Common Industries - Finance and insurance, and real estate and rental and leasing (%)
Most Common Industries - Finance and insurance (%)
Most Common Industries - Real estate and rental and leasing (%)
Most Common Industries - Professional, scientific, and management, and administrative and waste management services (%)
Most Common Industries - Professional, scientific, and technical services (%)
Most Common Industries - Management of companies and enterprises (%)
Most Common Industries - Administrative and support and waste management services (%)
Most Common Industries - Educational services, and health care and social assistance (%)
Most Common Industries - Educational services (%)
Most Common Industries - Health care and social assistance (%)
Most Common Industries - Arts, entertainment, and recreation, and accommodation and food services (%)
Most Common Industries - Arts, entertainment, and recreation (%)
Most Common Industries - Accommodation and food services (%)
Most Common Industries - Other services, except public administration (%)
Most Common Industries - Public administration (%)
Occupation diversity
Most Common Occupations - Management, business, science, and arts occupations (%)
Most Common Occupations - Management, business, and financial occupations (%)
Most Common Occupations - Management occupations (%)
Most Common Occupations - Business and financial operations occupations (%)
Most Common Occupations - Computer, engineering, and science occupations (%)
Most Common Occupations - Computer and mathematical occupations (%)
Most Common Occupations - Architecture and engineering occupations (%)
Most Common Occupations - Life, physical, and social science occupations (%)
Most Common Occupations - Education, legal, community service, arts, and media occupations (%)
Most Common Occupations - Community and social service occupations (%)
Most Common Occupations - Legal occupations (%)
Most Common Occupations - Education, training, and library occupations (%)
Most Common Occupations - Arts, design, entertainment, sports, and media occupations (%)
Most Common Occupations - Healthcare practitioners and technical occupations (%)
Most Common Occupations - Health diagnosing and treating practitioners and other technical occupations (%)
Most Common Occupations - Health technologists and technicians (%)
Most Common Occupations - Service occupations (%)
Most Common Occupations - Healthcare support occupations (%)
Most Common Occupations - Protective service occupations (%)
Most Common Occupations - Fire fighting and prevention, and other protective service workers including supervisors (%)
Most Common Occupations - Law enforcement workers including supervisors (%)
Most Common Occupations - Food preparation and serving related occupations (%)
Most Common Occupations - Building and grounds cleaning and maintenance occupations (%)
Most Common Occupations - Personal care and service occupations (%)
Most Common Occupations - Sales and office occupations (%)
Most Common Occupations - Sales and related occupations (%)
Most Common Occupations - Office and administrative support occupations (%)
Most Common Occupations - Natural resources, construction, and maintenance occupations (%)
Most Common Occupations - Farming, fishing, and forestry occupations (%)
Most Common Occupations - Construction and extraction occupations (%)
Most Common Occupations - Installation, maintenance, and repair occupations (%)
Most Common Occupations - Production, transportation, and material moving occupations (%)
Most Common Occupations - Production occupations (%)
Most Common Occupations - Transportation occupations (%)
Most Common Occupations - Material moving occupations (%)
People in Group quarters - Institutionalized population (%)
People in Group quarters - Correctional institutions (%)
People in Group quarters - Federal prisons and detention centers (%)
People in Group quarters - Halfway houses (%)
People in Group quarters - Local jails and other confinement facilities (including police lockups) (%)
People in Group quarters - Military disciplinary barracks (%)
People in Group quarters - State prisons (%)
People in Group quarters - Other types of correctional institutions (%)
People in Group quarters - Nursing homes (%)
People in Group quarters - Hospitals/wards, hospices, and schools for the handicapped (%)
People in Group quarters - Hospitals/wards and hospices for chronically ill (%)
People in Group quarters - Hospices or homes for chronically ill (%)
People in Group quarters - Military hospitals or wards for chronically ill (%)
People in Group quarters - Other hospitals or wards for chronically ill (%)
People in Group quarters - Hospitals or wards for drug/alcohol abuse (%)
People in Group quarters - Mental (Psychiatric) hospitals or wards (%)
People in Group quarters - Schools, hospitals, or wards for the mentally retarded (%)
People in Group quarters - Schools, hospitals, or wards for the physically handicapped (%)
People in Group quarters - Institutions for the deaf (%)
People in Group quarters - Institutions for the blind (%)
People in Group quarters - Orthopedic wards and institutions for the physically handicapped (%)
People in Group quarters - Wards in general hospitals for patients who have no usual home elsewhere (%)
People in Group quarters - Wards in military hospitals for patients who have no usual home elsewhere (%)
People in Group quarters - Juvenile institutions (%)
People in Group quarters - Long-term care (%)
People in Group quarters - Homes for abused, dependent, and neglected children (%)
People in Group quarters - Residential treatment centers for emotionally disturbed children (%)
People in Group quarters - Training schools for juvenile delinquents (%)
People in Group quarters - Short-term care, detention or diagnostic centers for delinquent children (%)
People in Group quarters - Type of juvenile institution unknown (%)
People in Group quarters - Noninstitutionalized population (%)
People in Group quarters - College dormitories (includes college quarters off campus) (%)
People in Group quarters - Military quarters (%)
People in Group quarters - On base (%)
People in Group quarters - Barracks, unaccompanied personnel housing (UPH), (Enlisted/Officer), ;and similar group living quarters for military personnel (%)
People in Group quarters - Transient quarters for temporary residents (%)
People in Group quarters - Military ships (%)
People in Group quarters - Group homes (%)
People in Group quarters - Homes or halfway houses for drug/alcohol abuse (%)
People in Group quarters - Homes for the mentally ill (%)
People in Group quarters - Homes for the mentally retarded (%)
People in Group quarters - Homes for the physically handicapped (%)
People in Group quarters - Other group homes (%)
People in Group quarters - Religious group quarters (%)
People in Group quarters - Dormitories (%)
People in Group quarters - Agriculture workers' dormitories on farms (%)
People in Group quarters - Job Corps and vocational training facilities (%)
People in Group quarters - Other workers' dormitories (%)
People in Group quarters - Crews of maritime vessels (%)
People in Group quarters - Other nonhousehold living situations (%)
People in Group quarters - Other noninstitutional group quarters (%)
Residents speaking English at home (%)
Residents speaking English at home - Born in the United States (%)
Residents speaking English at home - Native, born elsewhere (%)
Residents speaking English at home - Foreign born (%)
Residents speaking Spanish at home (%)
Residents speaking Spanish at home - Born in the United States (%)
Residents speaking Spanish at home - Native, born elsewhere (%)
Residents speaking Spanish at home - Foreign born (%)
Residents speaking other language at home (%)
Residents speaking other language at home - Born in the United States (%)
Residents speaking other language at home - Native, born elsewhere (%)
Residents speaking other language at home - Foreign born (%)
Class of Workers - Employee of private company (%)
Class of Workers - Self-employed in own incorporated business (%)
Class of Workers - Private not-for-profit wage and salary workers (%)
Class of Workers - Local government workers (%)
Class of Workers - State government workers (%)
Class of Workers - Federal government workers (%)
Class of Workers - Self-employed workers in own not incorporated business and Unpaid family workers (%)
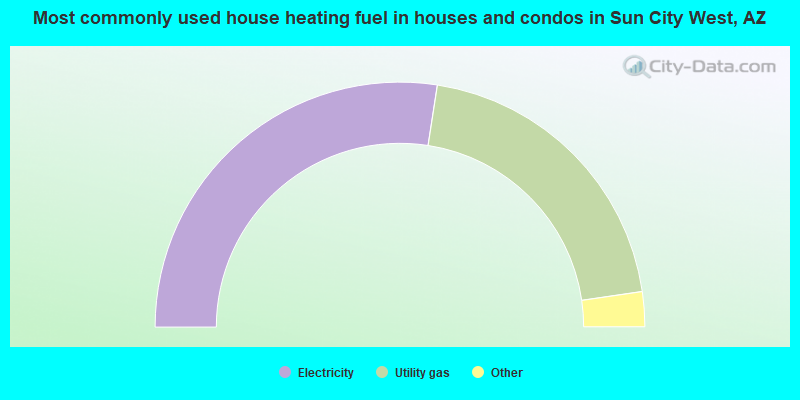
House heating fuel used in houses and condos - Utility gas (%)
House heating fuel used in houses and condos - Bottled, tank, or LP gas (%)
House heating fuel used in houses and condos - Electricity (%)
House heating fuel used in houses and condos - Fuel oil, kerosene, etc. (%)
House heating fuel used in houses and condos - Coal or coke (%)
House heating fuel used in houses and condos - Wood (%)
House heating fuel used in houses and condos - Solar energy (%)
House heating fuel used in houses and condos - Other fuel (%)
House heating fuel used in houses and condos - No fuel used (%)
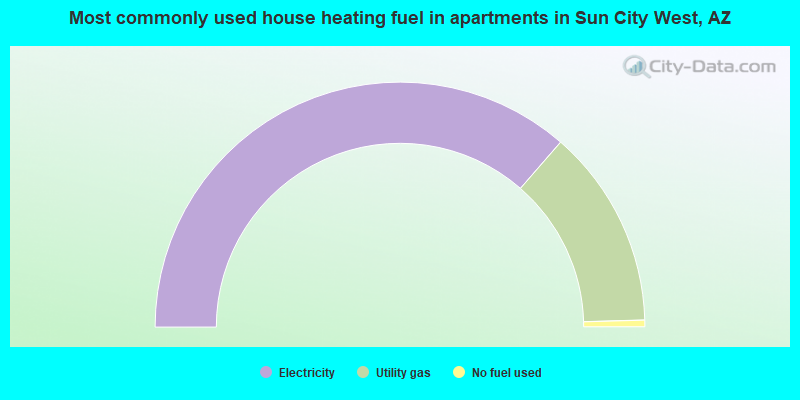
House heating fuel used in apartments - Utility gas (%)
House heating fuel used in apartments - Bottled, tank, or LP gas (%)
House heating fuel used in apartments - Electricity (%)
House heating fuel used in apartments - Fuel oil, kerosene, etc. (%)
House heating fuel used in apartments - Coal or coke (%)
House heating fuel used in apartments - Wood (%)
House heating fuel used in apartments - Solar energy (%)
House heating fuel used in apartments - Other fuel (%)
House heating fuel used in apartments - No fuel used (%)
Armed forces status - In Armed Forces (%)
Armed forces status - Civilian (%)
Armed forces status - Civilian - Veteran (%)
Armed forces status - Civilian - Nonveteran (%)
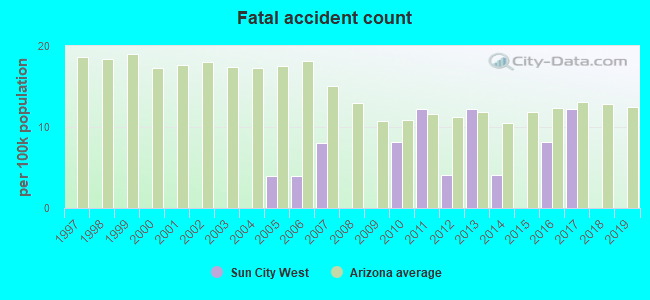
Fatal accidents locations in years 2005-2021
Fatal accidents locations in 2005
Fatal accidents locations in 2006
Fatal accidents locations in 2007
Fatal accidents locations in 2008
Fatal accidents locations in 2009
Fatal accidents locations in 2010
Fatal accidents locations in 2011
Fatal accidents locations in 2012
Fatal accidents locations in 2013
Fatal accidents locations in 2014
Fatal accidents locations in 2015
Fatal accidents locations in 2016
Fatal accidents locations in 2017
Fatal accidents locations in 2018
Fatal accidents locations in 2019
Fatal accidents locations in 2020
Fatal accidents locations in 2021
Alcohol use - People drinking some alcohol every month (%)
Alcohol use - People not drinking at all (%)
Alcohol use - Average days/month drinking alcohol
Alcohol use - Average drinks/week
Alcohol use - Average days/year people drink much
Audiometry - Average condition of hearing (%)
Audiometry - People that can hear a whisper from across a quiet room (%)
Audiometry - People that can hear normal voice from across a quiet room (%)
Audiometry - Ears ringing, roaring, buzzing (%)
Audiometry - Had a job exposure to loud noise (%)
Audiometry - Had off-work exposure to loud noise (%)
Blood Pressure & Cholesterol - Has high blood pressure (%)
Blood Pressure & Cholesterol - Checking blood pressure at home (%)
Blood Pressure & Cholesterol - Frequently checking blood cholesterol (%)
Blood Pressure & Cholesterol - Has high cholesterol level (%)
Consumer Behavior - Money monthly spent on food at supermarket/grocery store
Consumer Behavior - Money monthly spent on food at other stores
Consumer Behavior - Money monthly spent on eating out
Consumer Behavior - Money monthly spent on carryout/delivered foods
Consumer Behavior - Income spent on food at supermarket/grocery store (%)
Consumer Behavior - Income spent on food at other stores (%)
Consumer Behavior - Income spent on eating out (%)
Consumer Behavior - Income spent on carryout/delivered foods (%)
Current Health Status - General health condition (%)
Current Health Status - Blood donors (%)
Current Health Status - Has blood ever tested for HIV virus (%)
Current Health Status - Left-handed people (%)
Dermatology - People using sunscreen (%)
Diabetes - Diabetics (%)
Diabetes - Had a blood test for high blood sugar (%)
Diabetes - People taking insulin (%)
Diet Behavior & Nutrition - Diet health (%)
Diet Behavior & Nutrition - Milk product consumption (# of products/month)
Diet Behavior & Nutrition - Meals not home prepared (#/week)
Diet Behavior & Nutrition - Meals from fast food or pizza place (#/week)
Diet Behavior & Nutrition - Ready-to-eat foods (#/month)
Diet Behavior & Nutrition - Frozen meals/pizza (#/month)
Drug Use - People that ever used marijuana or hashish (%)
Drug Use - Ever used hard drugs (%)
Drug Use - Ever used any form of cocaine (%)
Drug Use - Ever used heroin (%)
Drug Use - Ever used methamphetamine (%)
Health Insurance - People covered by health insurance (%)
Kidney Conditions-Urology - Avg. # of times urinating at night
Medical Conditions - People with asthma (%)
Medical Conditions - People with anemia (%)
Medical Conditions - People with psoriasis (%)
Medical Conditions - People with overweight (%)
Medical Conditions - Elderly people having difficulties in thinking or remembering (%)
Medical Conditions - People who ever received blood transfusion (%)
Medical Conditions - People having trouble seeing even with glass/contacts (%)
Medical Conditions - People with arthritis (%)
Medical Conditions - People with gout (%)
Medical Conditions - People with congestive heart failure (%)
Medical Conditions - People with coronary heart disease (%)
Medical Conditions - People with angina pectoris (%)
Medical Conditions - People who ever had heart attack (%)
Medical Conditions - People who ever had stroke (%)
Medical Conditions - People with emphysema (%)
Medical Conditions - People with thyroid problem (%)
Medical Conditions - People with chronic bronchitis (%)
Medical Conditions - People with any liver condition (%)
Medical Conditions - People who ever had cancer or malignancy (%)
Mental Health - People who have little interest in doing things (%)
Mental Health - People feeling down, depressed, or hopeless (%)
Mental Health - People who have trouble sleeping or sleeping too much (%)
Mental Health - People feeling tired or having little energy (%)
Mental Health - People with poor appetite or overeating (%)
Mental Health - People feeling bad about themself (%)
Mental Health - People who have trouble concentrating on things (%)
Mental Health - People moving or speaking slowly or too fast (%)
Mental Health - People having thoughts they would be better off dead (%)
Oral Health - Average years since last visit a dentist
Oral Health - People embarrassed because of mouth (%)
Oral Health - People with gum disease (%)
Oral Health - General health of teeth and gums (%)
Oral Health - Average days a week using dental floss/device
Oral Health - Average days a week using mouthwash for dental problem
Oral Health - Average number of teeth
Pesticide Use - Households using pesticides to control insects (%)
Pesticide Use - Households using pesticides to kill weeds (%)
Physical Activity - People doing vigorous-intensity work activities (%)
Physical Activity - People doing moderate-intensity work activities (%)
Physical Activity - People walking or bicycling (%)
Physical Activity - People doing vigorous-intensity recreational activities (%)
Physical Activity - People doing moderate-intensity recreational activities (%)
Physical Activity - Average hours a day doing sedentary activities
Physical Activity - Average hours a day watching TV or videos
Physical Activity - Average hours a day using computer
Physical Functioning - People having limitations keeping them from working (%)
Physical Functioning - People limited in amount of work they can do (%)
Physical Functioning - People that need special equipment to walk (%)
Physical Functioning - People experiencing confusion/memory problems (%)
Physical Functioning - People requiring special healthcare equipment (%)
Prescription Medications - Average number of prescription medicines taking
Preventive Aspirin Use - Adults 40+ taking low-dose aspirin (%)
Reproductive Health - Vaginal deliveries (%)
Reproductive Health - Cesarean deliveries (%)
Reproductive Health - Deliveries resulted in a live birth (%)
Reproductive Health - Pregnancies resulted in a delivery (%)
Reproductive Health - Women breastfeeding newborns (%)
Reproductive Health - Women that had a hysterectomy (%)
Reproductive Health - Women that had both ovaries removed (%)
Reproductive Health - Women that have ever taken birth control pills (%)
Reproductive Health - Women taking birth control pills (%)
Reproductive Health - Women that have ever used Depo-Provera or injectables (%)
Reproductive Health - Women that have ever used female hormones (%)
Sexual Behavior - People 18+ that ever had sex (vaginal, anal, or oral) (%)
Sexual Behavior - Males 18+ that ever had vaginal sex with a woman (%)
Sexual Behavior - Males 18+ that ever performed oral sex on a woman (%)
Sexual Behavior - Males 18+ that ever had anal sex with a woman (%)
Sexual Behavior - Males 18+ that ever had any sex with a man (%)
Sexual Behavior - Females 18+ that ever had vaginal sex with a man (%)
Sexual Behavior - Females 18+ that ever performed oral sex on a man (%)
Sexual Behavior - Females 18+ that ever had anal sex with a man (%)
Sexual Behavior - Females 18+ that ever had any kind of sex with a woman (%)
Sexual Behavior - Average age people first had sex
Sexual Behavior - Average number of female sex partners in lifetime (males 18+)
Sexual Behavior - Average number of female vaginal sex partners in lifetime (males 18+)
Sexual Behavior - Average age people first performed oral sex on a woman (18+)
Sexual Behavior - Average number of woman performed oral sex on in lifetime (18+)
Sexual Behavior - Average number of male sex partners in lifetime (males 18+)
Sexual Behavior - Average number of male anal sex partners in lifetime (males 18+)
Sexual Behavior - Average age people first performed oral sex on a man (18+)
Sexual Behavior - Average number of male oral sex partners in lifetime (18+)
Sexual Behavior - People using protection when performing oral sex (%)
Sexual Behavior - Average number of times people have vaginal or anal sex a year
Sexual Behavior - People having sex without condom (%)
Sexual Behavior - Average number of male sex partners in lifetime (females 18+)
Sexual Behavior - Average number of male vaginal sex partners in lifetime (females 18+)
Sexual Behavior - Average number of female sex partners in lifetime (females 18+)
Sexual Behavior - Circumcised males 18+ (%)
Sleep Disorders - Average hours sleeping at night
Sleep Disorders - People that has trouble sleeping (%)
Smoking-Cigarette Use - People smoking cigarettes (%)
Taste & Smell - People 40+ having problems with smell (%)
Taste & Smell - People 40+ having problems with taste (%)
Taste & Smell - People 40+ that ever had wisdom teeth removed (%)
Taste & Smell - People 40+ that ever had tonsils teeth removed (%)
Taste & Smell - People 40+ that ever had a loss of consciousness because of a head injury (%)
Taste & Smell - People 40+ that ever had a broken nose or other serious injury to face or skull (%)
Taste & Smell - People 40+ that ever had two or more sinus infections (%)
Weight - Average height (inches)
Weight - Average weight (pounds)
Weight - Average BMI
Weight - People that are obese (%)
Weight - People that ever were obese (%)
Weight - People trying to lose weight (%)
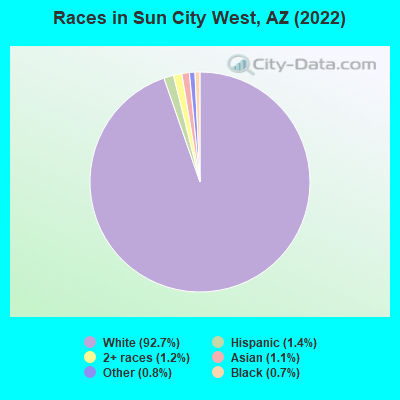
25,376 92.7% White alone 393 1.4% Hispanic 329 1.2% Two or more races 306 1.1% Asian alone 214 0.8% Other race alone 188 0.7% Black alone 27 0.10% American Indian alone
According to our research of Arizona and other state lists, there were 28 registered sex offenders living in Sun City West, Arizona as of April 27, 2024 . The ratio of all residents to sex offenders in Sun City West is 923 to 1.The ratio of registered sex offenders to all residents in this city is lower than the state average.
Latest news from Sun City West, AZ collected exclusively by city-data.com from local newspapers, TV, and radio stations
Sun City West, AZ City Guides: Ancestries: German (18.9%), English (14.8%), Irish (9.4%), American (8.8%), Italian (6.1%), Polish (4.9%).
Current Local Time:
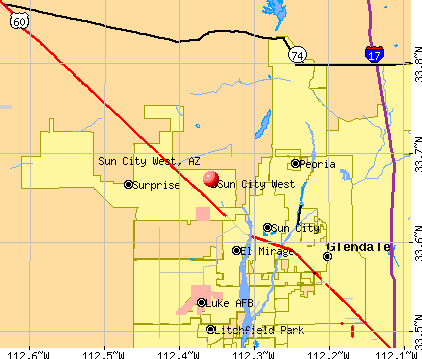
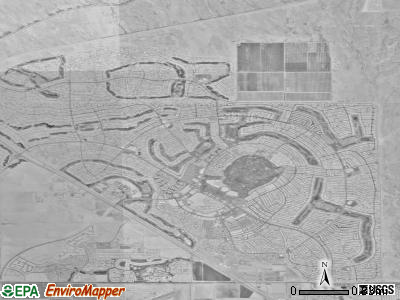
Land area: 11.1 square miles.
Population density: 2,211 people per square mile (low).
1,131 residents are foreign born (1.8% North America , 1.5% Europe , 0.7% Asia ).
This place:
4.1%Arizona:
13.0%
Median real estate property taxes paid for housing units with mortgages in 2022: $1,598 (0.4%)Median real estate property taxes paid for housing units with no mortgage in 2022: $1,552 (0.4%)
Nearest city with pop. 50,000+: Peoria, AZ
Nearest city with pop. 200,000+: Glendale, AZ
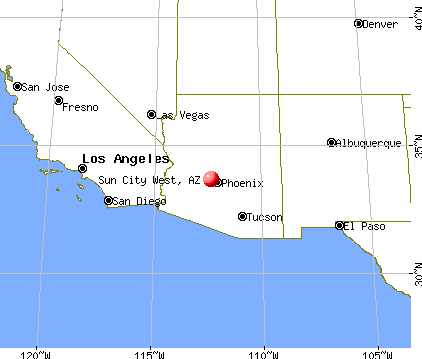
Nearest city with pop. 1,000,000+: Phoenix, AZ
Nearest cities:
Latitude: 33.67 N, Longitude: 112.36 W
Daytime population change due to commuting: +3,622 (+13.2%)Workers who live and work in this place: 1,460 (43.5%)
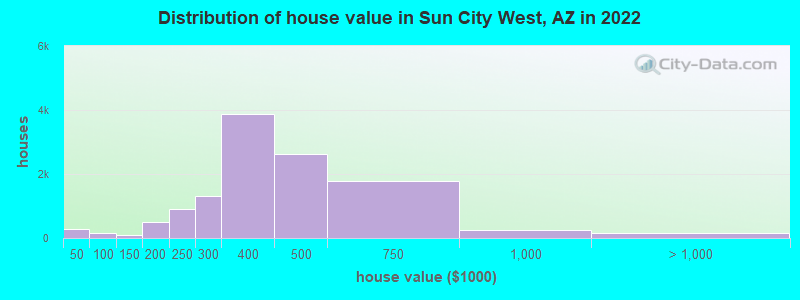
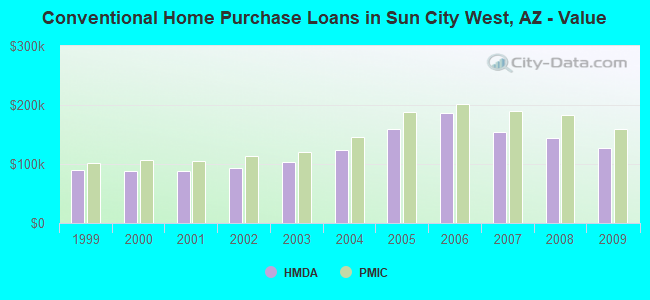
Property values in Sun City West, AZ
Unemployment in December 2023:
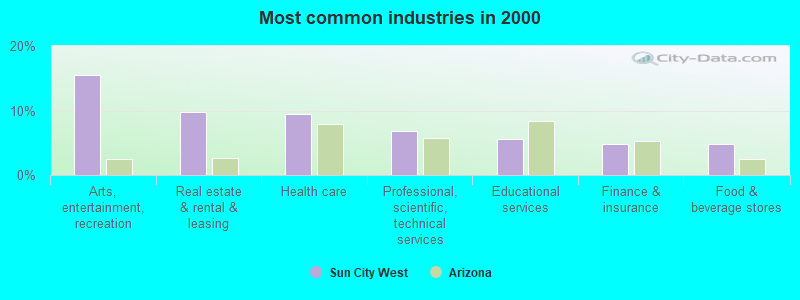
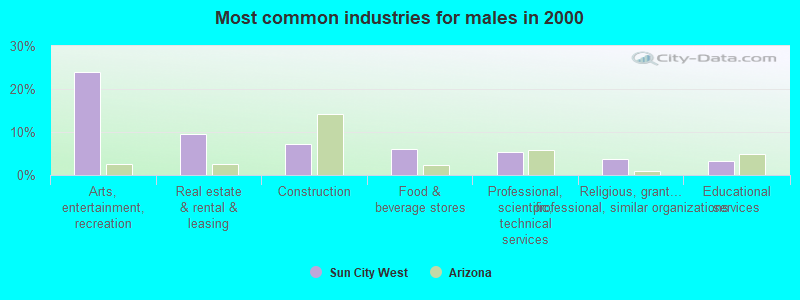
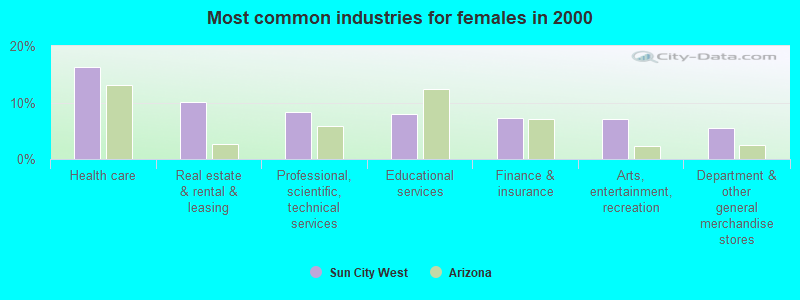
Most common industries in Sun City West, AZ (%)
Both Males Females
Arts, entertainment, recreation (15.4%)
Real estate & rental & leasing (9.8%)
Health care (9.4%)
Professional, scientific, technical services (6.8%)
Educational services (5.7%)
Finance & insurance (4.8%)
Food & beverage stores (4.8%)
Arts, entertainment, recreation (24.0%)
Real estate & rental & leasing (9.6%)
Construction (7.3%)
Food & beverage stores (6.0%)
Professional, scientific, technical services (5.3%)
Religious, grantmaking, civic, professional, similar organizations (3.8%)
Educational services (3.4%)
Health care (16.2%)
Real estate & rental & leasing (10.0%)
Professional, scientific, technical services (8.3%)
Educational services (7.9%)
Finance & insurance (7.2%)
Arts, entertainment, recreation (7.1%)
Department & other general merchandise stores (5.4%)
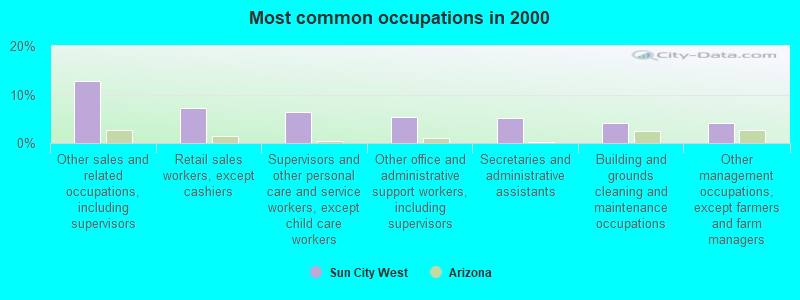
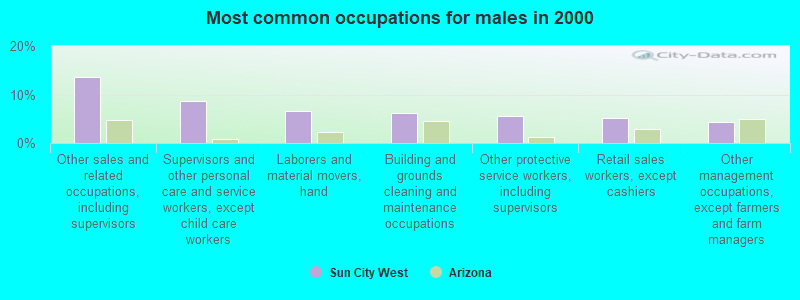
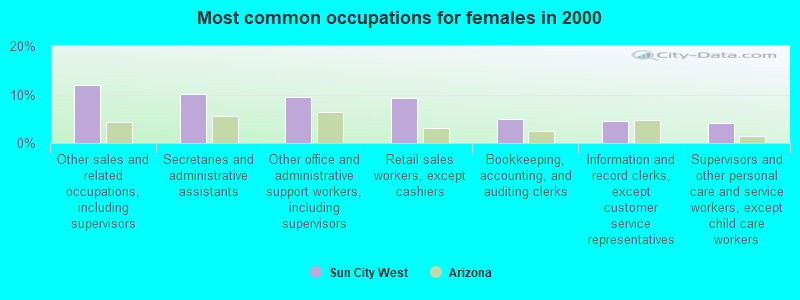
Most common occupations in Sun City West, AZ (%)
Both Males Females
Other sales and related occupations, including supervisors (12.8%)
Retail sales workers, except cashiers (7.3%)
Supervisors and other personal care and service workers, except child care workers (6.4%)
Other office and administrative support workers, including supervisors (5.4%)
Secretaries and administrative assistants (5.2%)
Building and grounds cleaning and maintenance occupations (4.1%)
Other management occupations, except farmers and farm managers (4.1%)
Other sales and related occupations, including supervisors (13.6%)
Supervisors and other personal care and service workers, except child care workers (8.7%)
Laborers and material movers, hand (6.5%)
Building and grounds cleaning and maintenance occupations (6.2%)
Other protective service workers, including supervisors (5.5%)
Retail sales workers, except cashiers (5.2%)
Other management occupations, except farmers and farm managers (4.4%)
Other sales and related occupations, including supervisors (12.1%)
Secretaries and administrative assistants (10.2%)
Other office and administrative support workers, including supervisors (9.4%)
Retail sales workers, except cashiers (9.3%)
Bookkeeping, accounting, and auditing clerks (4.9%)
Information and record clerks, except customer service representatives (4.4%)
Supervisors and other personal care and service workers, except child care workers (4.1%)
Earthquake activity:
Sun City West-area historical earthquake activity is significantly above Arizona state average. It is 2740% greater than the overall U.S. average. On 6/28/1992 at 11:57:34, a magnitude 7.6 (6.2 MB, 7.6 MS, 7.3 MW, Depth: 0.7 mi, Class: Major, Intensity: VIII - XII) earthquake occurred 242.2 miles away from the city center, causing 3 deaths ( 1 shaking deaths, 2 other deaths) and 400 injuries, causing $100,000,000 total damage and $40,000,000 insured lossesOn 10/16/1999 at 09:46:44, a magnitude 7.4 (6.3 MB, 7.4 MS, 7.2 MW, 7.3 ML) earthquake occurred 240.7 miles away from the city center On 5/19/1940 at 04:36:40, a magnitude 7.2 (7.2 UK) earthquake occurred 195.2 miles away from Sun City West center, causing $33,000,000 total damage On 12/31/1934 at 18:45:56, a magnitude 7.1 (7.1 UK) earthquake occurred 208.5 miles away from the city center On 10/15/1979 at 23:16:54, a magnitude 7.0 (5.7 MB, 6.9 MS, 7.0 ML, 6.4 MW) earthquake occurred 198.8 miles away from Sun City West center On 7/21/1952 at 11:52:14, a magnitude 7.7 (7.7 UK) earthquake occurred 390.3 miles away from Sun City West center, causing $50,000,000 total damage Magnitude types: body-wave magnitude (MB), local magnitude (ML), surface-wave magnitude (MS), moment magnitude (MW) Natural disasters: The number of natural disasters in Maricopa County (16) is near the US average (15).Major Disasters (Presidential) Declared: 11Emergencies Declared: 1Floods: 10, Storms: 9, Fires: 3, Flash Flood: 1, Heavy Rain: 1, Hurricane: 1, Tornado: 1, Wind: 1, Other: 1 (Note: some incidents may be assigned to more than one category). Hospitals and medical centers in Sun City West: BANNER DEL E WEBB MEDICAL CENTER (Voluntary non-profit - Private, provides emergency services, 14502 WEST MEEKER BOULEVARD) DEL WEBB EXTENDED CARE CENTER (14502 WEST MEEKER BLVD)
SUN HEALTH GRANDVIEW CARE CTR (14505 WEST GRANITE VALLEY DRIVE)
SUN WEST CHOICE HEALTHCARE AND REHAB (14002 WEST MEEKER BLVD)
GRANITE VALLEY DIALYSIS (FMC) (14510 W SHUMWAY DR STE 100)
WEST BROOK DIALYSIS (DVA) (13907 W CAMINO DEL SOL)
Heliports located in Sun City West: Amtrak station near Sun City West: 17 miles: PHOENIX NORTHWEST (PHOENIX, 8101 BLACK CANYON FWY.) - Bus Station Services: public payphones, call for taxi service.
Colleges/universities with over 2000 students nearest to Sun City West:
Glendale Community College (about 13 miles; Glendale, AZ ; Full-time enrollment: 12,533)
Arizona State University-West (about 13 miles; Glendale, AZ ; FT enrollment: 3,454)
Estrella Mountain Community College (about 14 miles; Avondale, AZ ; FT enrollment: 4,932)
Universal Technical Institute of Arizona Inc-Motorcycle Mechanics Institute Division (about 14 miles; Phoenix, AZ ; FT enrollment: 2,976)
Everest College-Phoenix (about 16 miles; Phoenix, AZ ; FT enrollment: 2,008)
Universal Technical Institute of Arizona Inc (about 16 miles; Avondale, AZ ; FT enrollment: 3,860)
Argosy University-Phoenix Online Division (about 17 miles; Phoenix, AZ ; FT enrollment: 8,840)
Notable locations in Sun City West: (A) , Hillcrest Golf Course (B) , Pebblebrook Golf Course (C) , Stardust Golf Course (D) , Beardsley Railroad Station (E) , Sun City West Fire District Station 102 (F) , Sun City West Fire District Station 103 (G) , Sun City West Fire District Station 101 (H) . Display/hide their locations on the map
Shopping Center: (1) . Display/hide its location on the map
Churches in Sun City West include: (A) , First Baptist Church of Sun City West (B) , Desert Palms Presbyterian Church (C) , Desert Garden Church (D) , Crown of Life Lutheran Church (E) , Covenant Presbyterian Church (F) , Church on the Green (G) , Church of the Advent (H) , Sun City West Christian Church (I) . Display/hide their locations on the map
Hotel:
Maricopa County has a predicted average indoor radon screening level between 2 and 4 pCi/L (pico curies per liter) - Moderate Potential Average household size: This place:
1.6 peopleArizona:
2.6 people
Percentage of family households: This place:
57.5%Whole state:
66.2%
Percentage of households with unmarried partners: This place:
2.3%Whole state:
7.8%
Likely homosexual households (counted as self-reported same-sex unmarried-partner households)
Lesbian couples: 0.3% of all households Gay men: 0.2% of all households
186 people in nursing facilities/skilled-nursing facilities in 2010People in group quarters in Sun City West in 2000:
193 people in nursing homes
56 people in homes or halfway houses for drug/alcohol abuse
12 people in other noninstitutional group quarters
Banks with branches in Sun City West (2011 data):
National Bank of Arizona: Grandview Terrace Branch at 14515 Granite Valley Drive, branch established on 2007/03/26. Info updated 2008/09/11: Bank assets: $4,485.6 mil, Deposits: $3,731.3 mil, headquarters in Tucson, AZ, positive income , Commercial Lending Specialization, 73 total offices , Holding Company: Zions Bancorporation
BMO Harris Bank National Association: Sun City West Branch at 19428 R. H. Johnson Boulevard, branch established on 1996/06/30. Info updated 2011/07/14: Bank assets: $97,264.0 mil, Deposits: $75,624.6 mil, headquarters in Chicago, IL, positive income , 717 total offices , Holding Company: Bank Of Montreal
Mutual of Omaha Bank: Sun City Branch at 19432 North R H Johnson Boulevard, branch established on 1984/05/02. Info updated 2011/07/21: Bank assets: $5,553.2 mil, Deposits: $4,599.7 mil, headquarters in Omaha, NE, positive income , Commercial Lending Specialization, 45 total offices
Compass Bank: Sun City West Branch at 19202 North R.H. Johnson Boulevard, branch established on 1994/06/01. Info updated 2011/02/24: Bank assets: $63,107.0 mil, Deposits: $46,232.4 mil, headquarters in Birmingham, AL, negative income in the last year , Commercial Lending Specialization, 720 total offices , Holding Company: Banco Bilbao Vizcaya Argentaria, S.A.
Bank of America, National Association: R.H. Johnson Boulevard Branch at 19022 R.H. Johnson Boulevard, branch established on 1929/01/01. Info updated 2009/11/18: Bank assets: $1,451,969.3 mil, Deposits: $1,077,176.8 mil, headquarters in Charlotte, NC, positive income , 5782 total offices , Holding Company: Bank Of America Corporation
JPMorgan Chase Bank, National Association: Sun City West Branch at 13501 Camino Del Sol, branch established on 1979/12/17. Info updated 2011/11/10: Bank assets: $1,811,678.0 mil, Deposits: $1,190,738.0 mil, headquarters in Columbus, OH, positive income , International Specialization, 5577 total offices , Holding Company: Jpmorgan Chase & Co.
Washington Federal: North Rh Johnson Boulevard Branch at 19005 North R H Johnson Boulevard, branch established on 1998/03/30. Info updated 2011/12/19: Bank assets: $13,653.0 mil, Deposits: $8,905.8 mil, headquarters in Seattle, WA, positive income , Mortgage Lending Specialization, 174 total offices
Wells Fargo Bank, National Association: Sundome Plaza Branch at 13503 W Camino Del Sol, branch established on 1998/08/26. Info updated 2011/04/05: Bank assets: $1,161,490.0 mil, Deposits: $905,653.0 mil, headquarters in Sioux Falls, SD, positive income , 6395 total offices , Holding Company: Wells Fargo & Company
For population 15 years and over in Sun City West:
Never married: 4.9%Now married: 67.6%Separated: 0.5%Widowed: 16.2%Divorced: 10.9% For population 25 years and over in Sun City West:
High school or higher: 96.7%Bachelor's degree or higher: 34.8%Graduate or professional degree: 14.9%Unemployed: 7.4%Mean travel time to work (commute): 16.4 minutes
Education Gini index (Inequality in education) Here:
9.6Arizona average:
12.2
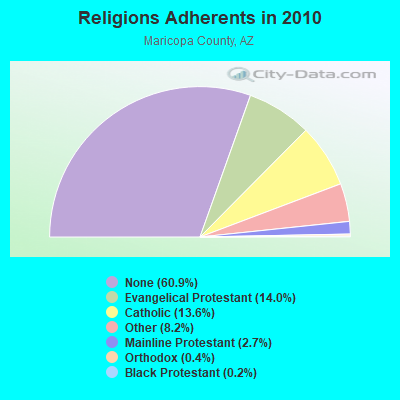
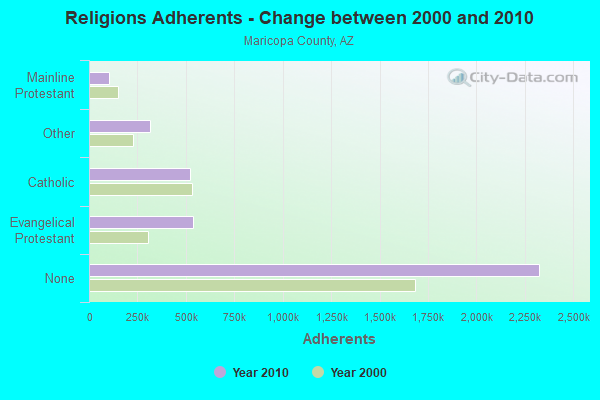
Religion statistics for Sun City West, AZ (based on Maricopa County data)
Religion Adherents Congregations Evangelical Protestant 534,453 1,206 Catholic 520,651 100 Other 312,574 680 Mainline Protestant 104,145 241 Orthodox 13,379 24 Black Protestant 6,278 48 None 2,325,637 -
Source: Clifford Grammich, Kirk Hadaway, Richard Houseal, Dale E.Jones, Alexei Krindatch, Richie Stanley and Richard H.Taylor. 2012. 2010 U.S.Religion Census: Religious Congregations & Membership Study. Association of Statisticians of American Religious Bodies. Jones, Dale E., et al. 2002. Congregations and Membership in the United States 2000. Nashville, TN: Glenmary Research Center. Graphs represent county-level data
Food Environment Statistics: Number of grocery stores : 501This county :
1.30 / 10,000 pop.Arizona :
1.36 / 10,000 pop.
Number of supercenters and club stores : 60Maricopa County :
0.16 / 10,000 pop.Arizona :
0.14 / 10,000 pop.
Number of convenience stores (no gas) : 219This county :
0.57 / 10,000 pop.Arizona :
0.55 / 10,000 pop.
Number of convenience stores (with gas) : 768This county :
1.99 / 10,000 pop.Arizona :
2.47 / 10,000 pop.
Number of full-service restaurants : 2,264Maricopa County :
5.86 / 10,000 pop.Arizona :
6.21 / 10,000 pop.
Adult diabetes rate : This county :
7.7%Arizona :
8.0%
Adult obesity rate : Maricopa County :
22.5%Arizona :
22.8%
Low-income preschool obesity rate : Maricopa County :
14.8%Arizona :
14.2%
Health and Nutrition:
Average overall health of teeth and gums : This city:
54.6%State:
47.3%
Average BMI : Sun City West:
28.1Arizona:
28.5
People feeling badly about themselves : People not drinking alcohol at all : This city:
12.4%Arizona:
10.2%
Average hours sleeping at night : Sun City West:
7.3Arizona:
6.8
General health condition : This city:
57.5%Arizona:
56.1%
Average condition of hearing : Sun City West:
68.3%State:
79.4%
More about Health and Nutrition of Sun City West, AZ Residents
5.80% of this county's 2021 resident taxpayers lived in other counties in 2020 ($92,013 average adjusted gross income )
Here:
5.80%Arizona average:
6.85%
0.02% of residents moved from foreign countries ($227 average AGI )Maricopa County:
0.02%Arizona average:
0.03%
Top counties from which taxpayers relocated into this county between 2020 and 2021:
5.04% of this county's 2020 resident taxpayers moved to other counties in 2021 ($76,911 average adjusted gross income )
Here:
5.04%Arizona average:
5.72%
0.02% of residents moved to foreign countries ($234 average AGI )Maricopa County:
0.02%Arizona average:
0.03%
Top counties to which taxpayers relocated from this county between 2020 and 2021:
Businesses in Sun City West, AZ
Name Count Name Count
Ace Hardware 1 SAS Shoes 1 Arby's 1 Safeway 1 CVS 1 Starbucks 1 Dairy Queen 1 True Value 1 FedEx 2 UPS 1 Jones New York 1 Vons 1 New Balance 1 Walgreens 2
Strongest AM radio stations in Sun City West:
KPXQ (1360 AM; 50 kW; GLENDALE, AZ; Owner: COMMON GROUND BROADCASTING, INC.)
KFNX (1100 AM; 50 kW; CAVE CREEK, AZ; Owner: NORTH AMERICAN BROADCASTING CO., INC.)
KMIA (710 AM; 50 kW; BLACK CANYON CITY, AZ; Owner: ENTRAVISION HOLDINGS, LLC)
KXEM (1010 AM; 15 kW; TOLLESON, AZ; Owner: JAMES CRYSTAL ENTERPRISES OF PHOENIX, INC.)
KFNN (1510 AM; 22 kW; MESA, AZ; Owner: CRC BROADCASTING COMPANY, INC.)
KMIK (1580 AM; 50 kW; TEMPE, AZ; Owner: ABC, INC.)
KGME (910 AM; 5 kW; PHOENIX, AZ; Owner: AMFM RADIO LICENSES, L.L.C.)
KMYL (1190 AM; 5 kW; TOLLESON, AZ; Owner: INTERSTATE B/C SYSTEM OF AZ, INC.)
KTAR (620 AM; 5 kW; PHOENIX, AZ; Owner: EMMIS RADIO LICENSE CORPORATION)
KKNT (960 AM; 5 kW; PHOENIX, AZ; Owner: COMMON GROUND BROADCASTING, INC)
KFYI (550 AM; 5 kW; PHOENIX, AZ; Owner: AMFM RADIO LICENSES, L.L.C.)
KASA (1540 AM; 10 kW; PHOENIX, AZ; Owner: KASA RADIO HOGAR, INC.)
KXEG (1280 AM; 2 kW; PHOENIX, AZ; Owner: MORTENSON BROADCASTING COMPANY OF ARIZONA, LLC)
Strongest FM radio stations in Sun City West:
KLNZ (103.5 FM; GLENDALE, AZ; Owner: ENTRAVISION HOLDINGS, LLC)
KBAQ (89.5 FM; PHOENIX, AZ; Owner: MARICOPA COUNTY COMMUNITY COLLEGE DISTRICT)
KOMR (106.3 FM; SUN CITY, AZ; Owner: HBC LICENSE CORPORATION)
KMLE (107.9 FM; CHANDLER, AZ; Owner: INFINITY RADIO OPERATIONS INC.)
KNAI (88.3 FM; PHOENIX, AZ; Owner: NATIONAL FARM WORKERS SERVICE CENTER)
K205CI (88.9 FM; PHOENIX, AZ; Owner: FAMILY STATIONS, INC.)
KSLX-FM (100.7 FM; SCOTTSDALE, AZ; Owner: CACTUS RADIO, INC.)
KKLT (98.7 FM; PHOENIX, AZ; Owner: EMMIS RADIO LICENSE CORPORATION)
KZON (101.5 FM; PHOENIX, AZ; Owner: INFINITY RADIO OPERATIONS INC.)
K248AL (97.5 FM; PHOENIX, AZ; Owner: ZORBA RESOURCES, INC.)
KKFR (92.3 FM; GLENDALE, AZ; Owner: EMMIS RADIO LICENSE CORPORATION)
KESZ (99.9 FM; PHOENIX, AZ; Owner: CLEAR CHANNEL BROADCASTING LICENSES, INC.)
KOOL-FM (94.5 FM; PHOENIX, AZ; Owner: INFINITY RADIO OPERATIONS INC.)
KNIX-FM (102.5 FM; PHOENIX, AZ; Owner: CLEAR CHANNEL BROADCASTING LICENSES, INC.)
KUPD (97.9 FM; TEMPE, AZ; Owner: TEMPE RADIO, INC.)
KJZZ (91.5 FM; PHOENIX, AZ; Owner: MARICOPA COUNTY COMM. COLLEGE DIST.)
K220GO (91.9 FM; TEMPE, AZ; Owner: CALVARY CHAPEL OF TWIN FALLS, INC.)
KFLR-FM (90.3 FM; PHOENIX, AZ; Owner: FAMILY LIFE BROADCASTING, INC.)
KYOT-FM (95.5 FM; PHOENIX, AZ; Owner: AMFM RADIO LICENSES, L.L.C.)
KMXP (96.9 FM; PHOENIX, AZ; Owner: CITICASTERS LICENSES, L.P.)
TV broadcast stations around Sun City West:
KAET (Channel 8; PHOENIX, AZ; Owner: ARIZONA BOARD OF REGENTS)
K43GV (Channel 43; PHOENIX, AZ; Owner: TELEVISION APOGEO DE PHOENIX, LLC)
K55EH (Channel 55; PHOENIX, AZ; Owner: KAZT, L.L.C.)
National Bridge Inventory (NBI) Statistics 24 Number of bridges121ft / 36.7m Total length178,521 Total average daily traffic20,271 Total average daily truck traffic178,761 Total future (year 2037) average daily traffic
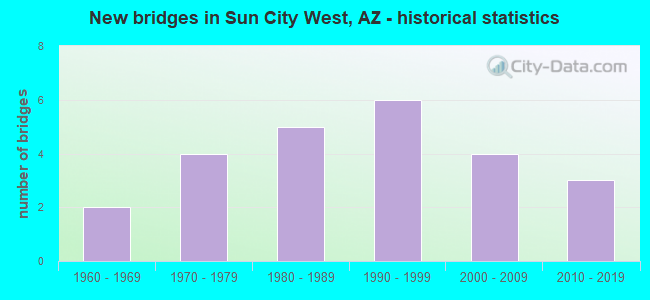
New bridges - historical statistics
2 1960-1969 4 1970-1979 5 1980-1989 6 1990-1999 4 2000-2009 3 2010-2019
See full National Bridge Inventory statistics for Sun City West, AZ
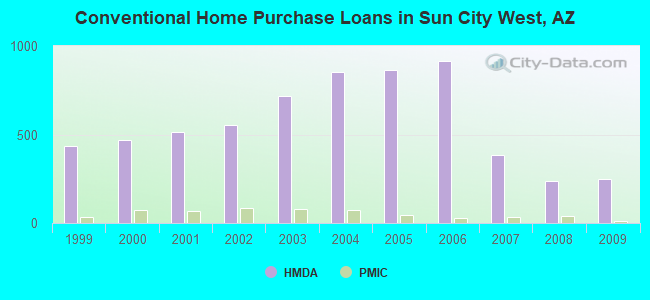
Home Mortgage Disclosure Act Aggregated Statistics For Year 2009(Based on 2 full and 1 partial tracts) A) FHA, FSA/RHS & VA B) Conventional C) Refinancings D) Home Improvement Loans F) Non-occupant Loans on G) Loans On Manufactured Number Average Value Number Average Value Number Average Value Number Average Value Number Average Value Number Average Value
LOANS ORIGINATED 26 $136,892 246 $126,924 353 $135,678 10 $79,574 181 $129,140 1 $142,000 APPLICATIONS APPROVED, NOT ACCEPTED 1 $136,870 15 $138,659 37 $128,774 5 $33,200 13 $113,590 1 $50,000 APPLICATIONS DENIED 8 $144,000 26 $135,974 99 $173,087 7 $84,459 25 $170,810 1 $55,000 APPLICATIONS WITHDRAWN 1 $133,000 15 $118,405 66 $145,322 2 $161,000 18 $121,900 0 $0 FILES CLOSED FOR INCOMPLETENESS 1 $123,000 1 $172,000 15 $119,224 0 $0 2 $112,500 0 $0
Aggregated Statistics For Year 2008(Based on 2 full and 1 partial tracts) A) FHA, FSA/RHS & VA B) Conventional C) Refinancings D) Home Improvement Loans F) Non-occupant Loans on G) Loans On Manufactured Number Average Value Number Average Value Number Average Value Number Average Value Number Average Value Number Average Value
LOANS ORIGINATED 18 $166,306 237 $144,538 189 $146,448 10 $113,934 133 $140,569 2 $73,000 APPLICATIONS APPROVED, NOT ACCEPTED 4 $161,000 23 $146,984 36 $136,352 3 $17,000 17 $145,118 0 $0 APPLICATIONS DENIED 2 $178,640 15 $194,715 78 $186,338 4 $74,220 16 $174,794 0 $0 APPLICATIONS WITHDRAWN 4 $153,715 21 $153,333 48 $175,592 1 $10,000 18 $138,935 0 $0 FILES CLOSED FOR INCOMPLETENESS 0 $0 9 $157,390 6 $178,465 1 $25,000 4 $108,355 0 $0
Aggregated Statistics For Year 2007(Based on 2 full and 1 partial tracts) A) FHA, FSA/RHS & VA B) Conventional C) Refinancings D) Home Improvement Loans F) Non-occupant Loans on G) Loans On Manufactured Number Average Value Number Average Value Number Average Value Number Average Value Number Average Value Number Average Value
LOANS ORIGINATED 6 $203,262 383 $154,636 285 $148,689 36 $118,863 194 $156,717 1 $34,000 APPLICATIONS APPROVED, NOT ACCEPTED 1 $207,000 30 $190,237 64 $157,422 13 $54,400 20 $147,738 1 $185,000 APPLICATIONS DENIED 0 $0 31 $176,000 124 $226,775 16 $135,412 25 $195,623 2 $34,905 APPLICATIONS WITHDRAWN 0 $0 28 $169,156 95 $170,044 4 $216,845 18 $162,036 0 $0 FILES CLOSED FOR INCOMPLETENESS 1 $179,000 11 $175,310 27 $193,945 1 $100,000 9 $133,804 0 $0
Aggregated Statistics For Year 2006(Based on 2 full and 1 partial tracts) A) FHA, FSA/RHS & VA B) Conventional C) Refinancings D) Home Improvement Loans F) Non-occupant Loans on G) Loans On Manufactured Number Average Value Number Average Value Number Average Value Number Average Value Number Average Value Number Average Value
LOANS ORIGINATED 5 $195,400 914 $187,096 396 $153,936 47 $93,767 374 $179,128 0 $0 APPLICATIONS APPROVED, NOT ACCEPTED 0 $0 152 $204,140 53 $196,005 7 $73,606 37 $203,744 2 $58,500 APPLICATIONS DENIED 0 $0 64 $193,965 99 $178,570 16 $82,701 24 $142,060 4 $98,750 APPLICATIONS WITHDRAWN 1 $163,000 81 $216,020 129 $179,356 11 $136,877 32 $201,601 0 $0 FILES CLOSED FOR INCOMPLETENESS 0 $0 14 $144,000 41 $183,047 1 $34,000 9 $167,591 0 $0
Aggregated Statistics For Year 2005(Based on 2 full and 1 partial tracts) A) FHA, FSA/RHS & VA B) Conventional C) Refinancings D) Home Improvement Loans E) Loans on Dwellings For 5+ Families F) Non-occupant Loans on G) Loans On Manufactured Number Average Value Number Average Value Number Average Value Number Average Value Number Average Value Number Average Value Number Average Value
LOANS ORIGINATED 2 $222,750 863 $159,167 441 $133,530 54 $71,718 2 $62,606,725 391 $151,861 0 $0 APPLICATIONS APPROVED, NOT ACCEPTED 0 $0 88 $169,838 48 $126,696 11 $32,025 0 $0 36 $156,003 1 $90,000 APPLICATIONS DENIED 0 $0 81 $161,273 105 $140,804 17 $74,651 0 $0 34 $156,093 0 $0 APPLICATIONS WITHDRAWN 1 $162,000 64 $179,471 94 $133,413 17 $98,966 0 $0 33 $140,825 0 $0 FILES CLOSED FOR INCOMPLETENESS 0 $0 13 $149,409 49 $157,392 3 $27,520 0 $0 5 $129,586 0 $0
Aggregated Statistics For Year 2004(Based on 2 full and 1 partial tracts) A) FHA, FSA/RHS & VA B) Conventional C) Refinancings D) Home Improvement Loans F) Non-occupant Loans on G) Loans On Manufactured Number Average Value Number Average Value Number Average Value Number Average Value Number Average Value Number Average Value
LOANS ORIGINATED 6 $128,352 853 $123,631 344 $103,737 25 $44,551 349 $128,865 3 $47,890 APPLICATIONS APPROVED, NOT ACCEPTED 0 $0 59 $127,319 41 $101,666 10 $23,100 17 $169,576 2 $81,000 APPLICATIONS DENIED 1 $76,240 51 $124,723 93 $108,196 21 $43,820 19 $124,463 5 $54,576 APPLICATIONS WITHDRAWN 1 $106,560 64 $116,962 89 $112,774 10 $49,460 17 $111,418 0 $0 FILES CLOSED FOR INCOMPLETENESS 0 $0 7 $105,857 22 $110,797 2 $46,500 2 $57,500 0 $0
Aggregated Statistics For Year 2003(Based on 2 full and 1 partial tracts) A) FHA, FSA/RHS & VA B) Conventional C) Refinancings D) Home Improvement Loans F) Non-occupant Loans on Number Average Value Number Average Value Number Average Value Number Average Value Number Average Value
LOANS ORIGINATED 25 $123,954 720 $102,690 956 $92,379 22 $22,415 259 $102,137 APPLICATIONS APPROVED, NOT ACCEPTED 2 $138,395 42 $115,683 112 $86,530 9 $35,936 21 $96,401 APPLICATIONS DENIED 2 $131,005 30 $99,000 104 $92,865 14 $22,096 16 $98,975 APPLICATIONS WITHDRAWN 4 $111,588 63 $129,396 150 $104,660 2 $32,765 19 $120,716 FILES CLOSED FOR INCOMPLETENESS 0 $0 7 $138,259 14 $136,153 1 $30,000 1 $113,000
Aggregated Statistics For Year 2002(Based on 2 full and 1 partial tracts) A) FHA, FSA/RHS & VA B) Conventional C) Refinancings D) Home Improvement Loans E) Loans on Dwellings For 5+ Families F) Non-occupant Loans on Number Average Value Number Average Value Number Average Value Number Average Value Number Average Value Number Average Value
LOANS ORIGINATED 19 $111,185 553 $92,621 629 $92,652 14 $27,111 1 $367,440 153 $89,417 APPLICATIONS APPROVED, NOT ACCEPTED 0 $0 29 $88,122 85 $89,658 8 $46,278 0 $0 11 $101,727 APPLICATIONS DENIED 5 $111,488 28 $91,461 77 $89,586 13 $15,446 0 $0 10 $87,337 APPLICATIONS WITHDRAWN 5 $112,126 44 $99,574 68 $105,817 5 $50,956 0 $0 14 $108,292 FILES CLOSED FOR INCOMPLETENESS 1 $140,000 11 $104,078 10 $108,541 2 $13,225 0 $0 1 $110,230
Aggregated Statistics For Year 2001(Based on 2 full and 1 partial tracts) A) FHA, FSA/RHS & VA B) Conventional C) Refinancings D) Home Improvement Loans F) Non-occupant Loans on Number Average Value Number Average Value Number Average Value Number Average Value Number Average Value
LOANS ORIGINATED 36 $114,883 513 $88,445 458 $86,320 34 $25,955 125 $94,922 APPLICATIONS APPROVED, NOT ACCEPTED 0 $0 20 $80,694 58 $78,816 12 $36,648 5 $96,596 APPLICATIONS DENIED 0 $0 17 $78,382 64 $80,423 12 $18,093 4 $77,250 APPLICATIONS WITHDRAWN 3 $113,690 33 $109,235 46 $97,926 5 $28,912 9 $106,887 FILES CLOSED FOR INCOMPLETENESS 0 $0 4 $107,445 6 $116,093 0 $0 0 $0
Aggregated Statistics For Year 2000(Based on 2 full and 1 partial tracts) A) FHA, FSA/RHS & VA B) Conventional C) Refinancings D) Home Improvement Loans F) Non-occupant Loans on Number Average Value Number Average Value Number Average Value Number Average Value Number Average Value
LOANS ORIGINATED 17 $110,202 467 $88,358 101 $73,742 26 $22,645 90 $85,917 APPLICATIONS APPROVED, NOT ACCEPTED 2 $106,045 15 $97,309 20 $66,042 10 $33,834 2 $148,500 APPLICATIONS DENIED 3 $85,000 23 $95,837 31 $79,640 8 $26,952 6 $77,717 APPLICATIONS WITHDRAWN 1 $103,000 45 $107,298 26 $74,993 3 $9,333 6 $80,073 FILES CLOSED FOR INCOMPLETENESS 0 $0 10 $115,296 6 $123,520 0 $0 1 $120,000
Aggregated Statistics For Year 1999(Based on 2 full and 1 partial tracts) A) FHA, FSA/RHS & VA B) Conventional C) Refinancings D) Home Improvement Loans F) Non-occupant Loans on Number Average Value Number Average Value Number Average Value Number Average Value Number Average Value
LOANS ORIGINATED 13 $95,396 433 $89,098 215 $76,398 30 $21,389 146 $86,627 APPLICATIONS APPROVED, NOT ACCEPTED 0 $0 19 $110,842 23 $63,488 11 $17,088 4 $85,828 APPLICATIONS DENIED 4 $88,195 16 $101,664 32 $83,861 10 $21,147 3 $65,280 APPLICATIONS WITHDRAWN 2 $115,345 31 $91,403 36 $74,323 8 $27,806 7 $87,853 FILES CLOSED FOR INCOMPLETENESS 0 $0 10 $85,930 6 $97,670 0 $0 3 $90,693
Detailed HMDA statistics for the following Tracts:
0405.05
, 0405.06 , 0405.07
Private Mortgage Insurance Companies Aggregated Statistics For Year 2009(Based on 2 full and 1 partial tracts) A) Conventional B) Refinancings C) Non-occupant Loans on Number Average Value Number Average Value Number Average Value
LOANS ORIGINATED 14 $159,487 3 $143,040 2 $88,535 APPLICATIONS APPROVED, NOT ACCEPTED 3 $162,980 4 $156,155 0 $0 APPLICATIONS DENIED 0 $0 1 $366,000 0 $0 APPLICATIONS WITHDRAWN 1 $183,000 0 $0 0 $0 FILES CLOSED FOR INCOMPLETENESS 1 $257,000 0 $0 0 $0
Aggregated Statistics For Year 2008(Based on 2 full and 1 partial tracts) A) Conventional B) Refinancings C) Non-occupant Loans on Number Average Value Number Average Value Number Average Value
LOANS ORIGINATED 39 $182,414 14 $186,657 11 $156,865 APPLICATIONS APPROVED, NOT ACCEPTED 9 $159,384 4 $145,575 3 $180,333 APPLICATIONS DENIED 0 $0 2 $146,885 0 $0 APPLICATIONS WITHDRAWN 1 $192,000 0 $0 0 $0 FILES CLOSED FOR INCOMPLETENESS 0 $0 0 $0 0 $0
Aggregated Statistics For Year 2007(Based on 2 full and 1 partial tracts) A) Conventional B) Refinancings C) Non-occupant Loans on Number Average Value Number Average Value Number Average Value
LOANS ORIGINATED 36 $190,315 6 $204,293 7 $191,920 APPLICATIONS APPROVED, NOT ACCEPTED 4 $147,395 3 $183,117 1 $153,410 APPLICATIONS DENIED 0 $0 0 $0 0 $0 APPLICATIONS WITHDRAWN 0 $0 1 $225,000 0 $0 FILES CLOSED FOR INCOMPLETENESS 0 $0 0 $0 0 $0
Aggregated Statistics For Year 2006(Based on 2 full and 1 partial tracts) A) Conventional B) Refinancings C) Non-occupant Loans on Number Average Value Number Average Value Number Average Value
LOANS ORIGINATED 26 $201,517 10 $209,350 7 $188,817 APPLICATIONS APPROVED, NOT ACCEPTED 2 $253,540 2 $373,780 0 $0 APPLICATIONS DENIED 0 $0 0 $0 0 $0 APPLICATIONS WITHDRAWN 0 $0 2 $220,500 0 $0 FILES CLOSED FOR INCOMPLETENESS 0 $0 0 $0 0 $0
Aggregated Statistics For Year 2005(Based on 2 full and 1 partial tracts) A) Conventional B) Refinancings C) Non-occupant Loans on Number Average Value Number Average Value Number Average Value
LOANS ORIGINATED 43 $188,463 12 $206,031 14 $167,112 APPLICATIONS APPROVED, NOT ACCEPTED 10 $181,380 1 $120,000 4 $196,580 APPLICATIONS DENIED 0 $0 0 $0 0 $0 APPLICATIONS WITHDRAWN 5 $180,016 0 $0 1 $196,000 FILES CLOSED FOR INCOMPLETENESS 0 $0 0 $0 0 $0
Aggregated Statistics For Year 2004(Based on 2 full and 1 partial tracts) A) Conventional B) Refinancings C) Non-occupant Loans on Number Average Value Number Average Value Number Average Value
LOANS ORIGINATED 74 $146,599 13 $136,575 23 $164,850 APPLICATIONS APPROVED, NOT ACCEPTED 8 $138,744 2 $100,585 1 $157,080 APPLICATIONS DENIED 0 $0 0 $0 0 $0 APPLICATIONS WITHDRAWN 3 $103,193 1 $267,000 1 $267,000 FILES CLOSED FOR INCOMPLETENESS 0 $0 0 $0 0 $0
Aggregated Statistics For Year 2003(Based on 2 full and 1 partial tracts) A) Conventional B) Refinancings C) Non-occupant Loans on Number Average Value Number Average Value Number Average Value
LOANS ORIGINATED 78 $119,921 28 $126,981 15 $105,457 APPLICATIONS APPROVED, NOT ACCEPTED 6 $114,235 11 $115,188 6 $110,768 APPLICATIONS DENIED 0 $0 1 $115,740 0 $0 APPLICATIONS WITHDRAWN 2 $140,545 3 $120,493 2 $127,465 FILES CLOSED FOR INCOMPLETENESS 0 $0 0 $0 0 $0
Aggregated Statistics For Year 2002(Based on 2 full and 1 partial tracts) A) Conventional B) Refinancings C) Non-occupant Loans on Number Average Value Number Average Value Number Average Value
LOANS ORIGINATED 85 $113,937 25 $114,049 13 $88,737 APPLICATIONS APPROVED, NOT ACCEPTED 8 $120,245 6 $116,777 0 $0 APPLICATIONS DENIED 0 $0 0 $0 0 $0 APPLICATIONS WITHDRAWN 3 $105,707 2 $91,285 1 $72,570 FILES CLOSED FOR INCOMPLETENESS 0 $0 0 $0 0 $0
Aggregated Statistics For Year 2001(Based on 2 full and 1 partial tracts) A) Conventional B) Refinancings C) Non-occupant Loans on Number Average Value Number Average Value Number Average Value
LOANS ORIGINATED 67 $105,539 12 $112,974 19 $98,125 APPLICATIONS APPROVED, NOT ACCEPTED 10 $113,756 1 $99,000 1 $77,000 APPLICATIONS DENIED 2 $62,730 1 $99,000 1 $62,460 APPLICATIONS WITHDRAWN 0 $0 0 $0 0 $0 FILES CLOSED FOR INCOMPLETENESS 0 $0 2 $113,000 0 $0
Aggregated Statistics For Year 2000(Based on 2 full and 1 partial tracts) A) Conventional B) Refinancings C) Non-occupant Loans on Number Average Value Number Average Value Number Average Value
LOANS ORIGINATED 71 $106,158 3 $110,233 20 $96,888 APPLICATIONS APPROVED, NOT ACCEPTED 6 $103,212 0 $0 3 $90,330 APPLICATIONS DENIED 0 $0 1 $132,280 0 $0 APPLICATIONS WITHDRAWN 3 $101,460 0 $0 0 $0 FILES CLOSED FOR INCOMPLETENESS 0 $0 0 $0 0 $0
Aggregated Statistics For Year 1999(Based on 2 full and 1 partial tracts) A) Conventional B) Refinancings C) Non-occupant Loans on Number Average Value Number Average Value Number Average Value
LOANS ORIGINATED 35 $102,182 6 $105,040 7 $82,443 APPLICATIONS APPROVED, NOT ACCEPTED 1 $174,390 1 $99,390 1 $99,390 APPLICATIONS DENIED 0 $0 0 $0 0 $0 APPLICATIONS WITHDRAWN 2 $95,910 0 $0 1 $124,240 FILES CLOSED FOR INCOMPLETENESS 1 $138,150 0 $0 1 $138,150
Detailed PMIC statistics for the following Tracts:
0405.05
, 0405.06 , 0405.07
Most common first names in Sun City West, AZ among deceased individuals Name Count Lived (average)
Robert 423 78.0 years John 384 78.8 years William 328 79.0 years Mary 255 82.8 years James 244 77.3 years Charles 185 79.2 years George 183 78.9 years Helen 173 84.0 years Richard 170 75.8 years Donald 169 77.5 years
Most common last names in Sun City West, AZ among deceased individuals Last name Count Lived (average)
Smith 91 81.3 years Johnson 85 81.2 years Anderson 63 79.2 years Brown 47 82.8 years Miller 44 80.0 years Williams 38 81.1 years Jones 38 83.2 years Nelson 38 82.5 years Wilson 34 78.8 years Peterson 30 82.3 years
Sun City West compared to Arizona state average:
Unemployed percentage below state average. Black race population percentage significantly below state average. Hispanic race population percentage significantly below state average. Median age significantly above state average. Foreign-born population percentage significantly below state average. Renting percentage significantly below state average. Length of stay since moving in significantly above state average. Number of college students significantly below state average. Percentage of population with a bachelor's degree or higher above state average. Sun City West on our top lists :
#3 on the list of "Top 101 cities with the most people born in other U.S. states (population 5,000+)"
#4 on the list of "Top 101 cities with the highest percentage of single-parent households, population 5,000+"
#17 on the list of "Top 100 cities with oldest residents"
#26 on the list of "Top 101 cities with largest percentage of males in industries: arts, entertainment, and recreation (population 5,000+)"
#26 on the list of "Top 101 cities with largest percentage of males in industries: real estate and rental and leasing (population 5,000+)"
#33 on the list of "Top 101 cities with largest percentage of males in occupations: sales and related occupations (population 5,000+)"
#37 on the list of "Top 100 cities with the largest percentage of females (pop. 5,000+)"
#48 on the list of "Top 101 cities with largest percentage of females in industries: arts, entertainment, and recreation (population 5,000+)"
#74 on the list of "Top 101 cities with largest percentage of males in occupations: community and social service occupations (population 5,000+)"
#78 on the list of "Top 101 cities with largest percentage of males in occupations: personal care and service occupations (population 5,000+)"
#1 (85375) on the list of "Top 101 zip codes with the smallest percentage of returns reporting salary or wage in 2012 (pop 5,000+)"
#13 (85375) on the list of "Top 101 zip codes with the largest percentage of taxpayers reporting taxable interest in 2012 (pop 5,000+)"
#2 on the list of "Top 101 counties with the highest Nitrogen Dioxide air pollution readings in 2012 (ppm)"
#3 on the list of "Top 101 counties with the highest total withdrawal of fresh water for public supply"
#3 on the list of "Top 101 counties with the highest surface withdrawal of fresh water for public supply"
#4 on the list of "Top 101 counties with the most Other congregations"
#5 on the list of "Top 101 counties with the most Evangelical Protestant adherents (pop. 50,000+)"
Top Patent Applicants
Dave Pepitone (33)
David Pepitone (12)
Jerome H. Ludwig (5)
Roger John Petterson (4)
Mark Falash (1)
Edward Anders (1)
Roger D. Garrels (1)
Paul Adrian Fisher (1)
Lynn Marie Picinich (1)
Laymond D. Harrier (1)
Total of 67 patent applications in 2008-2024.


 Recent articles from our blog. Our writers, many of them Ph.D. graduates or candidates, create easy-to-read articles on a wide variety of topics.

 (6.3 miles
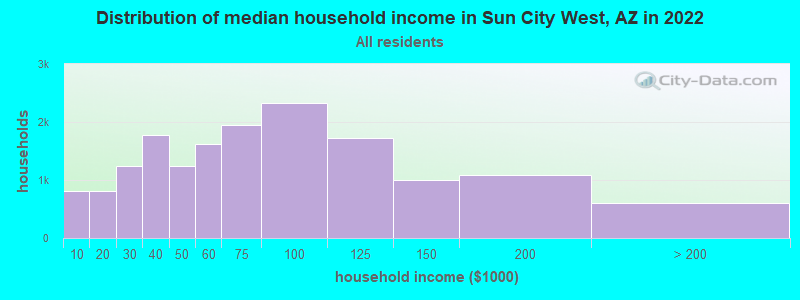


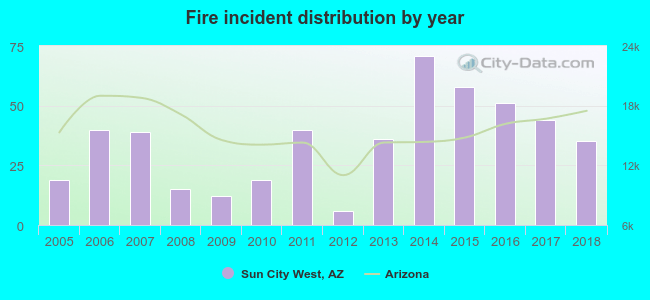 Based on the data from the years 2005 - 2018 the average number of fires per year is 35. The highest number of fires - 71 took place in 2014, and the least - 6 in 2012. The data has a growing trend.
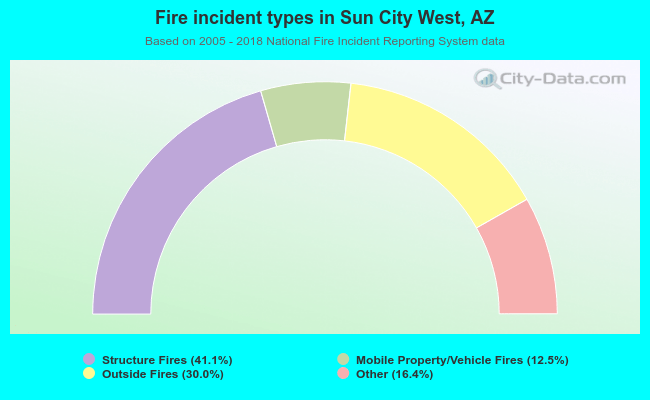 When looking into fire subcategories, the most incidents belonged to: Structure Fires (41.1%), and Outside Fires (30.0%).