Avondale, Arizona Submit your own pictures of this city and show them to the world
OSM Map
General Map
Google Map
MSN Map
OSM Map
General Map
Google Map
MSN Map
OSM Map
General Map
Google Map
MSN Map
OSM Map
General Map
Google Map
MSN Map
Please wait while loading the map...
Population in 2022: 91,617 (100% urban, 0% rural). Population change since 2000: +155.3%Males: 44,889 Females: 46,728
March 2022 cost of living index in Avondale: 101.3 (near average, U.S. average is 100) Percentage of residents living in poverty in 2022: 11.3%for White Non-Hispanic residents , 9.9% for Black residents , 12.5% for Hispanic or Latino residents , 22.7% for American Indian residents , 12.5% for other race residents , 11.3% for two or more races residents )
Profiles of local businesses
Business Search - 14 Million verified businesses
Data:
Median household income ($)
Median household income (% change since 2000)
Household income diversity
Ratio of average income to average house value (%)
Ratio of average income to average rent
Median household income ($) - White
Median household income ($) - Black or African American
Median household income ($) - Asian
Median household income ($) - Hispanic or Latino
Median household income ($) - American Indian and Alaska Native
Median household income ($) - Multirace
Median household income ($) - Other Race
Median household income for houses/condos with a mortgage ($)
Median household income for apartments without a mortgage ($)
Races - White alone (%)
Races - White alone (% change since 2000)
Races - Black alone (%)
Races - Black alone (% change since 2000)
Races - American Indian alone (%)
Races - American Indian alone (% change since 2000)
Races - Asian alone (%)
Races - Asian alone (% change since 2000)
Races - Hispanic (%)
Races - Hispanic (% change since 2000)
Races - Native Hawaiian and Other Pacific Islander alone (%)
Races - Native Hawaiian and Other Pacific Islander alone (% change since 2000)
Races - Two or more races (%)
Races - Two or more races (% change since 2000)
Races - Other race alone (%)
Races - Other race alone (% change since 2000)
Racial diversity
Unemployment (%)
Unemployment (% change since 2000)
Unemployment (%) - White
Unemployment (%) - Black or African American
Unemployment (%) - Asian
Unemployment (%) - Hispanic or Latino
Unemployment (%) - American Indian and Alaska Native
Unemployment (%) - Multirace
Unemployment (%) - Other Race
Population density (people per square mile)
Population - Males (%)
Population - Females (%)
Population - Males (%) - White
Population - Males (%) - Black or African American
Population - Males (%) - Asian
Population - Males (%) - Hispanic or Latino
Population - Males (%) - American Indian and Alaska Native
Population - Males (%) - Multirace
Population - Males (%) - Other Race
Population - Females (%) - White
Population - Females (%) - Black or African American
Population - Females (%) - Asian
Population - Females (%) - Hispanic or Latino
Population - Females (%) - American Indian and Alaska Native
Population - Females (%) - Multirace
Population - Females (%) - Other Race
Coronavirus confirmed cases (Apr 27, 2024)
Deaths caused by coronavirus (Apr 27, 2024)
Coronavirus confirmed cases (per 100k population) (Apr 27, 2024)
Deaths caused by coronavirus (per 100k population) (Apr 27, 2024)
Daily increase in number of cases (Apr 27, 2024)
Weekly increase in number of cases (Apr 27, 2024)
Cases doubled (in days) (Apr 27, 2024)
Hospitalized patients (Apr 18, 2022)
Negative test results (Apr 18, 2022)
Total test results (Apr 18, 2022)
COVID Vaccine doses distributed (per 100k population) (Sep 19, 2023)
COVID Vaccine doses administered (per 100k population) (Sep 19, 2023)
COVID Vaccine doses distributed (Sep 19, 2023)
COVID Vaccine doses administered (Sep 19, 2023)
Likely homosexual households (%)
Likely homosexual households (% change since 2000)
Likely homosexual households - Lesbian couples (%)
Likely homosexual households - Lesbian couples (% change since 2000)
Likely homosexual households - Gay men (%)
Likely homosexual households - Gay men (% change since 2000)
Cost of living index
Median gross rent ($)
Median contract rent ($)
Median monthly housing costs ($)
Median house or condo value ($)
Median house or condo value ($ change since 2000)
Mean house or condo value by units in structure - 1, detached ($)
Mean house or condo value by units in structure - 1, attached ($)
Mean house or condo value by units in structure - 2 ($)
Mean house or condo value by units in structure by units in structure - 3 or 4 ($)
Mean house or condo value by units in structure - 5 or more ($)
Mean house or condo value by units in structure - Boat, RV, van, etc. ($)
Mean house or condo value by units in structure - Mobile home ($)
Median house or condo value ($) - White
Median house or condo value ($) - Black or African American
Median house or condo value ($) - Asian
Median house or condo value ($) - Hispanic or Latino
Median house or condo value ($) - American Indian and Alaska Native
Median house or condo value ($) - Multirace
Median house or condo value ($) - Other Race
Median resident age
Resident age diversity
Median resident age - Males
Median resident age - Females
Median resident age - White
Median resident age - Black or African American
Median resident age - Asian
Median resident age - Hispanic or Latino
Median resident age - American Indian and Alaska Native
Median resident age - Multirace
Median resident age - Other Race
Median resident age - Males - White
Median resident age - Males - Black or African American
Median resident age - Males - Asian
Median resident age - Males - Hispanic or Latino
Median resident age - Males - American Indian and Alaska Native
Median resident age - Males - Multirace
Median resident age - Males - Other Race
Median resident age - Females - White
Median resident age - Females - Black or African American
Median resident age - Females - Asian
Median resident age - Females - Hispanic or Latino
Median resident age - Females - American Indian and Alaska Native
Median resident age - Females - Multirace
Median resident age - Females - Other Race
Commute - mean travel time to work (minutes)
Travel time to work - Less than 5 minutes (%)
Travel time to work - Less than 5 minutes (% change since 2000)
Travel time to work - 5 to 9 minutes (%)
Travel time to work - 5 to 9 minutes (% change since 2000)
Travel time to work - 10 to 19 minutes (%)
Travel time to work - 10 to 19 minutes (% change since 2000)
Travel time to work - 20 to 29 minutes (%)
Travel time to work - 20 to 29 minutes (% change since 2000)
Travel time to work - 30 to 39 minutes (%)
Travel time to work - 30 to 39 minutes (% change since 2000)
Travel time to work - 40 to 59 minutes (%)
Travel time to work - 40 to 59 minutes (% change since 2000)
Travel time to work - 60 to 89 minutes (%)
Travel time to work - 60 to 89 minutes (% change since 2000)
Travel time to work - 90 or more minutes (%)
Travel time to work - 90 or more minutes (% change since 2000)
Marital status - Never married (%)
Marital status - Now married (%)
Marital status - Separated (%)
Marital status - Widowed (%)
Marital status - Divorced (%)
Median family income ($)
Median family income (% change since 2000)
Median non-family income ($)
Median non-family income (% change since 2000)
Median per capita income ($)
Median per capita income (% change since 2000)
Median family income ($) - White
Median family income ($) - Black or African American
Median family income ($) - Asian
Median family income ($) - Hispanic or Latino
Median family income ($) - American Indian and Alaska Native
Median family income ($) - Multirace
Median family income ($) - Other Race
Median year house/condo built
Median year apartment built
Year house built - Built 2005 or later (%)
Year house built - Built 2000 to 2004 (%)
Year house built - Built 1990 to 1999 (%)
Year house built - Built 1980 to 1989 (%)
Year house built - Built 1970 to 1979 (%)
Year house built - Built 1960 to 1969 (%)
Year house built - Built 1950 to 1959 (%)
Year house built - Built 1940 to 1949 (%)
Year house built - Built 1939 or earlier (%)
Average household size
Household density (households per square mile)
Average household size - White
Average household size - Black or African American
Average household size - Asian
Average household size - Hispanic or Latino
Average household size - American Indian and Alaska Native
Average household size - Multirace
Average household size - Other Race
Occupied housing units (%)
Vacant housing units (%)
Owner occupied housing units (%)
Renter occupied housing units (%)
Vacancy status - For rent (%)
Vacancy status - For sale only (%)
Vacancy status - Rented or sold, not occupied (%)
Vacancy status - For seasonal, recreational, or occasional use (%)
Vacancy status - For migrant workers (%)
Vacancy status - Other vacant (%)
Residents with income below the poverty level (%)
Residents with income below 50% of the poverty level (%)
Children below poverty level (%)
Poor families by family type - Married-couple family (%)
Poor families by family type - Male, no wife present (%)
Poor families by family type - Female, no husband present (%)
Poverty status for native-born residents (%)
Poverty status for foreign-born residents (%)
Poverty among high school graduates not in families (%)
Poverty among people who did not graduate high school not in families (%)
Residents with income below the poverty level (%) - White
Residents with income below the poverty level (%) - Black or African American
Residents with income below the poverty level (%) - Asian
Residents with income below the poverty level (%) - Hispanic or Latino
Residents with income below the poverty level (%) - American Indian and Alaska Native
Residents with income below the poverty level (%) - Multirace
Residents with income below the poverty level (%) - Other Race
Air pollution - Air Quality Index (AQI)
Air pollution - CO
Air pollution - NO2
Air pollution - SO2
Air pollution - Ozone
Air pollution - PM10
Air pollution - PM25
Air pollution - Pb
Crime - Murders per 100,000 population
Crime - Rapes per 100,000 population
Crime - Robberies per 100,000 population
Crime - Assaults per 100,000 population
Crime - Burglaries per 100,000 population
Crime - Thefts per 100,000 population
Crime - Auto thefts per 100,000 population
Crime - Arson per 100,000 population
Crime - City-data.com crime index
Crime - Violent crime index
Crime - Property crime index
Crime - Murders per 100,000 population (5 year average)
Crime - Rapes per 100,000 population (5 year average)
Crime - Robberies per 100,000 population (5 year average)
Crime - Assaults per 100,000 population (5 year average)
Crime - Burglaries per 100,000 population (5 year average)
Crime - Thefts per 100,000 population (5 year average)
Crime - Auto thefts per 100,000 population (5 year average)
Crime - Arson per 100,000 population (5 year average)
Crime - City-data.com crime index (5 year average)
Crime - Violent crime index (5 year average)
Crime - Property crime index (5 year average)
1996 Presidential Elections Results (%) - Democratic Party (Clinton)
1996 Presidential Elections Results (%) - Republican Party (Dole)
1996 Presidential Elections Results (%) - Other
2000 Presidential Elections Results (%) - Democratic Party (Gore)
2000 Presidential Elections Results (%) - Republican Party (Bush)
2000 Presidential Elections Results (%) - Other
2004 Presidential Elections Results (%) - Democratic Party (Kerry)
2004 Presidential Elections Results (%) - Republican Party (Bush)
2004 Presidential Elections Results (%) - Other
2008 Presidential Elections Results (%) - Democratic Party (Obama)
2008 Presidential Elections Results (%) - Republican Party (McCain)
2008 Presidential Elections Results (%) - Other
2012 Presidential Elections Results (%) - Democratic Party (Obama)
2012 Presidential Elections Results (%) - Republican Party (Romney)
2012 Presidential Elections Results (%) - Other
2016 Presidential Elections Results (%) - Democratic Party (Clinton)
2016 Presidential Elections Results (%) - Republican Party (Trump)
2016 Presidential Elections Results (%) - Other
2020 Presidential Elections Results (%) - Democratic Party (Biden)
2020 Presidential Elections Results (%) - Republican Party (Trump)
2020 Presidential Elections Results (%) - Other
Ancestries Reported - Arab (%)
Ancestries Reported - Czech (%)
Ancestries Reported - Danish (%)
Ancestries Reported - Dutch (%)
Ancestries Reported - English (%)
Ancestries Reported - French (%)
Ancestries Reported - French Canadian (%)
Ancestries Reported - German (%)
Ancestries Reported - Greek (%)
Ancestries Reported - Hungarian (%)
Ancestries Reported - Irish (%)
Ancestries Reported - Italian (%)
Ancestries Reported - Lithuanian (%)
Ancestries Reported - Norwegian (%)
Ancestries Reported - Polish (%)
Ancestries Reported - Portuguese (%)
Ancestries Reported - Russian (%)
Ancestries Reported - Scotch-Irish (%)
Ancestries Reported - Scottish (%)
Ancestries Reported - Slovak (%)
Ancestries Reported - Subsaharan African (%)
Ancestries Reported - Swedish (%)
Ancestries Reported - Swiss (%)
Ancestries Reported - Ukrainian (%)
Ancestries Reported - United States (%)
Ancestries Reported - Welsh (%)
Ancestries Reported - West Indian (%)
Ancestries Reported - Other (%)
Educational Attainment - No schooling completed (%)
Educational Attainment - Less than high school (%)
Educational Attainment - High school or equivalent (%)
Educational Attainment - Less than 1 year of college (%)
Educational Attainment - 1 or more years of college (%)
Educational Attainment - Associate degree (%)
Educational Attainment - Bachelor's degree (%)
Educational Attainment - Master's degree (%)
Educational Attainment - Professional school degree (%)
Educational Attainment - Doctorate degree (%)
School Enrollment - Nursery, preschool (%)
School Enrollment - Kindergarten (%)
School Enrollment - Grade 1 to 4 (%)
School Enrollment - Grade 5 to 8 (%)
School Enrollment - Grade 9 to 12 (%)
School Enrollment - College undergrad (%)
School Enrollment - Graduate or professional (%)
School Enrollment - Not enrolled in school (%)
School enrollment - Public schools (%)
School enrollment - Private schools (%)
School enrollment - Not enrolled (%)
Median number of rooms in houses and condos
Median number of rooms in apartments
Housing units lacking complete plumbing facilities (%)
Housing units lacking complete kitchen facilities (%)
Density of houses
Urban houses (%)
Rural houses (%)
Households with people 60 years and over (%)
Households with people 65 years and over (%)
Households with people 75 years and over (%)
Households with one or more nonrelatives (%)
Households with no nonrelatives (%)
Population in households (%)
Family households (%)
Nonfamily households (%)
Population in families (%)
Family households with own children (%)
Median number of bedrooms in owner occupied houses
Mean number of bedrooms in owner occupied houses
Median number of bedrooms in renter occupied houses
Mean number of bedrooms in renter occupied houses
Median number of vehichles in owner occupied houses
Mean number of vehichles in owner occupied houses
Median number of vehichles in renter occupied houses
Mean number of vehichles in renter occupied houses
Mortgage status - with mortgage (%)
Mortgage status - with second mortgage (%)
Mortgage status - with home equity loan (%)
Mortgage status - with both second mortgage and home equity loan (%)
Mortgage status - without a mortgage (%)
Average family size
Average family size - White
Average family size - Black or African American
Average family size - Asian
Average family size - Hispanic or Latino
Average family size - American Indian and Alaska Native
Average family size - Multirace
Average family size - Other Race
Geographical mobility - Same house 1 year ago (%)
Geographical mobility - Moved within same county (%)
Geographical mobility - Moved from different county within same state (%)
Geographical mobility - Moved from different state (%)
Geographical mobility - Moved from abroad (%)
Place of birth - Born in state of residence (%)
Place of birth - Born in other state (%)
Place of birth - Native, outside of US (%)
Place of birth - Foreign born (%)
Housing units in structures - 1, detached (%)
Housing units in structures - 1, attached (%)
Housing units in structures - 2 (%)
Housing units in structures - 3 or 4 (%)
Housing units in structures - 5 to 9 (%)
Housing units in structures - 10 to 19 (%)
Housing units in structures - 20 to 49 (%)
Housing units in structures - 50 or more (%)
Housing units in structures - Mobile home (%)
Housing units in structures - Boat, RV, van, etc. (%)
House/condo owner moved in on average (years ago)
Renter moved in on average (years ago)
Year householder moved into unit - Moved in 1999 to March 2000 (%)
Year householder moved into unit - Moved in 1995 to 1998 (%)
Year householder moved into unit - Moved in 1990 to 1994 (%)
Year householder moved into unit - Moved in 1980 to 1989 (%)
Year householder moved into unit - Moved in 1970 to 1979 (%)
Year householder moved into unit - Moved in 1969 or earlier (%)
Means of transportation to work - Drove car alone (%)
Means of transportation to work - Carpooled (%)
Means of transportation to work - Public transportation (%)
Means of transportation to work - Bus or trolley bus (%)
Means of transportation to work - Streetcar or trolley car (%)
Means of transportation to work - Subway or elevated (%)
Means of transportation to work - Railroad (%)
Means of transportation to work - Ferryboat (%)
Means of transportation to work - Taxicab (%)
Means of transportation to work - Motorcycle (%)
Means of transportation to work - Bicycle (%)
Means of transportation to work - Walked (%)
Means of transportation to work - Other means (%)
Working at home (%)
Industry diversity
Most Common Industries - Agriculture, forestry, fishing and hunting, and mining (%)
Most Common Industries - Agriculture, forestry, fishing and hunting (%)
Most Common Industries - Mining, quarrying, and oil and gas extraction (%)
Most Common Industries - Construction (%)
Most Common Industries - Manufacturing (%)
Most Common Industries - Wholesale trade (%)
Most Common Industries - Retail trade (%)
Most Common Industries - Transportation and warehousing, and utilities (%)
Most Common Industries - Transportation and warehousing (%)
Most Common Industries - Utilities (%)
Most Common Industries - Information (%)
Most Common Industries - Finance and insurance, and real estate and rental and leasing (%)
Most Common Industries - Finance and insurance (%)
Most Common Industries - Real estate and rental and leasing (%)
Most Common Industries - Professional, scientific, and management, and administrative and waste management services (%)
Most Common Industries - Professional, scientific, and technical services (%)
Most Common Industries - Management of companies and enterprises (%)
Most Common Industries - Administrative and support and waste management services (%)
Most Common Industries - Educational services, and health care and social assistance (%)
Most Common Industries - Educational services (%)
Most Common Industries - Health care and social assistance (%)
Most Common Industries - Arts, entertainment, and recreation, and accommodation and food services (%)
Most Common Industries - Arts, entertainment, and recreation (%)
Most Common Industries - Accommodation and food services (%)
Most Common Industries - Other services, except public administration (%)
Most Common Industries - Public administration (%)
Occupation diversity
Most Common Occupations - Management, business, science, and arts occupations (%)
Most Common Occupations - Management, business, and financial occupations (%)
Most Common Occupations - Management occupations (%)
Most Common Occupations - Business and financial operations occupations (%)
Most Common Occupations - Computer, engineering, and science occupations (%)
Most Common Occupations - Computer and mathematical occupations (%)
Most Common Occupations - Architecture and engineering occupations (%)
Most Common Occupations - Life, physical, and social science occupations (%)
Most Common Occupations - Education, legal, community service, arts, and media occupations (%)
Most Common Occupations - Community and social service occupations (%)
Most Common Occupations - Legal occupations (%)
Most Common Occupations - Education, training, and library occupations (%)
Most Common Occupations - Arts, design, entertainment, sports, and media occupations (%)
Most Common Occupations - Healthcare practitioners and technical occupations (%)
Most Common Occupations - Health diagnosing and treating practitioners and other technical occupations (%)
Most Common Occupations - Health technologists and technicians (%)
Most Common Occupations - Service occupations (%)
Most Common Occupations - Healthcare support occupations (%)
Most Common Occupations - Protective service occupations (%)
Most Common Occupations - Fire fighting and prevention, and other protective service workers including supervisors (%)
Most Common Occupations - Law enforcement workers including supervisors (%)
Most Common Occupations - Food preparation and serving related occupations (%)
Most Common Occupations - Building and grounds cleaning and maintenance occupations (%)
Most Common Occupations - Personal care and service occupations (%)
Most Common Occupations - Sales and office occupations (%)
Most Common Occupations - Sales and related occupations (%)
Most Common Occupations - Office and administrative support occupations (%)
Most Common Occupations - Natural resources, construction, and maintenance occupations (%)
Most Common Occupations - Farming, fishing, and forestry occupations (%)
Most Common Occupations - Construction and extraction occupations (%)
Most Common Occupations - Installation, maintenance, and repair occupations (%)
Most Common Occupations - Production, transportation, and material moving occupations (%)
Most Common Occupations - Production occupations (%)
Most Common Occupations - Transportation occupations (%)
Most Common Occupations - Material moving occupations (%)
People in Group quarters - Institutionalized population (%)
People in Group quarters - Correctional institutions (%)
People in Group quarters - Federal prisons and detention centers (%)
People in Group quarters - Halfway houses (%)
People in Group quarters - Local jails and other confinement facilities (including police lockups) (%)
People in Group quarters - Military disciplinary barracks (%)
People in Group quarters - State prisons (%)
People in Group quarters - Other types of correctional institutions (%)
People in Group quarters - Nursing homes (%)
People in Group quarters - Hospitals/wards, hospices, and schools for the handicapped (%)
People in Group quarters - Hospitals/wards and hospices for chronically ill (%)
People in Group quarters - Hospices or homes for chronically ill (%)
People in Group quarters - Military hospitals or wards for chronically ill (%)
People in Group quarters - Other hospitals or wards for chronically ill (%)
People in Group quarters - Hospitals or wards for drug/alcohol abuse (%)
People in Group quarters - Mental (Psychiatric) hospitals or wards (%)
People in Group quarters - Schools, hospitals, or wards for the mentally retarded (%)
People in Group quarters - Schools, hospitals, or wards for the physically handicapped (%)
People in Group quarters - Institutions for the deaf (%)
People in Group quarters - Institutions for the blind (%)
People in Group quarters - Orthopedic wards and institutions for the physically handicapped (%)
People in Group quarters - Wards in general hospitals for patients who have no usual home elsewhere (%)
People in Group quarters - Wards in military hospitals for patients who have no usual home elsewhere (%)
People in Group quarters - Juvenile institutions (%)
People in Group quarters - Long-term care (%)
People in Group quarters - Homes for abused, dependent, and neglected children (%)
People in Group quarters - Residential treatment centers for emotionally disturbed children (%)
People in Group quarters - Training schools for juvenile delinquents (%)
People in Group quarters - Short-term care, detention or diagnostic centers for delinquent children (%)
People in Group quarters - Type of juvenile institution unknown (%)
People in Group quarters - Noninstitutionalized population (%)
People in Group quarters - College dormitories (includes college quarters off campus) (%)
People in Group quarters - Military quarters (%)
People in Group quarters - On base (%)
People in Group quarters - Barracks, unaccompanied personnel housing (UPH), (Enlisted/Officer), ;and similar group living quarters for military personnel (%)
People in Group quarters - Transient quarters for temporary residents (%)
People in Group quarters - Military ships (%)
People in Group quarters - Group homes (%)
People in Group quarters - Homes or halfway houses for drug/alcohol abuse (%)
People in Group quarters - Homes for the mentally ill (%)
People in Group quarters - Homes for the mentally retarded (%)
People in Group quarters - Homes for the physically handicapped (%)
People in Group quarters - Other group homes (%)
People in Group quarters - Religious group quarters (%)
People in Group quarters - Dormitories (%)
People in Group quarters - Agriculture workers' dormitories on farms (%)
People in Group quarters - Job Corps and vocational training facilities (%)
People in Group quarters - Other workers' dormitories (%)
People in Group quarters - Crews of maritime vessels (%)
People in Group quarters - Other nonhousehold living situations (%)
People in Group quarters - Other noninstitutional group quarters (%)
Residents speaking English at home (%)
Residents speaking English at home - Born in the United States (%)
Residents speaking English at home - Native, born elsewhere (%)
Residents speaking English at home - Foreign born (%)
Residents speaking Spanish at home (%)
Residents speaking Spanish at home - Born in the United States (%)
Residents speaking Spanish at home - Native, born elsewhere (%)
Residents speaking Spanish at home - Foreign born (%)
Residents speaking other language at home (%)
Residents speaking other language at home - Born in the United States (%)
Residents speaking other language at home - Native, born elsewhere (%)
Residents speaking other language at home - Foreign born (%)
Class of Workers - Employee of private company (%)
Class of Workers - Self-employed in own incorporated business (%)
Class of Workers - Private not-for-profit wage and salary workers (%)
Class of Workers - Local government workers (%)
Class of Workers - State government workers (%)
Class of Workers - Federal government workers (%)
Class of Workers - Self-employed workers in own not incorporated business and Unpaid family workers (%)
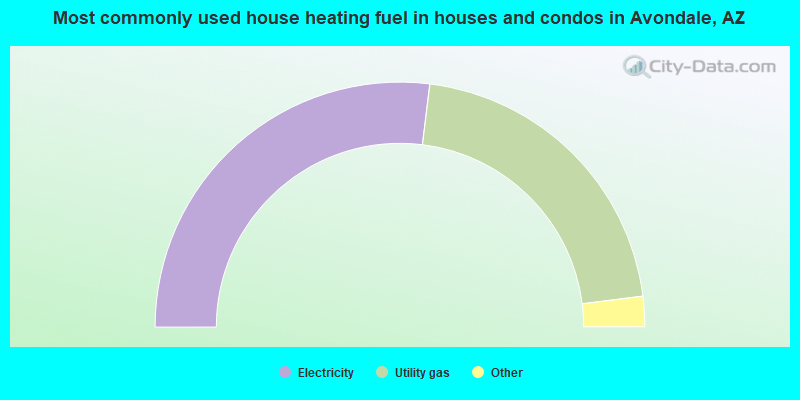
House heating fuel used in houses and condos - Utility gas (%)
House heating fuel used in houses and condos - Bottled, tank, or LP gas (%)
House heating fuel used in houses and condos - Electricity (%)
House heating fuel used in houses and condos - Fuel oil, kerosene, etc. (%)
House heating fuel used in houses and condos - Coal or coke (%)
House heating fuel used in houses and condos - Wood (%)
House heating fuel used in houses and condos - Solar energy (%)
House heating fuel used in houses and condos - Other fuel (%)
House heating fuel used in houses and condos - No fuel used (%)
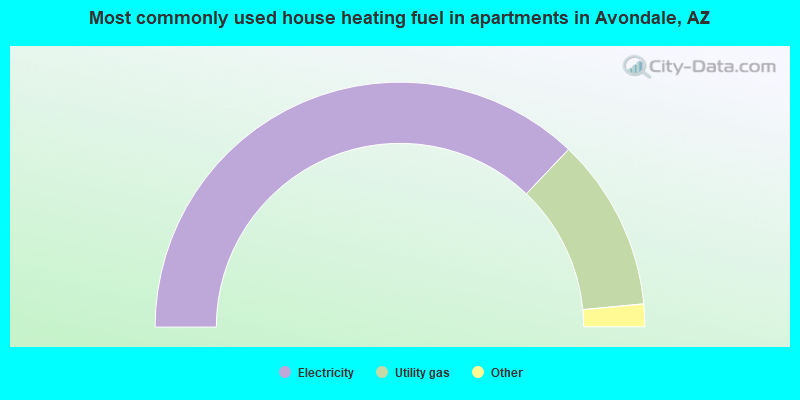
House heating fuel used in apartments - Utility gas (%)
House heating fuel used in apartments - Bottled, tank, or LP gas (%)
House heating fuel used in apartments - Electricity (%)
House heating fuel used in apartments - Fuel oil, kerosene, etc. (%)
House heating fuel used in apartments - Coal or coke (%)
House heating fuel used in apartments - Wood (%)
House heating fuel used in apartments - Solar energy (%)
House heating fuel used in apartments - Other fuel (%)
House heating fuel used in apartments - No fuel used (%)
Armed forces status - In Armed Forces (%)
Armed forces status - Civilian (%)
Armed forces status - Civilian - Veteran (%)
Armed forces status - Civilian - Nonveteran (%)
Fatal accidents locations in years 2005-2021
Fatal accidents locations in 2005
Fatal accidents locations in 2006
Fatal accidents locations in 2007
Fatal accidents locations in 2008
Fatal accidents locations in 2009
Fatal accidents locations in 2010
Fatal accidents locations in 2011
Fatal accidents locations in 2012
Fatal accidents locations in 2013
Fatal accidents locations in 2014
Fatal accidents locations in 2015
Fatal accidents locations in 2016
Fatal accidents locations in 2017
Fatal accidents locations in 2018
Fatal accidents locations in 2019
Fatal accidents locations in 2020
Fatal accidents locations in 2021
Alcohol use - People drinking some alcohol every month (%)
Alcohol use - People not drinking at all (%)
Alcohol use - Average days/month drinking alcohol
Alcohol use - Average drinks/week
Alcohol use - Average days/year people drink much
Audiometry - Average condition of hearing (%)
Audiometry - People that can hear a whisper from across a quiet room (%)
Audiometry - People that can hear normal voice from across a quiet room (%)
Audiometry - Ears ringing, roaring, buzzing (%)
Audiometry - Had a job exposure to loud noise (%)
Audiometry - Had off-work exposure to loud noise (%)
Blood Pressure & Cholesterol - Has high blood pressure (%)
Blood Pressure & Cholesterol - Checking blood pressure at home (%)
Blood Pressure & Cholesterol - Frequently checking blood cholesterol (%)
Blood Pressure & Cholesterol - Has high cholesterol level (%)
Consumer Behavior - Money monthly spent on food at supermarket/grocery store
Consumer Behavior - Money monthly spent on food at other stores
Consumer Behavior - Money monthly spent on eating out
Consumer Behavior - Money monthly spent on carryout/delivered foods
Consumer Behavior - Income spent on food at supermarket/grocery store (%)
Consumer Behavior - Income spent on food at other stores (%)
Consumer Behavior - Income spent on eating out (%)
Consumer Behavior - Income spent on carryout/delivered foods (%)
Current Health Status - General health condition (%)
Current Health Status - Blood donors (%)
Current Health Status - Has blood ever tested for HIV virus (%)
Current Health Status - Left-handed people (%)
Dermatology - People using sunscreen (%)
Diabetes - Diabetics (%)
Diabetes - Had a blood test for high blood sugar (%)
Diabetes - People taking insulin (%)
Diet Behavior & Nutrition - Diet health (%)
Diet Behavior & Nutrition - Milk product consumption (# of products/month)
Diet Behavior & Nutrition - Meals not home prepared (#/week)
Diet Behavior & Nutrition - Meals from fast food or pizza place (#/week)
Diet Behavior & Nutrition - Ready-to-eat foods (#/month)
Diet Behavior & Nutrition - Frozen meals/pizza (#/month)
Drug Use - People that ever used marijuana or hashish (%)
Drug Use - Ever used hard drugs (%)
Drug Use - Ever used any form of cocaine (%)
Drug Use - Ever used heroin (%)
Drug Use - Ever used methamphetamine (%)
Health Insurance - People covered by health insurance (%)
Kidney Conditions-Urology - Avg. # of times urinating at night
Medical Conditions - People with asthma (%)
Medical Conditions - People with anemia (%)
Medical Conditions - People with psoriasis (%)
Medical Conditions - People with overweight (%)
Medical Conditions - Elderly people having difficulties in thinking or remembering (%)
Medical Conditions - People who ever received blood transfusion (%)
Medical Conditions - People having trouble seeing even with glass/contacts (%)
Medical Conditions - People with arthritis (%)
Medical Conditions - People with gout (%)
Medical Conditions - People with congestive heart failure (%)
Medical Conditions - People with coronary heart disease (%)
Medical Conditions - People with angina pectoris (%)
Medical Conditions - People who ever had heart attack (%)
Medical Conditions - People who ever had stroke (%)
Medical Conditions - People with emphysema (%)
Medical Conditions - People with thyroid problem (%)
Medical Conditions - People with chronic bronchitis (%)
Medical Conditions - People with any liver condition (%)
Medical Conditions - People who ever had cancer or malignancy (%)
Mental Health - People who have little interest in doing things (%)
Mental Health - People feeling down, depressed, or hopeless (%)
Mental Health - People who have trouble sleeping or sleeping too much (%)
Mental Health - People feeling tired or having little energy (%)
Mental Health - People with poor appetite or overeating (%)
Mental Health - People feeling bad about themself (%)
Mental Health - People who have trouble concentrating on things (%)
Mental Health - People moving or speaking slowly or too fast (%)
Mental Health - People having thoughts they would be better off dead (%)
Oral Health - Average years since last visit a dentist
Oral Health - People embarrassed because of mouth (%)
Oral Health - People with gum disease (%)
Oral Health - General health of teeth and gums (%)
Oral Health - Average days a week using dental floss/device
Oral Health - Average days a week using mouthwash for dental problem
Oral Health - Average number of teeth
Pesticide Use - Households using pesticides to control insects (%)
Pesticide Use - Households using pesticides to kill weeds (%)
Physical Activity - People doing vigorous-intensity work activities (%)
Physical Activity - People doing moderate-intensity work activities (%)
Physical Activity - People walking or bicycling (%)
Physical Activity - People doing vigorous-intensity recreational activities (%)
Physical Activity - People doing moderate-intensity recreational activities (%)
Physical Activity - Average hours a day doing sedentary activities
Physical Activity - Average hours a day watching TV or videos
Physical Activity - Average hours a day using computer
Physical Functioning - People having limitations keeping them from working (%)
Physical Functioning - People limited in amount of work they can do (%)
Physical Functioning - People that need special equipment to walk (%)
Physical Functioning - People experiencing confusion/memory problems (%)
Physical Functioning - People requiring special healthcare equipment (%)
Prescription Medications - Average number of prescription medicines taking
Preventive Aspirin Use - Adults 40+ taking low-dose aspirin (%)
Reproductive Health - Vaginal deliveries (%)
Reproductive Health - Cesarean deliveries (%)
Reproductive Health - Deliveries resulted in a live birth (%)
Reproductive Health - Pregnancies resulted in a delivery (%)
Reproductive Health - Women breastfeeding newborns (%)
Reproductive Health - Women that had a hysterectomy (%)
Reproductive Health - Women that had both ovaries removed (%)
Reproductive Health - Women that have ever taken birth control pills (%)
Reproductive Health - Women taking birth control pills (%)
Reproductive Health - Women that have ever used Depo-Provera or injectables (%)
Reproductive Health - Women that have ever used female hormones (%)
Sexual Behavior - People 18+ that ever had sex (vaginal, anal, or oral) (%)
Sexual Behavior - Males 18+ that ever had vaginal sex with a woman (%)
Sexual Behavior - Males 18+ that ever performed oral sex on a woman (%)
Sexual Behavior - Males 18+ that ever had anal sex with a woman (%)
Sexual Behavior - Males 18+ that ever had any sex with a man (%)
Sexual Behavior - Females 18+ that ever had vaginal sex with a man (%)
Sexual Behavior - Females 18+ that ever performed oral sex on a man (%)
Sexual Behavior - Females 18+ that ever had anal sex with a man (%)
Sexual Behavior - Females 18+ that ever had any kind of sex with a woman (%)
Sexual Behavior - Average age people first had sex
Sexual Behavior - Average number of female sex partners in lifetime (males 18+)
Sexual Behavior - Average number of female vaginal sex partners in lifetime (males 18+)
Sexual Behavior - Average age people first performed oral sex on a woman (18+)
Sexual Behavior - Average number of woman performed oral sex on in lifetime (18+)
Sexual Behavior - Average number of male sex partners in lifetime (males 18+)
Sexual Behavior - Average number of male anal sex partners in lifetime (males 18+)
Sexual Behavior - Average age people first performed oral sex on a man (18+)
Sexual Behavior - Average number of male oral sex partners in lifetime (18+)
Sexual Behavior - People using protection when performing oral sex (%)
Sexual Behavior - Average number of times people have vaginal or anal sex a year
Sexual Behavior - People having sex without condom (%)
Sexual Behavior - Average number of male sex partners in lifetime (females 18+)
Sexual Behavior - Average number of male vaginal sex partners in lifetime (females 18+)
Sexual Behavior - Average number of female sex partners in lifetime (females 18+)
Sexual Behavior - Circumcised males 18+ (%)
Sleep Disorders - Average hours sleeping at night
Sleep Disorders - People that has trouble sleeping (%)
Smoking-Cigarette Use - People smoking cigarettes (%)
Taste & Smell - People 40+ having problems with smell (%)
Taste & Smell - People 40+ having problems with taste (%)
Taste & Smell - People 40+ that ever had wisdom teeth removed (%)
Taste & Smell - People 40+ that ever had tonsils teeth removed (%)
Taste & Smell - People 40+ that ever had a loss of consciousness because of a head injury (%)
Taste & Smell - People 40+ that ever had a broken nose or other serious injury to face or skull (%)
Taste & Smell - People 40+ that ever had two or more sinus infections (%)
Weight - Average height (inches)
Weight - Average weight (pounds)
Weight - Average BMI
Weight - People that are obese (%)
Weight - People that ever were obese (%)
Weight - People trying to lose weight (%)
50,291 54.9% Hispanic 24,716 27.0% White alone 11,493 12.5% Black alone 2,874 3.1% Asian alone 1,451 1.6% Two or more races 488 0.5% Other race alone 193 0.2% Native Hawaiian and Other 112 0.1% American Indian alone
According to our research of Arizona and other state lists, there were 53 registered sex offenders living in Avondale, Arizona as of April 26, 2024 . The ratio of all residents to sex offenders in Avondale is 1,564 to 1.The ratio of registered sex offenders to all residents in this city is lower than the state average.
The City-Data.com crime index weighs serious crimes and violent crimes more heavily. Higher means more crime, U.S. average is 246.1. It adjusts for the number of visitors and daily workers commuting into cities.
- means the value is smaller than the state average.
- means the value is about the same as the state average.
- means the value is bigger than the state average.
- means the value is much bigger than the state average.
Crime rate in Avondale detailed stats: murders, rapes, robberies, assaults, burglaries, thefts, arson Officers per 1,000 residents here:
1.43Arizona average:
1.75
Latest news from Avondale, AZ collected exclusively by city-data.com from local newspapers, TV, and radio stations
Ancestries: American (3.8%), German (2.6%), Irish (2.5%), English (2.4%), European (2.1%), Italian (1.4%).
Current Local Time:
Land area: 41.3 square miles.
Population density: 2,221 people per square mile (low).
16,075 residents are foreign born (13.0% Latin America , 2.6% Asia ).
This city:
17.5%Arizona:
13.0%
Median real estate property taxes paid for housing units with mortgages in 2022: $1,760 (0.4%)Median real estate property taxes paid for housing units with no mortgage in 2022: $1,840 (0.5%)
Nearest city with pop. 50,000+: Glendale, AZ
Nearest city with pop. 1,000,000+: Phoenix, AZ
Nearest cities:
Latitude: 33.45 N, Longitude: 112.32 W
Daytime population change due to commuting: -16,853 (-18.4%)Workers who live and work in this city: 13,579 (27.9%)
Property values in Avondale, AZ
Avondale tourist attractions:
Single-family new house construction building permits:
2022: 1393 buildings , average cost: $236,7002021: 741 buildings , average cost: $288,9002020: 549 buildings , average cost: $278,9002019: 104 buildings , average cost: $275,1002018: 232 buildings , average cost: $240,5002017: 252 buildings , average cost: $244,1002016: 355 buildings , average cost: $243,3002015: 123 buildings , average cost: $286,5002014: 42 buildings , average cost: $291,0002013: 56 buildings , average cost: $241,7002012: 5 buildings , average cost: $208,7002011: 32 buildings , average cost: $237,9002010: 59 buildings , average cost: $209,9002009: 110 buildings , average cost: $201,0002008: 160 buildings , average cost: $201,2002007: 698 buildings , average cost: $183,9002006: 922 buildings , average cost: $183,1002005: 1469 buildings , average cost: $193,0002004: 2243 buildings , average cost: $179,6002003: 1221 buildings , average cost: $155,2002002: 2044 buildings , average cost: $148,8002001: 2310 buildings , average cost: $103,1002000: 1286 buildings , average cost: $79,4001999: 997 buildings , average cost: $76,2001998: 1359 buildings , average cost: $77,2001997: 770 buildings , average cost: $78,100Unemployment in December 2023:
Population change in the 1990s: +18,331 (+104.4%).
Most common occupations in Avondale, AZ (%)
Both Males Females
Building and grounds cleaning and maintenance occupations (4.3%)
Other management occupations, except farmers and farm managers (4.2%)
Other office and administrative support workers, including supervisors (4.2%)
Other sales and related occupations, including supervisors (3.9%)
Other production occupations, including supervisors (3.9%)
Driver/sales workers and truck drivers (3.0%)
Information and record clerks, except customer service representatives (2.8%)
Driver/sales workers and truck drivers (5.0%)
Building and grounds cleaning and maintenance occupations (5.0%)
Other production occupations, including supervisors (4.9%)
Other management occupations, except farmers and farm managers (4.4%)
Electrical equipment mechanics and other installation, maintenance, and repair workers, including supervisors (4.4%)
Other sales and related occupations, including supervisors (4.2%)
Construction traders workers except carpenters, electricians, painters, plumbers, and construction laborers (3.6%)
Other office and administrative support workers, including supervisors (6.9%)
Information and record clerks, except customer service representatives (5.3%)
Secretaries and administrative assistants (5.1%)
Other management occupations, except farmers and farm managers (4.0%)
Registered nurses (3.8%)
Other sales and related occupations, including supervisors (3.6%)
Preschool, kindergarten, elementary, and middle school teachers (3.6%)
Earthquake activity:
Avondale-area historical earthquake activity is significantly above Arizona state average. It is 2645% greater than the overall U.S. average. On 6/28/1992 at 11:57:34, a magnitude 7.6 (6.2 MB, 7.6 MS, 7.3 MW, Depth: 0.7 mi, Class: Major, Intensity: VIII - XII) earthquake occurred 247.5 miles away from the city center, causing 3 deaths ( 1 shaking deaths, 2 other deaths) and 400 injuries, causing $100,000,000 total damage and $40,000,000 insured lossesOn 5/19/1940 at 04:36:40, a magnitude 7.2 (7.2 UK) earthquake occurred 196.1 miles away from Avondale center, causing $33,000,000 total damage On 10/16/1999 at 09:46:44, a magnitude 7.4 (6.3 MB, 7.4 MS, 7.2 MW, 7.3 ML) earthquake occurred 247.4 miles away from the city center On 12/31/1934 at 18:45:56, a magnitude 7.1 (7.1 UK) earthquake occurred 206.7 miles away from the city center On 10/15/1979 at 23:16:54, a magnitude 7.0 (5.7 MB, 6.9 MS, 7.0 ML, 6.4 MW) earthquake occurred 197.5 miles away from Avondale center On 7/21/1952 at 11:52:14, a magnitude 7.7 (7.7 UK) earthquake occurred 396.9 miles away from the city center, causing $50,000,000 total damage Magnitude types: body-wave magnitude (MB), local magnitude (ML), surface-wave magnitude (MS), moment magnitude (MW) Natural disasters: The number of natural disasters in Maricopa County (16) is near the US average (15).Major Disasters (Presidential) Declared: 11Emergencies Declared: 1Floods: 10, Storms: 9, Fires: 3, Flash Flood: 1, Heavy Rain: 1, Hurricane: 1, Tornado: 1, Wind: 1, Other: 1 (Note: some incidents may be assigned to more than one category). Hospitals and medical centers in Avondale: ESTRELLA CARE AND REHABILITATION CENTER (350 EAST LA CANADA)
AVONDALE DIALYSIS (DSI) (13055 W MCDOWELL RD STE F101)
AVONDALE DIALYSIS (FMC) (10750 W MCDOWELL RD STE E500)
Amtrak stations near Avondale: 14 miles: PHOENIX (401 W. HARRISON ST.) - Bus Station Services: ticket office, enclosed waiting area, public restrooms, public payphones, vending machines, free short-term parking, paid long-term parking, taxi stand.
14 miles: PHOENIX NORTHWEST (PHOENIX, 8101 BLACK CANYON FWY.) - Bus Station Services: public payphones, call for taxi service.
18 miles: PHOENIX AIRPORT (PHOENIX, TERMINAL 2) - Bus Station Services: enclosed waiting area, public restrooms, public payphones, full-service food facilities, paid short-term parking, paid long-term parking, car rental agency, taxi stand, intercity bus service, public transit connection.
Colleges/Universities in Avondale: Estrella Mountain Community College Full-time enrollment: 4,932; Location: 3000 N Dysart Rd; Public; Website: www.emc.maricopa.edu)
Universal Technical Institute of Arizona Inc Full-time enrollment: 3,860; Location: 10695 West Pierce Street; Private, for-profit; Website: www.uti.edu)
Empire Beauty School-Avondale Full-time enrollment: 332; Location: 9945 W McDowell Road #112; Private, for-profit; Website: www.empire.edu)
Southwest Skill Center-Campus of Estrella Mountain Community College Full-time enrollment: 170; Location: 3000 N Dysart Rd; Public; Website: www.estrellamountain.edu/southwest-skill-center)
Other colleges/universities with over 2000 students near Avondale:
Glendale Community College (about 11 miles; Glendale, AZ ; Full-time enrollment: 12,533)
Grand Canyon University (about 12 miles; Phoenix, AZ ; FT enrollment: 44,186)
Phoenix College (about 14 miles; Phoenix, AZ ; FT enrollment: 7,001)
Arizona State University-West (about 14 miles; Glendale, AZ ; FT enrollment: 3,454)
Arizona State University-Downtown Phoenix (about 14 miles; Phoenix, AZ ; FT enrollment: 9,515)
Argosy University-Phoenix Online Division (about 15 miles; Phoenix, AZ ; FT enrollment: 8,840)
Everest College-Phoenix (about 15 miles; Phoenix, AZ ; FT enrollment: 2,008)
Private elementary/middle school in Avondale: ST THOMAS AQUINAS GRADE SCHOOL Students: 313, Location: 13720 W THOMAS RD, Grades: PK-8)
See full list of schools located in Avondale Library in Avondale: SAM GARCIA WESTERN AVENUE LIBRARY Operating income: $544,270; Location: 495 E. WESTERN AVE; 27,023 books ; 916 audio materials ; 834 video materials ; 39 other licensed databases ; 56 print serial subscriptions )
User-submitted facts and corrections:
Collier Elementary School needs to be added to the primary school list.
Notable locations in Avondale: (A) , Avondale Substation (B) , Avondale Water Treatment Plant (C) , Gateway Office Park (D) , Avondale Town Hall (E) , Sam Garcia Western Avenue Library (F) , Avondale Civic Center Library (G) , Avondale Fire Station 173 (H) , Avondale Fire Station 172 (I) , Avondale Fire Station 171 (J) , Avondale Police Department (K) . Display/hide their locations on the map
Churches in Avondale include: (A) , First Southern Baptist Church of Avondale (B) , Faith Harvest Church (C) , Cornerstone Christian Church (D) , Christ Community United Methodist Church (E) , Bethesda Church of God in Christ (F) , Avondale First Baptist Church Garden Lakes (G) , Avondale Apostalic Church Truth Tabernacle (H) , Avandale Christian Assembly Church (I) . Display/hide their locations on the map
Cemeteries: (1) , Goodyear Farms Historic Cemetery (2) . Display/hide their locations on the map
Rivers: (A) , Salt River (B) . Display/hide their locations on the map
Parks in Avondale include: (1) , Cashion Community Park (2) , Avondale City Park (3) , Estrella Mountain Regional Park (4) . Display/hide their locations on the map
Court: (1) . Display/hide its approximate location on the map
Birthplace of: Nick Harris - College football player.
Maricopa County has a predicted average indoor radon screening level between 2 and 4 pCi/L (pico curies per liter) - Moderate Potential Drinking water stations with addresses in Avondale and their reported violations in the past:
AVONDALE CITY OF (Address: 399 E LOWER BUCKEYE RD Population served: 79,335, Groundwater):
Past health violations:
MCL, Average - Between JAN-2006 and MAR-2006, Contaminant: Total Haloacetic Acids (HAA5). Follow-up actions: St Compliance achieved (OCT-26-2006)
MCL, Average - Between OCT-2005 and DEC-2005, Contaminant: Total Haloacetic Acids (HAA5). Follow-up actions: St Compliance achieved (OCT-26-2006)
MCL, Average - Between JUL-2005 and SEP-2005, Contaminant: Total Haloacetic Acids (HAA5). Follow-up actions: St Compliance achieved (OCT-26-2006)
MCL, Average - Between APR-2005 and JUN-2005, Contaminant: Total Haloacetic Acids (HAA5). Follow-up actions: St Compliance achieved (OCT-26-2006)
Past monitoring violations:
Monitoring and Reporting (DBP) - Between OCT-2013 and DEC-2013, Contaminant: Chlorine
Monitoring and Reporting (DBP) - Between APR-2011 and JUN-2011, Contaminant: Total Haloacetic Acids (HAA5). Follow-up actions: St Compliance achieved (MAR-30-2012)
Monitoring, Repeat Major (TCR) - In DEC-2008, Contaminant: Coliform (TCR). Follow-up actions: St Compliance achieved (OCT-14-2009)
Monitoring and Reporting (DBP) - Between JAN-2008 and MAR-2008, Contaminant: TTHM. Follow-up actions: St Compliance achieved (JUN-12-2008)
Monitoring and Reporting (DBP) - Between JAN-2008 and MAR-2008, Contaminant: Total Haloacetic Acids (HAA5). Follow-up actions: St Compliance achieved (JUN-12-2008)
3 minor monitoring violations
85 regular monitoring violations
18 other older monitoring violations
Address: 12725 W INDIAN SCHOOL RD Population served: 34,000, Groundwater):
Past monitoring violations:
Monitoring and Reporting (DBP) - Between JAN-2009 and MAR-2009, Contaminant: TTHM. Follow-up actions: St Violation/Reminder Notice (APR-23-2009), St Compliance achieved (APR-30-2009)
Monitoring and Reporting (DBP) - Between JAN-2009 and MAR-2009, Contaminant: Total Haloacetic Acids (HAA5). Follow-up actions: St Violation/Reminder Notice (APR-23-2009), St Compliance achieved (APR-30-2009)
Monitoring, Repeat Major (TCR) - In DEC-2007, Contaminant: Coliform (TCR). Follow-up actions: St Compliance achieved (AUG-21-2008)
Monitoring and Reporting (DBP) - Between OCT-2007 and DEC-2007, Contaminant: TTHM. Follow-up actions: St Compliance achieved (MAR-19-2008)
Monitoring and Reporting (DBP) - Between OCT-2007 and DEC-2007, Contaminant: Total Haloacetic Acids (HAA5). Follow-up actions: St Compliance achieved (MAR-19-2008)
One routine major monitoring violation
15 minor monitoring violations
87 regular monitoring violations
13 other older monitoring violations
Address: STE D101 Serves TX, Population served: 2,010, Groundwater):
Past monitoring violations:
2 regular monitoring violations
Address: STE D101 Serves TX, Population served: 663, Groundwater):
Past monitoring violations:
2 routine major monitoring violations
23 regular monitoring violations
Address: STE D101 Serves TX, Population served: 555, Groundwater):
Past monitoring violations:
One routine major monitoring violation
Drinking water stations with addresses in Avondale that have no violations reported:
SILVERLEAF SEASIDE RESORT (Serves TX, Population served: 324, Primary Water Source Type: Purch surface water)
Average household size: This city:
3.2 peopleArizona:
2.6 people
Percentage of family households: This city:
77.1%Whole state:
66.2%
Percentage of households with unmarried partners: This city:
10.0%Whole state:
7.8%
Likely homosexual households (counted as self-reported same-sex unmarried-partner households)
Lesbian couples: 0.6% of all households Gay men: 0.4% of all households
People in group quarters in Avondale in 2010:
132 people in nursing facilities/skilled-nursing facilities
14 people in group homes intended for adults
12 people in group homes for juveniles (non-correctional)
2 people in residential treatment centers for juveniles (non-correctional)
people in nursing homes in 2000people in local jails and other confinement facilities (including police lockups) in 2000Banks with branches in Avondale (2011 data):
Bank of America, National Association: 99th Avenue & Mcdowell Branch, Avondale Banking Center Branch, Dysart/Mcdowell Branch. Info updated 2009/11/18: Bank assets: $1,451,969.3 mil, Deposits: $1,077,176.8 mil, headquarters in Charlotte, NC, positive income , 5782 total offices , Holding Company: Bank Of America Corporation
JPMorgan Chase Bank, National Association: Avondale Palmilla Center, 107th Avenue/Indian School Branch, Avondale Westwind Plaza. Info updated 2011/11/10: Bank assets: $1,811,678.0 mil, Deposits: $1,190,738.0 mil, headquarters in Columbus, OH, positive income , International Specialization, 5577 total offices , Holding Company: Jpmorgan Chase & Co.
Wells Fargo Bank, National Association: Avondale & Buckeye Branch at 11425 W. Buckeye Road, branch established on 2004/02/25. Info updated 2011/04/05: Bank assets: $1,161,490.0 mil, Deposits: $905,653.0 mil, headquarters in Sioux Falls, SD, positive income , 6395 total offices , Holding Company: Wells Fargo & Company
Comerica Bank: Avondale-Mcdowell Branch at 10115 W. Mcdowell Road, branch established on 2008/12/29. Info updated 2011/07/29: Bank assets: $60,970.5 mil, Deposits: $48,300.9 mil, headquarters in Dallas, TX, positive income , Commercial Lending Specialization, 497 total offices , Holding Company: Comerica Incorporated
West Valley National Bank: at 12725 West Indian School Road, Suite C-108, branch established on 2006/12/22. Info updated 2007/01/03: Bank assets: $40.6 mil, Deposits: $28.0 mil, local headquarters , negative income in the last year , Commercial Lending Specialization, 3 total offices , Holding Company: West Valley Bancorp, Inc.
For population 15 years and over in Avondale:
Never married: 40.5%Now married: 44.5%Separated: 2.3%Widowed: 3.5%Divorced: 9.2% For population 25 years and over in Avondale:
High school or higher: 88.1%Bachelor's degree or higher: 23.6%Graduate or professional degree: 6.6%Unemployed: 4.3%Mean travel time to work (commute): 25.1 minutes
Education Gini index (Inequality in education) Here:
12.3Arizona average:
12.2
Religion statistics for Avondale, AZ (based on Maricopa County data)
Religion Adherents Congregations Evangelical Protestant 534,453 1,206 Catholic 520,651 100 Other 312,574 680 Mainline Protestant 104,145 241 Orthodox 13,379 24 Black Protestant 6,278 48 None 2,325,637 -
Source: Clifford Grammich, Kirk Hadaway, Richard Houseal, Dale E.Jones, Alexei Krindatch, Richie Stanley and Richard H.Taylor. 2012. 2010 U.S.Religion Census: Religious Congregations & Membership Study. Association of Statisticians of American Religious Bodies. Jones, Dale E., et al. 2002. Congregations and Membership in the United States 2000. Nashville, TN: Glenmary Research Center. Graphs represent county-level data
Food Environment Statistics: Number of grocery stores : 501Maricopa County :
1.30 / 10,000 pop.Arizona :
1.36 / 10,000 pop.
Number of supercenters and club stores : 60This county :
0.16 / 10,000 pop.State :
0.14 / 10,000 pop.
Number of convenience stores (no gas) : 219Maricopa County :
0.57 / 10,000 pop.Arizona :
0.55 / 10,000 pop.
Number of convenience stores (with gas) : 768Maricopa County :
1.99 / 10,000 pop.State :
2.47 / 10,000 pop.
Number of full-service restaurants : 2,264Here :
5.86 / 10,000 pop.State :
6.21 / 10,000 pop.
Adult diabetes rate : This county :
7.7%Arizona :
8.0%
Adult obesity rate : Maricopa County :
22.5%Arizona :
22.8%
Low-income preschool obesity rate : This county :
14.8%State :
14.2%
Health and Nutrition:
Average overall health of teeth and gums : Avondale:
46.7%Arizona:
47.3%
Average BMI : Avondale:
28.7Arizona:
28.5
People feeling badly about themselves : This city:
21.5%Arizona:
20.8%
People not drinking alcohol at all : Avondale:
10.3%State:
10.2%
Average hours sleeping at night : Overweight people : This city:
33.4%Arizona:
33.5%
General health condition : This city:
55.9%Arizona:
56.1%
Average condition of hearing : This city:
81.7%Arizona:
79.4%
More about Health and Nutrition of Avondale, AZ Residents
Local government employment and payroll (March 2022)
Function
Full-time employees
Monthly full-time payroll
Average yearly full-time wage
Part-time employees
Monthly part-time payroll
Police Protection - Officers
143 $1,015,695 $85,233 0 $0 Firefighters
83 $807,816 $116,793 2 $8,835 Police - Other
63 $356,564 $67,917 2 $4,404 Other and Unallocable
43 $327,876 $91,500 0 $0 Financial Administration
30 $203,176 $81,270 0 $0 Solid Waste Management
26 $167,938 $77,510 0 $0 Other Government Administration
26 $244,457 $112,826 9 $8,554 Sewerage
21 $113,755 $65,003 0 $0 Streets and Highways
19 $78,590 $49,636 1 $2,618 Welfare
19 $80,948 $51,125 10 $10,967 Parks and Recreation
17 $110,982 $78,340 24 $23,702 Water Supply
15 $120,397 $96,318 0 $0 Judicial and Legal
14 $89,081 $76,355 0 $0 Correction
11 $62,080 $67,724 0 $0 Health
10 $55,700 $66,840 0 $0 Fire - Other
9 $66,134 $88,179 0 $0 Housing and Community Development (Local)
9 $48,240 $64,320 0 $0 Local Libraries
7 $45,271 $77,607 16 $19,572
Totals for Government
565 $3,994,700 $84,843 64 $78,652
Avondale government finances - Expenditure in 2021 (per resident):
Construction - Parks and Recreation: $14,393,000 ($157.10)
Water Utilities: $6,609,000 ($72.14)Regular Highways: $5,209,000 ($56.86)General - Other: $2,413,000 ($26.34)Sewerage: $1,263,000 ($13.79)Local Fire Protection: $523,000 ($5.71)Public Welfare - Other: $202,000 ($2.20)Police Protection: $172,000 ($1.88)Current Operations - Police Protection: $26,077,000 ($284.63)
Central Staff Services: $19,316,000 ($210.83)Local Fire Protection: $11,422,000 ($124.67)Water Utilities: $9,280,000 ($101.29)General - Other: $7,115,000 ($77.66)Regular Highways: $3,874,000 ($42.28)Solid Waste Management: $3,803,000 ($41.51)Parks and Recreation: $3,531,000 ($38.54)Sewerage: $3,216,000 ($35.10)Judicial and Legal Services: $2,133,000 ($23.28)Financial Administration: $2,106,000 ($22.99)Public Welfare - Other: $2,040,000 ($22.27)Housing and Community Development: $1,531,000 ($16.71)Libraries: $1,359,000 ($14.83)Transit Utilities: $1,350,000 ($14.74)General - Interest on Debt: $1,832,000 ($20.00)
Other Capital Outlay - Sewerage: $2,373,000 ($25.90)
General - Other: $2,016,000 ($22.00)Water Utilities: $1,038,000 ($11.33)Parks and Recreation: $843,000 ($9.20)Local Fire Protection: $643,000 ($7.02)Regular Highways: $298,000 ($3.25)Police Protection: $162,000 ($1.77)Public Welfare - Other: $145,000 ($1.58)Financial Administration: $55,000 ($0.60)Solid Waste Management: $50,000 ($0.55)Total Salaries and Wages: $56,568,000 ($617.44)
Avondale government finances - Revenue in 2021 (per resident):
Charges - Sewerage: $10,928,000 ($119.28)
Solid Waste Management: $5,505,000 ($60.09)Other: $1,567,000 ($17.10)Parks and Recreation: $408,000 ($4.45)Federal Intergovernmental - Housing and Community Development: $775,000 ($8.46)
Other: $28,000 ($0.31)Local Intergovernmental - Other: $1,965,000 ($21.45)
Miscellaneous - Interest Earnings: $2,609,000 ($28.48)
Sale of Property: $870,000 ($9.50)Fines and Forfeits: $798,000 ($8.71)Rents: $786,000 ($8.58)Donations From Private Sources: $343,000 ($3.74)Revenue - Water Utilities: $16,773,000 ($183.08)
State Intergovernmental - General Local Government Support: $24,349,000 ($265.77)
Highways: $6,511,000 ($71.07)Other: $1,153,000 ($12.59)Housing and Community Development: $331,000 ($3.61)Health and Hospitals: $217,000 ($2.37)Tax - General Sales and Gross Receipts: $61,932,000 ($675.99)
Property: $8,472,000 ($92.47)Other License: $4,579,000 ($49.98)Public Utilities Sales: $1,510,000 ($16.48)Other: $431,000 ($4.70)Occupation and Business License - Other: $222,000 ($2.42)Alcoholic Beverage License: $40,000 ($0.44)
Avondale government finances - Debt in 2021 (per resident):
Long Term Debt - Beginning Outstanding - Unspecified Public Purpose: $49,655,000 ($541.98)
Outstanding Unspecified Public Purpose: $41,395,000 ($451.83)Retired Unspecified Public Purpose: $8,260,000 ($90.16)Beginning Outstanding - Public Debt for Private Purpose: $7,460,000 ($81.43)Outstanding Nonguaranteed - Industrial Revenue: $6,650,000 ($72.58)Retired Nonguaranteed - Public Debt for Private Purpose: $810,000 ($8.84)
Avondale government finances - Cash and Securities in 2021 (per resident):
Bond Funds - Cash and Securities: $22,042,000 ($240.59)
Other Funds - Cash and Securities: $254,531,000 ($2778.21)
Sinking Funds - Cash and Securities: $11,678,000 ($127.47)
5.80% of this county's 2021 resident taxpayers lived in other counties in 2020 ($92,013 average adjusted gross income )
Here:
5.80%Arizona average:
6.85%
0.02% of residents moved from foreign countries ($227 average AGI )Maricopa County:
0.02%Arizona average:
0.03%
Top counties from which taxpayers relocated into this county between 2020 and 2021:
5.04% of this county's 2020 resident taxpayers moved to other counties in 2021 ($76,911 average adjusted gross income )
Here:
5.04%Arizona average:
5.72%
0.02% of residents moved to foreign countries ($234 average AGI )Maricopa County:
0.02%Arizona average:
0.03%
Top counties to which taxpayers relocated from this county between 2020 and 2021:
Businesses in Avondale, AZ
Name Count Name Count
Ashley Furniture 1 Kroger 3 AutoZone 1 LA Fitness 1 Baja Fresh Mexican Grill 1 Lane Furniture 2 Bed Bath & Beyond 1 Little Caesars Pizza 1 Blockbuster 2 Long John Silver's 1 Brunswick Bowling & Billiards 1 Marshalls 1 Budget Car Rental 1 Mazda 1 Burger King 2 McDonald's 3 Chevrolet 1 Nike 3 Chick-Fil-A 1 Nissan 1 Chipotle 1 OfficeMax 1 Church's Chicken 1 Old Navy 1 Circle K 6 Panda Express 2 Cold Stone Creamery 1 Payless 1 Costco 1 PetSmart 1 Cricket Wireless 3 Pizza Hut 1 Dairy Queen 1 RadioShack 1 Discount Tire 1 Red Robin 1 Domino's Pizza 2 Ruby Tuesday 1 FedEx 6 SONIC Drive-In 2 GNC 1 Sam's Club 1 GameStop 2 Sprint Nextel 1 H&R Block 2 Staples 1 Hilton 2 Starbucks 3 Hobby Lobby 1 Subway 4 Home Depot 1 T-Mobile 4 Honda 1 Taco Bell 3 IHOP 1 Toyota 1 Jack In The Box 2 U-Haul 1 Jamba Juice 1 UPS 5 Jimmy John's 1 Verizon Wireless 4 Johnny Rockets 1 Village Inn 1 Justice 1 Volkswagen 1 KFC 2 Walmart 1 Kohl's 1 Wendy's 1
Strongest AM radio stations in Avondale:
KPXQ (1360 AM; 50 kW; GLENDALE, AZ; Owner: COMMON GROUND BROADCASTING, INC.)
KMYL (1190 AM; 5 kW; TOLLESON, AZ; Owner: INTERSTATE B/C SYSTEM OF AZ, INC.)
KXEM (1010 AM; 15 kW; TOLLESON, AZ; Owner: JAMES CRYSTAL ENTERPRISES OF PHOENIX, INC.)
KFNX (1100 AM; 50 kW; CAVE CREEK, AZ; Owner: NORTH AMERICAN BROADCASTING CO., INC.)
KMIK (1580 AM; 50 kW; TEMPE, AZ; Owner: ABC, INC.)
KGME (910 AM; 5 kW; PHOENIX, AZ; Owner: AMFM RADIO LICENSES, L.L.C.)
KASA (1540 AM; 10 kW; PHOENIX, AZ; Owner: KASA RADIO HOGAR, INC.)
KMIA (710 AM; 50 kW; BLACK CANYON CITY, AZ; Owner: ENTRAVISION HOLDINGS, LLC)
KFNN (1510 AM; 22 kW; MESA, AZ; Owner: CRC BROADCASTING COMPANY, INC.)
KFYI (550 AM; 5 kW; PHOENIX, AZ; Owner: AMFM RADIO LICENSES, L.L.C.)
KTAR (620 AM; 5 kW; PHOENIX, AZ; Owner: EMMIS RADIO LICENSE CORPORATION)
KPHX (1480 AM; 5 kW; PHOENIX, AZ; Owner: CONTINENTAL BROADCASTING CORP. OF ARIZONA, INC.)
KXEG (1280 AM; 2 kW; PHOENIX, AZ; Owner: MORTENSON BROADCASTING COMPANY OF ARIZONA, LLC)
Strongest FM radio stations in Avondale:
KLNZ (103.5 FM; GLENDALE, AZ; Owner: ENTRAVISION HOLDINGS, LLC)
K220GO (91.9 FM; TEMPE, AZ; Owner: CALVARY CHAPEL OF TWIN FALLS, INC.)
KBAQ (89.5 FM; PHOENIX, AZ; Owner: MARICOPA COUNTY COMMUNITY COLLEGE DISTRICT)
KSLX-FM (100.7 FM; SCOTTSDALE, AZ; Owner: CACTUS RADIO, INC.)
KMLE (107.9 FM; CHANDLER, AZ; Owner: INFINITY RADIO OPERATIONS INC.)
KKLT (98.7 FM; PHOENIX, AZ; Owner: EMMIS RADIO LICENSE CORPORATION)
KZON (101.5 FM; PHOENIX, AZ; Owner: INFINITY RADIO OPERATIONS INC.)
KKFR (92.3 FM; GLENDALE, AZ; Owner: EMMIS RADIO LICENSE CORPORATION)
KESZ (99.9 FM; PHOENIX, AZ; Owner: CLEAR CHANNEL BROADCASTING LICENSES, INC.)
KOOL-FM (94.5 FM; PHOENIX, AZ; Owner: INFINITY RADIO OPERATIONS INC.)
KNIX-FM (102.5 FM; PHOENIX, AZ; Owner: CLEAR CHANNEL BROADCASTING LICENSES, INC.)
KUPD (97.9 FM; TEMPE, AZ; Owner: TEMPE RADIO, INC.)
KJZZ (91.5 FM; PHOENIX, AZ; Owner: MARICOPA COUNTY COMM. COLLEGE DIST.)
KFLR-FM (90.3 FM; PHOENIX, AZ; Owner: FAMILY LIFE BROADCASTING, INC.)
KYOT-FM (95.5 FM; PHOENIX, AZ; Owner: AMFM RADIO LICENSES, L.L.C.)
KMXP (96.9 FM; PHOENIX, AZ; Owner: CITICASTERS LICENSES, L.P.)
KZZP (104.7 FM; MESA, AZ; Owner: CITICASTERS LICENSES, L.P.)
K240CV (95.9 FM; PHOENIX, AZ; Owner: ZORBA RESOURCES, INC.)
KDKB (93.3 FM; MESA, AZ; Owner: MESA RADIO, INC.)
K207CO (89.3 FM; SUN LAKES, AZ; Owner: MARICOPA CNTY COMMUNITY COLLEGE DIST)
TV broadcast stations around Avondale:
KAET (Channel 8; PHOENIX, AZ; Owner: ARIZONA BOARD OF REGENTS)
K43GV (Channel 43; PHOENIX, AZ; Owner: TELEVISION APOGEO DE PHOENIX, LLC)
KPHO-TV (Channel 5; PHOENIX, AZ; Owner: MEREDITH CORPORATION)
KTVK (Channel 3; PHOENIX, AZ; Owner: KTVK, INC.)
KPPX (Channel 51; TOLLESON, AZ; Owner: AMERICA 51, L.P.)
KUTP (Channel 45; PHOENIX, AZ; Owner: FOX TELEVISION STATIONS, INC.)
KPNX (Channel 12; MESA, AZ; Owner: MULTIMEDIA HOLDINGS CORPORATION)
KSAZ-TV (Channel 10; PHOENIX, AZ; Owner: KSAZ LICENSE, INC.)
KASW (Channel 61; PHOENIX, AZ; Owner: KASW-TV, INC.)
K55EH (Channel 55; PHOENIX, AZ; Owner: KAZT, L.L.C.)
KNXV-TV (Channel 15; PHOENIX, AZ; Owner: SCRIPPS HOWARD BROADCASTING COMPANY)
KTVW-TV (Channel 33; PHOENIX, AZ; Owner: KTVW LICENSE PARTNERSHIP, G.P.)
K53GF (Channel 53; PHOENIX, AZ; Owner: SPANISH INDEPENDENT BROADCAST NETWORK, LLC)
KDRX-CA (Channel 48; PHOENIX, AZ; Owner: NBC TELEMUNDO PHOENIX, INC.)
KFPH-CA (Channel 39; PHOENIX, AZ; Owner: TELEFUTURA PARTNERSHIP OF PHOENIX)
KTVP-LP (Channel 64; PHOENIX, AZ; Owner: MAKO COMMUNICATIONS, LLC)
KAZT-CA (Channel 27; PHOENIX, AZ; Owner: KAZT, L.L.C.)
KDTP (Channel 39; PHOENIX, AZ; Owner: COMMUNITY TELEVISION EDUCATORS, INC.)
KPAZ-TV (Channel 21; PHOENIX, AZ; Owner: TRINITY BROADCASTING OF ARIZONA, INC.)
National Bridge Inventory (NBI) Statistics 38 Number of bridges1,335ft / 407m Total length $8,000 Total costs1,547,902 Total average daily traffic133,627 Total average daily truck traffic
New bridges - historical statistics
3 1930-1939 1 1950-1959 7 1960-1969 7 1970-1979 9 1980-1989 4 1990-1999 4 2000-2009 1 2010-2019 2 2020-2022
See full National Bridge Inventory statistics for Avondale, AZ
Home Mortgage Disclosure Act Aggregated Statistics For Year 2009(Based on 4 full and 4 partial tracts) A) FHA, FSA/RHS & VA B) Conventional C) Refinancings D) Home Improvement Loans F) Non-occupant Loans on G) Loans On Manufactured Number Average Value Number Average Value Number Average Value Number Average Value Number Average Value Number Average Value
LOANS ORIGINATED 1,019 $125,014 416 $102,762 611 $165,732 15 $41,605 247 $93,605 2 $91,510 APPLICATIONS APPROVED, NOT ACCEPTED 51 $131,463 35 $113,331 104 $174,755 9 $34,179 17 $92,988 3 $34,973 APPLICATIONS DENIED 178 $131,046 89 $113,878 328 $167,996 31 $29,873 64 $106,887 5 $76,816 APPLICATIONS WITHDRAWN 106 $139,999 52 $103,054 142 $162,412 11 $97,842 38 $98,390 0 $0 FILES CLOSED FOR INCOMPLETENESS 28 $135,325 7 $101,916 44 $169,715 5 $131,692 8 $97,640 0 $0
Aggregated Statistics For Year 2008(Based on 4 full and 4 partial tracts) A) FHA, FSA/RHS & VA B) Conventional C) Refinancings D) Home Improvement Loans F) Non-occupant Loans on G) Loans On Manufactured Number Average Value Number Average Value Number Average Value Number Average Value Number Average Value Number Average Value
LOANS ORIGINATED 771 $172,193 427 $150,184 526 $181,993 50 $69,092 212 $134,201 3 $68,037 APPLICATIONS APPROVED, NOT ACCEPTED 62 $174,601 99 $165,789 148 $187,838 24 $61,684 40 $158,398 3 $57,660 APPLICATIONS DENIED 197 $165,600 188 $159,652 786 $200,982 115 $75,580 124 $159,110 17 $48,341 APPLICATIONS WITHDRAWN 80 $162,014 76 $157,376 190 $208,903 17 $114,833 31 $156,340 2 $128,425 FILES CLOSED FOR INCOMPLETENESS 22 $180,493 21 $200,181 76 $208,801 12 $64,472 12 $130,060 1 $124,000
Aggregated Statistics For Year 2007(Based on 4 full and 4 partial tracts) A) FHA, FSA/RHS & VA B) Conventional C) Refinancings D) Home Improvement Loans E) Loans on Dwellings For 5+ Families F) Non-occupant Loans on G) Loans On Manufactured Number Average Value Number Average Value Number Average Value Number Average Value Number Average Value Number Average Value Number Average Value
LOANS ORIGINATED 130 $216,502 1,309 $193,823 1,517 $190,199 210 $90,822 2 $5,647,780 402 $192,775 13 $121,056 APPLICATIONS APPROVED, NOT ACCEPTED 6 $196,343 292 $185,053 397 $208,292 103 $71,255 0 $0 93 $202,522 4 $122,402 APPLICATIONS DENIED 38 $204,025 561 $185,115 1,568 $214,705 289 $76,362 0 $0 267 $189,732 25 $96,460 APPLICATIONS WITHDRAWN 18 $205,034 276 $174,229 518 $200,942 46 $120,166 2 $7,519,740 78 $197,484 4 $90,948 FILES CLOSED FOR INCOMPLETENESS 3 $229,450 60 $196,262 261 $225,920 22 $127,772 0 $0 27 $214,113 0 $0
Aggregated Statistics For Year 2006(Based on 4 full and 4 partial tracts) A) FHA, FSA/RHS & VA B) Conventional C) Refinancings D) Home Improvement Loans E) Loans on Dwellings For 5+ Families F) Non-occupant Loans on G) Loans On Manufactured Number Average Value Number Average Value Number Average Value Number Average Value Number Average Value Number Average Value Number Average Value
LOANS ORIGINATED 62 $250,557 3,461 $179,247 2,693 $194,510 358 $97,204 2 $4,265,210 948 $181,037 20 $89,142 APPLICATIONS APPROVED, NOT ACCEPTED 4 $219,210 688 $191,352 552 $190,454 113 $80,950 0 $0 181 $183,956 10 $101,936 APPLICATIONS DENIED 12 $249,433 1,083 $176,623 1,383 $206,448 324 $81,131 0 $0 331 $187,913 29 $76,391 APPLICATIONS WITHDRAWN 12 $245,791 682 $167,662 896 $196,732 67 $126,647 0 $0 210 $175,035 4 $103,058 FILES CLOSED FOR INCOMPLETENESS 1 $303,040 148 $173,733 369 $212,680 20 $146,056 0 $0 50 $177,019 1 $88,030
Aggregated Statistics For Year 2005(Based on 4 full and 4 partial tracts) A) FHA, FSA/RHS & VA B) Conventional C) Refinancings D) Home Improvement Loans E) Loans on Dwellings For 5+ Families F) Non-occupant Loans on G) Loans On Manufactured Number Average Value Number Average Value Number Average Value Number Average Value Number Average Value Number Average Value Number Average Value
LOANS ORIGINATED 55 $196,676 4,429 $157,780 3,579 $174,013 338 $103,188 1 $179,820 1,916 $157,404 15 $80,774 APPLICATIONS APPROVED, NOT ACCEPTED 3 $191,103 541 $156,082 447 $161,604 128 $47,795 0 $0 191 $161,843 9 $85,888 APPLICATIONS DENIED 15 $157,145 974 $157,239 1,351 $162,259 395 $65,785 0 $0 331 $167,189 37 $69,546 APPLICATIONS WITHDRAWN 11 $180,636 969 $170,136 940 $167,373 104 $131,736 0 $0 267 $158,824 10 $100,384 FILES CLOSED FOR INCOMPLETENESS 2 $166,650 163 $147,186 488 $174,886 11 $66,439 0 $0 56 $151,784 3 $76,360
Aggregated Statistics For Year 2004(Based on 4 full and 4 partial tracts) A) FHA, FSA/RHS & VA B) Conventional C) Refinancings D) Home Improvement Loans E) Loans on Dwellings For 5+ Families F) Non-occupant Loans on G) Loans On Manufactured Number Average Value Number Average Value Number Average Value Number Average Value Number Average Value Number Average Value Number Average Value
LOANS ORIGINATED 349 $149,980 3,210 $122,774 1,971 $132,072 186 $48,960 2 $2,726,520 1,151 $120,552 27 $62,640 APPLICATIONS APPROVED, NOT ACCEPTED 19 $149,458 420 $120,424 434 $130,870 76 $50,882 0 $0 95 $124,839 16 $70,071 APPLICATIONS DENIED 69 $144,269 536 $118,327 1,135 $127,761 315 $34,814 0 $0 172 $118,285 35 $66,713 APPLICATIONS WITHDRAWN 65 $145,522 445 $126,362 602 $132,064 60 $44,972 0 $0 154 $122,785 7 $86,814 FILES CLOSED FOR INCOMPLETENESS 8 $126,982 54 $121,870 296 $143,252 15 $45,078 0 $0 25 $130,329 2 $103,460
Aggregated Statistics For Year 2003(Based on 4 full and 4 partial tracts) A) FHA, FSA/RHS & VA B) Conventional C) Refinancings D) Home Improvement Loans F) Non-occupant Loans on Number Average Value Number Average Value Number Average Value Number Average Value Number Average Value
LOANS ORIGINATED 634 $139,168 1,641 $125,361 3,226 $124,741 146 $22,613 480 $107,310 APPLICATIONS APPROVED, NOT ACCEPTED 25 $136,579 157 $127,074 519 $123,036 48 $30,907 37 $104,042 APPLICATIONS DENIED 86 $138,844 247 $115,085 1,187 $113,531 220 $28,291 90 $105,421 APPLICATIONS WITHDRAWN 68 $137,445 235 $121,025 911 $125,145 15 $37,607 82 $101,771 FILES CLOSED FOR INCOMPLETENESS 6 $134,538 22 $129,515 117 $131,408 16 $35,874 4 $136,420
Aggregated Statistics For Year 2002(Based on 2 full and 4 partial tracts) A) FHA, FSA/RHS & VA B) Conventional C) Refinancings D) Home Improvement Loans E) Loans on Dwellings For 5+ Families F) Non-occupant Loans on Number Average Value Number Average Value Number Average Value Number Average Value Number Average Value Number Average Value
LOANS ORIGINATED 399 $131,118 602 $116,958 668 $119,904 58 $23,370 1 $600,970 115 $94,574 APPLICATIONS APPROVED, NOT ACCEPTED 22 $123,216 90 $118,986 122 $100,316 30 $25,342 0 $0 14 $73,587 APPLICATIONS DENIED 57 $128,573 120 $97,068 327 $88,096 105 $22,951 0 $0 20 $69,700 APPLICATIONS WITHDRAWN 46 $123,788 78 $112,915 159 $109,165 8 $22,401 0 $0 21 $87,045 FILES CLOSED FOR INCOMPLETENESS 5 $129,716 20 $115,778 41 $114,434 0 $0 0 $0 0 $0
Aggregated Statistics For Year 2001(Based on 2 full and 4 partial tracts) A) FHA, FSA/RHS & VA B) Conventional C) Refinancings D) Home Improvement Loans E) Loans on Dwellings For 5+ Families F) Non-occupant Loans on Number Average Value Number Average Value Number Average Value Number Average Value Number Average Value Number Average Value
LOANS ORIGINATED 325 $125,793 398 $121,219 506 $103,035 42 $21,854 2 $3,435,835 75 $112,443 APPLICATIONS APPROVED, NOT ACCEPTED 20 $128,695 46 $94,220 78 $87,743 22 $24,950 0 $0 7 $55,644 APPLICATIONS DENIED 34 $121,177 121 $77,928 278 $70,481 91 $16,705 0 $0 14 $60,293 APPLICATIONS WITHDRAWN 34 $131,531 53 $112,801 121 $90,379 14 $21,360 0 $0 11 $115,425 FILES CLOSED FOR INCOMPLETENESS 3 $120,733 7 $117,347 22 $116,431 0 $0 0 $0 1 $58,210
Aggregated Statistics For Year 2000(Based on 2 full and 4 partial tracts) A) FHA, FSA/RHS & VA B) Conventional C) Refinancings D) Home Improvement Loans E) Loans on Dwellings For 5+ Families F) Non-occupant Loans on Number Average Value Number Average Value Number Average Value Number Average Value Number Average Value Number Average Value
LOANS ORIGINATED 164 $114,867 231 $109,711 152 $66,222 54 $20,695 1 $2,356,000 23 $85,222 APPLICATIONS APPROVED, NOT ACCEPTED 15 $100,749 48 $68,051 43 $62,257 35 $21,014 0 $0 7 $61,456 APPLICATIONS DENIED 33 $99,117 159 $47,036 158 $49,297 105 $19,125 0 $0 11 $43,890 APPLICATIONS WITHDRAWN 17 $113,728 37 $105,411 57 $73,818 11 $35,855 0 $0 7 $60,573 FILES CLOSED FOR INCOMPLETENESS 5 $111,534 9 $91,403 32 $78,722 3 $16,173 0 $0 0 $0
Aggregated Statistics For Year 1999(Based on 2 full and 6 partial tracts) A) FHA, FSA/RHS & VA B) Conventional C) Refinancings D) Home Improvement Loans E) Loans on Dwellings For 5+ Families F) Non-occupant Loans on Number Average Value Number Average Value Number Average Value Number Average Value Number Average Value Number Average Value
LOANS ORIGINATED 665 $105,624 634 $99,994 516 $76,240 190 $21,912 5 $266,212 49 $75,502 APPLICATIONS APPROVED, NOT ACCEPTED 41 $108,274 103 $81,295 134 $73,682 99 $21,149 0 $0 11 $69,399 APPLICATIONS DENIED 109 $111,382 307 $67,514 413 $61,708 282 $19,459 0 $0 23 $45,010 APPLICATIONS WITHDRAWN 73 $109,345 119 $104,786 182 $71,781 27 $31,841 0 $0 5 $106,208 FILES CLOSED FOR INCOMPLETENESS 15 $98,674 17 $103,069 82 $80,156 6 $27,032 0 $0 5 $75,434
Detailed HMDA statistics for the following Tracts:
0610.02
, 0610.03 , 0612.00 , 0614.00 , 0820.13 , 0820.14 , 0822.01 , 0822.02
Private Mortgage Insurance Companies Aggregated Statistics For Year 2009(Based on 4 full and 4 partial tracts) A) Conventional B) Refinancings C) Non-occupant Loans on Number Average Value Number Average Value Number Average Value
LOANS ORIGINATED 46 $134,593 6 $131,538 5 $136,234 APPLICATIONS APPROVED, NOT ACCEPTED 18 $165,954 8 $235,965 1 $207,450 APPLICATIONS DENIED 7 $133,569 1 $151,490 0 $0 APPLICATIONS WITHDRAWN 3 $91,033 1 $175,890 0 $0 FILES CLOSED FOR INCOMPLETENESS 1 $215,730 0 $0 0 $0
Aggregated Statistics For Year 2008(Based on 4 full and 4 partial tracts) A) Conventional B) Refinancings C) Non-occupant Loans on Number Average Value Number Average Value Number Average Value
LOANS ORIGINATED 203 $192,403 74 $226,183 35 $165,205 APPLICATIONS APPROVED, NOT ACCEPTED 125 $216,980 71 $241,635 20 $208,078 APPLICATIONS DENIED 28 $200,881 9 $207,456 7 $209,137 APPLICATIONS WITHDRAWN 8 $201,140 4 $232,562 0 $0 FILES CLOSED FOR INCOMPLETENESS 14 $193,541 5 $282,092 7 $238,761
Aggregated Statistics For Year 2007(Based on 4 full and 4 partial tracts) A) Conventional B) Refinancings C) Non-occupant Loans on Number Average Value Number Average Value Number Average Value
LOANS ORIGINATED 451 $237,230 149 $255,257 58 $253,799 APPLICATIONS APPROVED, NOT ACCEPTED 74 $248,503 58 $264,532 22 $235,496 APPLICATIONS DENIED 16 $212,229 6 $235,113 3 $269,600 APPLICATIONS WITHDRAWN 42 $249,495 30 $263,659 13 $285,367 FILES CLOSED FOR INCOMPLETENESS 2 $257,235 1 $332,120 1 $332,120
Aggregated Statistics For Year 2006(Based on 4 full and 4 partial tracts) A) Conventional B) Refinancings C) Non-occupant Loans on D) Loans On Manufactured Number Average Value Number Average Value Number Average Value Number Average Value
LOANS ORIGINATED 242 $253,439 99 $257,765 62 $252,592 2 $197,520 APPLICATIONS APPROVED, NOT ACCEPTED 71 $259,750 23 $266,106 26 $264,990 1 $102,440 APPLICATIONS DENIED 7 $286,821 5 $321,958 4 $252,815 0 $0 APPLICATIONS WITHDRAWN 21 $252,943 10 $280,841 5 $312,986 0 $0 FILES CLOSED FOR INCOMPLETENESS 2 $374,560 1 $191,500 3 $279,890 0 $0
Aggregated Statistics For Year 2005(Based on 4 full and 4 partial tracts) A) Conventional B) Refinancings C) Non-occupant Loans on D) Loans On Manufactured Number Average Value Number Average Value Number Average Value Number Average Value
LOANS ORIGINATED 447 $212,129 144 $196,244 168 $198,409 4 $90,175 APPLICATIONS APPROVED, NOT ACCEPTED 129 $211,995 47 $188,538 32 $192,577 1 $104,680 APPLICATIONS DENIED 4 $215,120 6 $264,122 2 $262,110 0 $0 APPLICATIONS WITHDRAWN 36 $213,938 13 $207,752 9 $208,480 1 $167,380 FILES CLOSED FOR INCOMPLETENESS 5 $191,164 2 $153,295 2 $272,665 0 $0
Aggregated Statistics For Year 2004(Based on 4 full and 4 partial tracts) A) Conventional B) Refinancings C) Non-occupant Loans on D) Loans On Manufactured Number Average Value Number Average Value Number Average Value Number Average Value
LOANS ORIGINATED 522 $156,502 239 $158,174 184 $143,217 1 $98,610 APPLICATIONS APPROVED, NOT ACCEPTED 128 $164,426 77 $150,785 42 $139,625 1 $72,460 APPLICATIONS DENIED 21 $175,591 2 $145,145 11 $179,911 0 $0 APPLICATIONS WITHDRAWN 41 $168,256 9 $136,834 12 $171,105 0 $0 FILES CLOSED FOR INCOMPLETENESS 5 $161,914 5 $148,474 1 $137,530 0 $0
Aggregated Statistics For Year 2003(Based on 4 full and 4 partial tracts) A) Conventional B) Refinancings C) Non-occupant Loans on Number Average Value Number Average Value Number Average Value
LOANS ORIGINATED 586 $150,650 578 $145,079 140 $133,881 APPLICATIONS APPROVED, NOT ACCEPTED 93 $147,100 114 $148,325 14 $129,904 APPLICATIONS DENIED 14 $148,228 10 $174,530 5 $146,010 APPLICATIONS WITHDRAWN 27 $156,129 32 $144,615 4 $118,080 FILES CLOSED FOR INCOMPLETENESS 0 $0 2 $128,395 0 $0
Aggregated Statistics For Year 2002(Based on 2 full and 4 partial tracts) A) Conventional B) Refinancings C) Non-occupant Loans on Number Average Value Number Average Value Number Average Value
LOANS ORIGINATED 258 $142,359 116 $146,138 33 $113,947 APPLICATIONS APPROVED, NOT ACCEPTED 34 $152,320 17 $153,956 5 $134,808 APPLICATIONS DENIED 5 $155,208 6 $114,572 1 $129,840 APPLICATIONS WITHDRAWN 23 $161,442 6 $125,402 4 $161,598 FILES CLOSED FOR INCOMPLETENESS 1 $125,690 1 $166,500 0 $0
Aggregated Statistics For Year 2001(Based on 2 full and 4 partial tracts) A) Conventional B) Refinancings C) Non-occupant Loans on Number Average Value Number Average Value Number Average Value
LOANS ORIGINATED 230 $146,082 71 $135,928 16 $117,082 APPLICATIONS APPROVED, NOT ACCEPTED 30 $150,479 15 $133,983 4 $98,282 APPLICATIONS DENIED 4 $148,090 4 $118,070 1 $75,000 APPLICATIONS WITHDRAWN 5 $129,294 3 $168,737 1 $228,940 FILES CLOSED FOR INCOMPLETENESS 1 $231,870 0 $0 0 $0
Aggregated Statistics For Year 2000(Based on 2 full and 4 partial tracts) A) Conventional B) Refinancings C) Non-occupant Loans on Number Average Value Number Average Value Number Average Value
LOANS ORIGINATED 65 $119,008 11 $110,879 7 $90,697 APPLICATIONS APPROVED, NOT ACCEPTED 12 $93,273 3 $114,060 1 $78,050 APPLICATIONS DENIED 5 $137,086 0 $0 0 $0 APPLICATIONS WITHDRAWN 2 $147,720 1 $59,560 0 $0 FILES CLOSED FOR INCOMPLETENESS 0 $0 0 $0 0 $0
Aggregated Statistics For Year 1999(Based on 2 full and 6 partial tracts) A) Conventional B) Refinancings C) Non-occupant Loans on Number Average Value Number Average Value Number Average Value
LOANS ORIGINATED 415 $121,717 78 $115,074 13 $103,026 APPLICATIONS APPROVED, NOT ACCEPTED 38 $121,971 22 $108,499 1 $142,980 APPLICATIONS DENIED 31 $127,527 5 $116,796 4 $68,018 APPLICATIONS WITHDRAWN 16 $129,766 4 $136,648 0 $0 FILES CLOSED FOR INCOMPLETENESS 8 $113,472 1 $154,610 0 $0
Detailed PMIC statistics for the following Tracts:
0610.02
, 0610.03 , 0612.00 , 0614.00 , 0820.13 , 0820.14 , 0822.01 , 0822.02 Fire-safe hotels and motels in Avondale, Arizona:
Hilton Garden Inn Phoenix-Avondale, 11460 W Hilton Way, Avondale, Arizona 85323 Phone: (623) 882-3351
Homewood Suites Phoenix Avondale, 11450 W Hilton Way, Avondale, Arizona 85323 Phone: (623) 882-3315, Fax: (623) 882-0664
All 2 fire-safe hotels and motels in Avondale, Arizona
Most common first names in Avondale, AZ among deceased individuals Name Count Lived (average)
James 55 69.8 years Mary 48 76.5 years William 45 71.2 years John 44 70.0 years Robert 37 67.1 years Maria 35 73.6 years Charles 30 76.4 years Jose 28 70.1 years George 27 72.4 years Frank 25 73.3 years
Most common last names in Avondale, AZ among deceased individuals Last name Count Lived (average)
Johnson 32 71.2 years Garcia 24 78.0 years Hernandez 23 73.5 years Lopez 21 70.6 years Brown 19 70.7 years Smith 19 70.8 years Gonzales 19 71.5 years Rodriguez 16 65.6 years Martinez 16 75.8 years Williams 15 66.7 years
Avondale compared to Arizona state average:
Unemployed percentage significantly below state average. Black race population percentage significantly above state average. Hispanic race population percentage significantly above state average. Median age below state average. Foreign-born population percentage significantly above state average. House age below state average. Number of college students above state average.
#4 on the list of "Top 101 cities with the highest number of days clear of clouds (population 50,000+)"
#4 on the list of "Top 101 cities with the lowest number of days clear of clouds (population 50,000+)"
#6 on the list of "Top 101 cities with the highest average sunshine amount (population 50,000+)"
#7 on the list of "Top 101 cities with the hottest summers (population 50,000+)"
#10 on the list of "Top 101 cities with the highest daily high temperatures (population 50,000+)"
#11 on the list of "Top 101 cities with the lowest minimum monthly morning or afternoon humidity (population 50,000+)"
#12 on the list of "Top 101 cities with the lowest average humidity (population 50,000+)"
#17 on the list of "Top 101 cities with the largest percentage population increase from 2000 (population 50,000+)"
#23 on the list of "Top 100 cities with newest houses (pop. 50,000+)"
#24 on the list of "Top 101 cities with largest percentage population increases in the 1990s) (population 50,000+)"
#24 on the list of "Top 101 cities with the lowest maximum monthly morning or afternoon humidity (population 50,000+)"
#27 on the list of "Top 101 cities with the largest percentage of unmarried partner households (population 50,000+)"
#27 on the list of "Top 101 cities with largest percentage of males in occupations: material moving occupations (population 50,000+)"
#28 on the list of "Top 101 cities with the smallest percentage of elementary and middle school students in private schools (5,000+ students)"
#29 on the list of "Top 100 fastest growing cities from 2000 to 2014 (pop. 50,000+)"
#29 on the list of "Top 101 cities with largest percentage of females in occupations: transportation occupations (population 50,000+)"
#31 on the list of "Top 101 cities with largest percentage of males in occupations: fire fighting and prevention workers including supervisors (population 50,000+)"
#32 on the list of "Top 101 cities with largest percentage of females in industries: transportation and warehousing (population 50,000+)"
#33 on the list of "Top 101 cities that people commute from (largest negative percentage daily daytime population change due to commuting) (population 50,000+)"
#33 on the list of "Top 101 cities with the lowest average yearly precipitation (population 50,000+)"
#2 on the list of "Top 101 counties with the highest Nitrogen Dioxide air pollution readings in 2012 (ppm)"
#3 on the list of "Top 101 counties with the highest total withdrawal of fresh water for public supply"
#3 on the list of "Top 101 counties with the highest surface withdrawal of fresh water for public supply"
#4 on the list of "Top 101 counties with the most Other congregations"
#5 on the list of "Top 101 counties with the most Evangelical Protestant adherents (pop. 50,000+)"
Top Patent Applicants
Brian Hann (7)
Paul Banta (5)
Pablo Bandera (4)
Chad Borges (4)
Jie Wu (3)
Steve Irwin (3)
Russell T. Mackler (3)
Warren A. Weems, Ii (2)
Andrew R. Ramos (2)
Sean Caufield (2)
Total of 79 patent applications in 2008-2024.


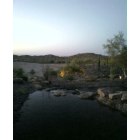
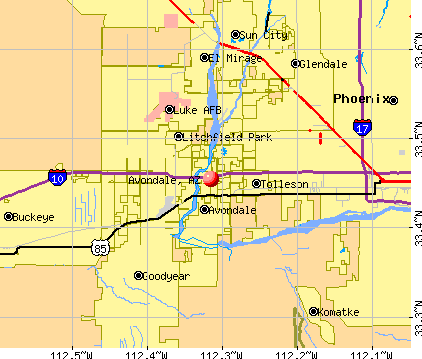


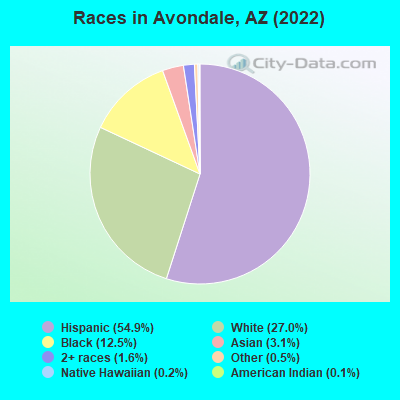
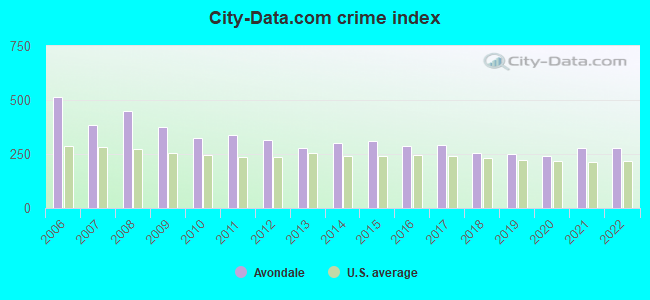
 Recent articles from our blog. Our writers, many of them Ph.D. graduates or candidates, create easy-to-read articles on a wide variety of topics.

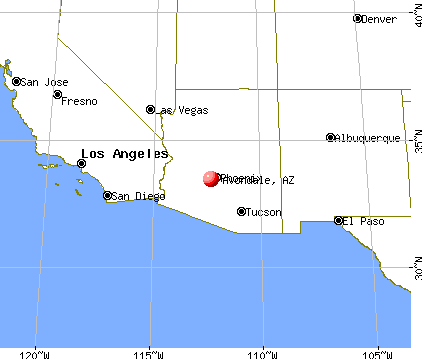
 (11.0 miles
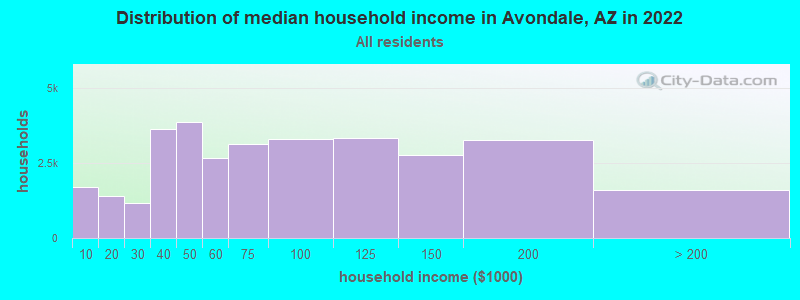
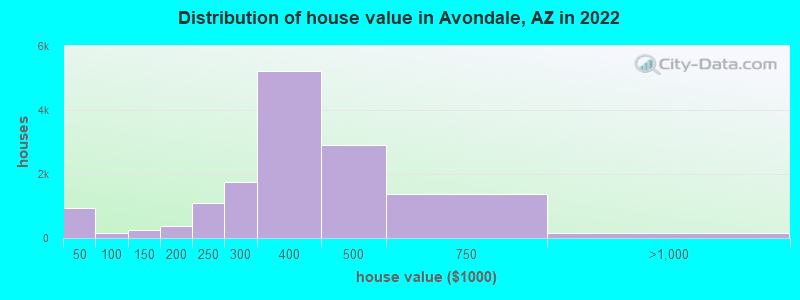
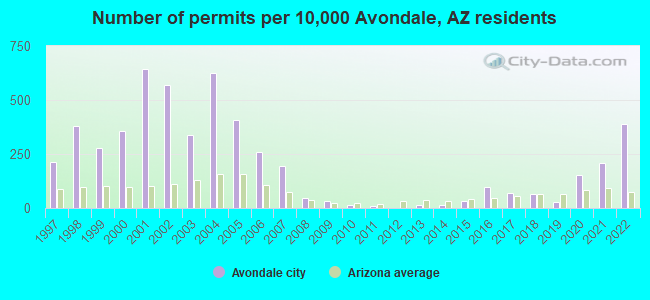
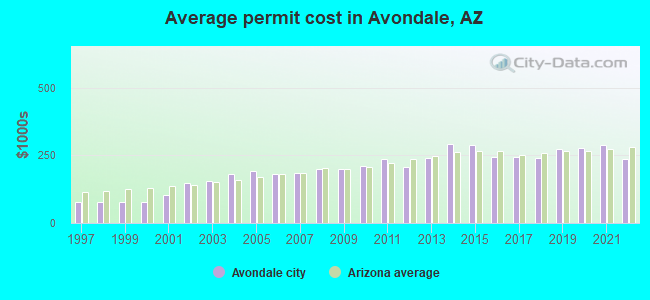
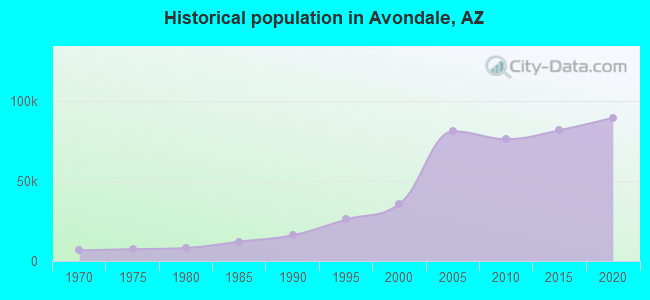
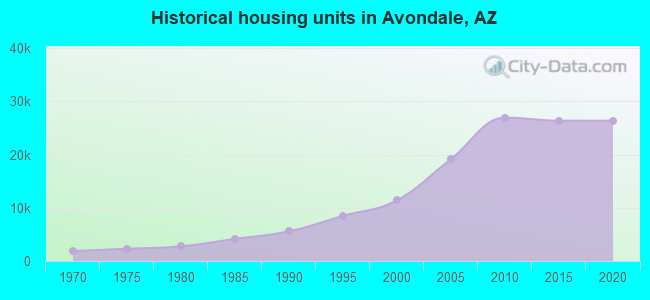
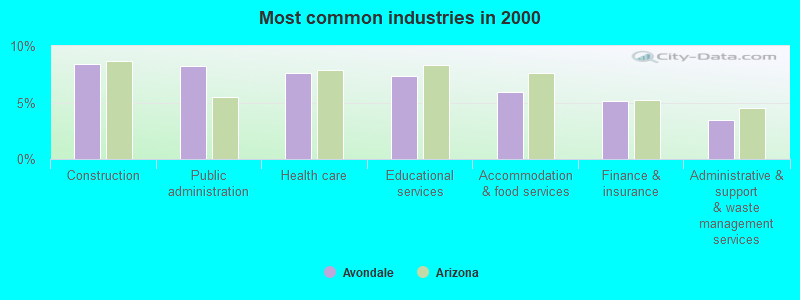
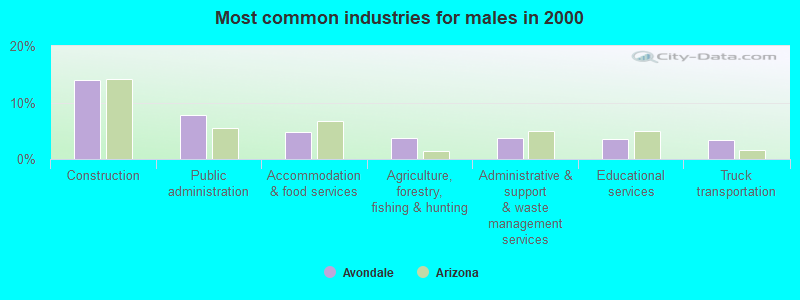
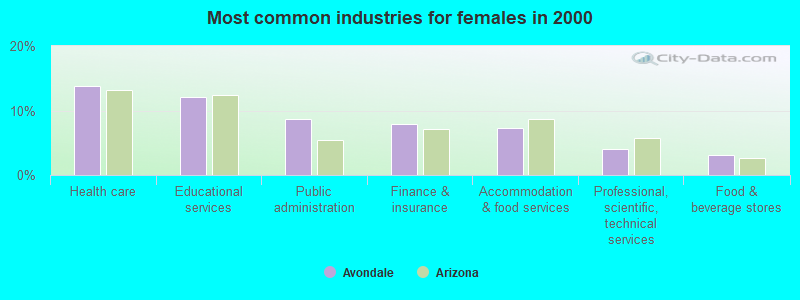
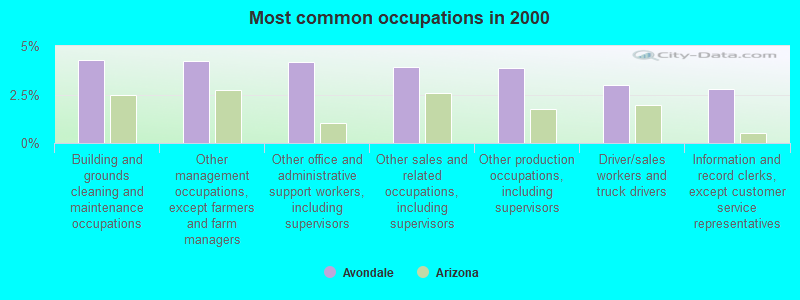
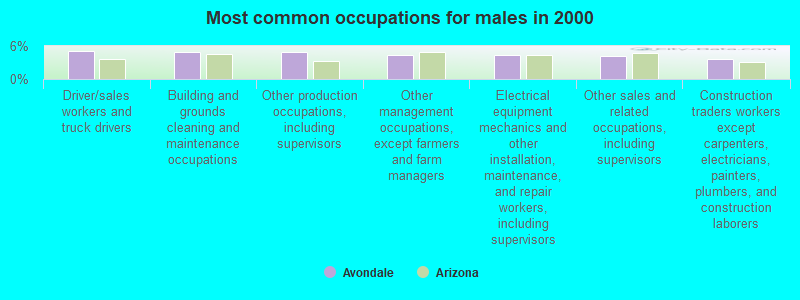
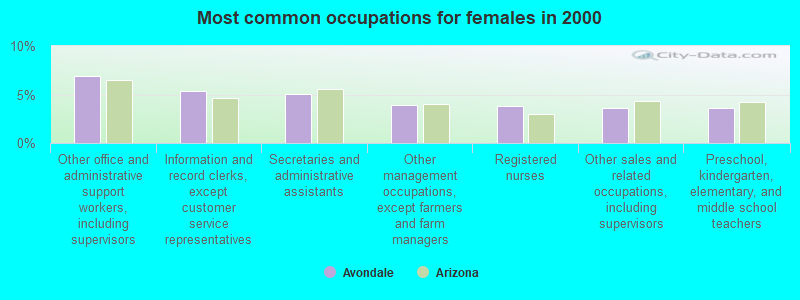

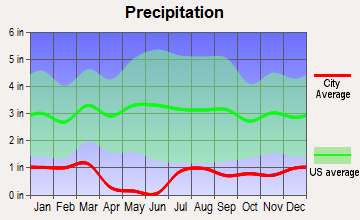
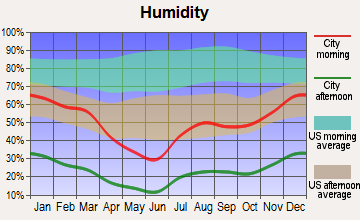
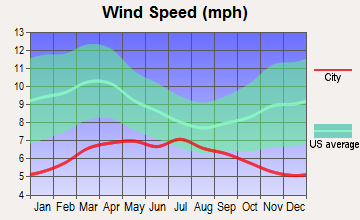
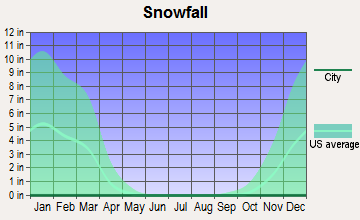
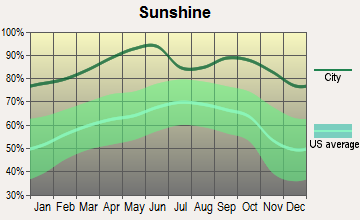
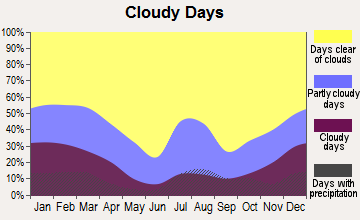
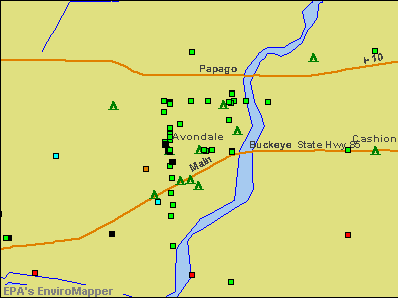

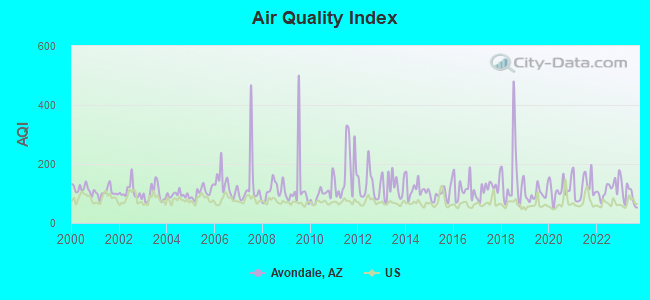
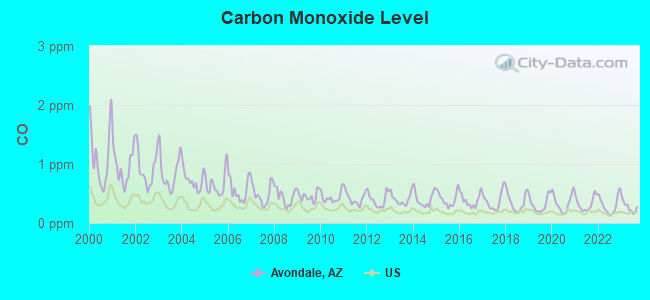
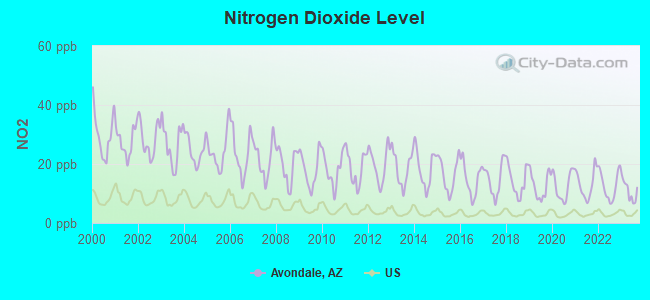

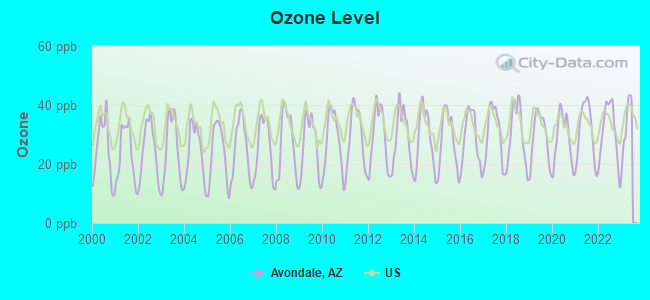
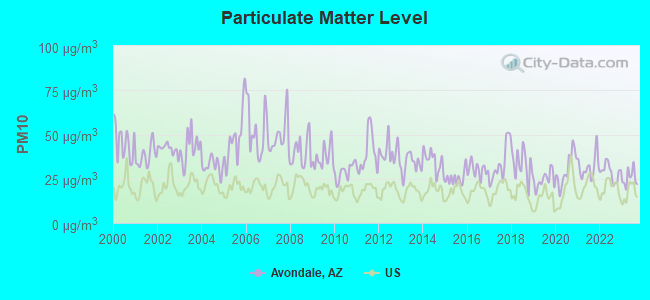
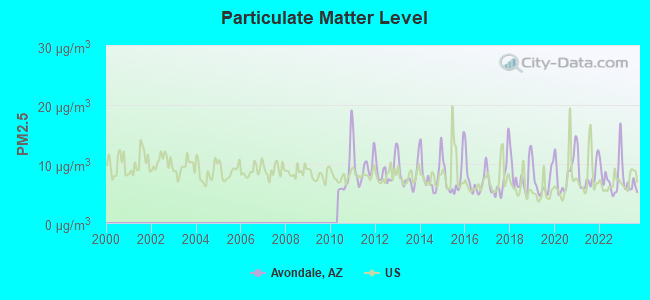
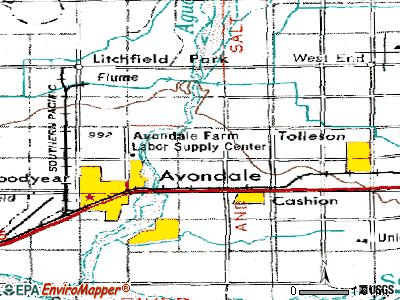

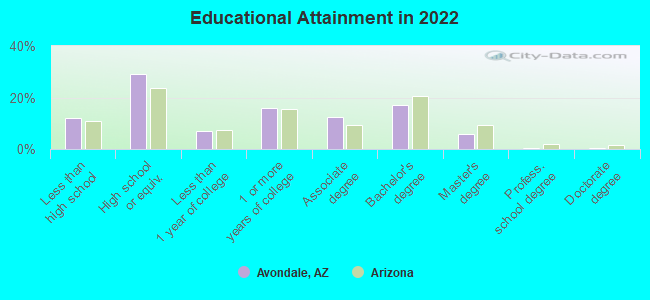

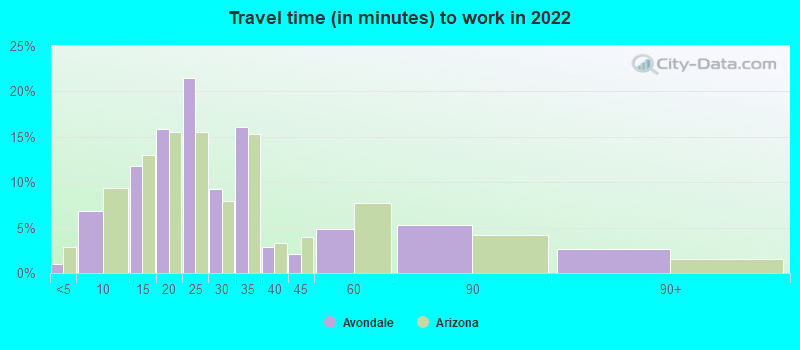
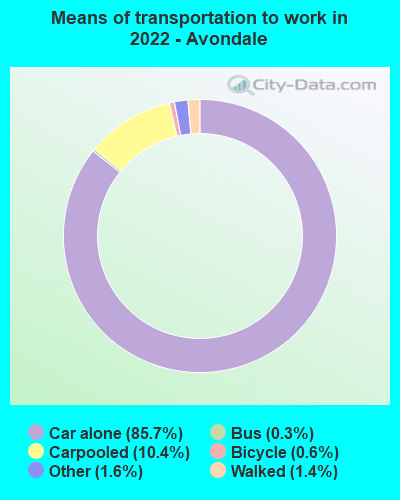
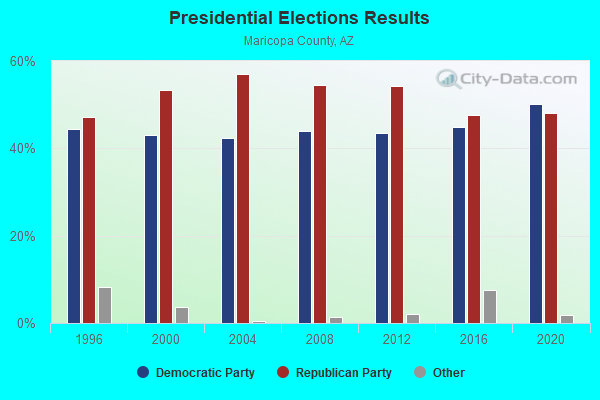
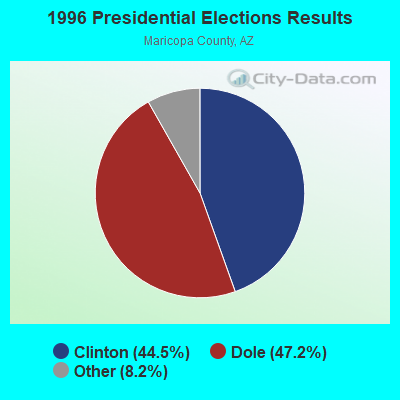
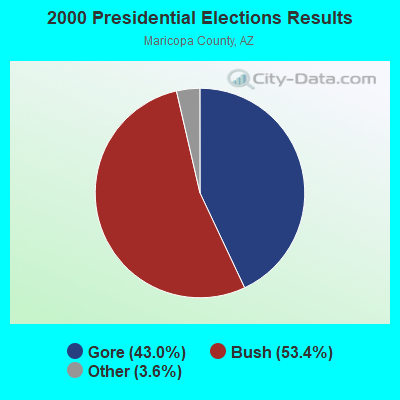
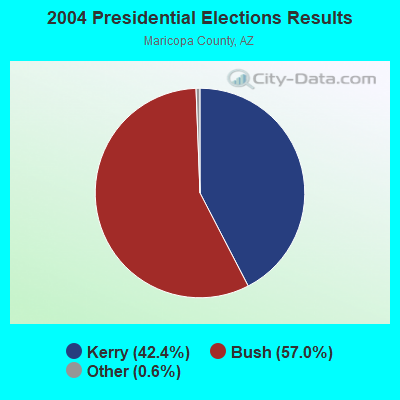
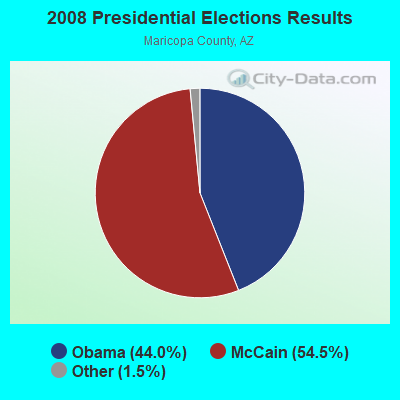
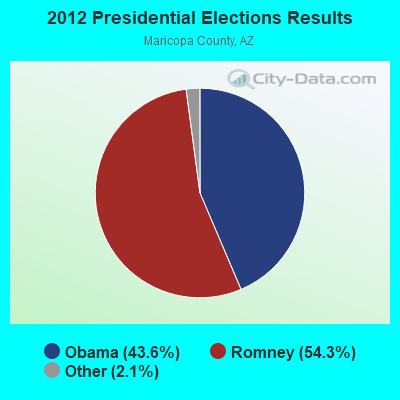
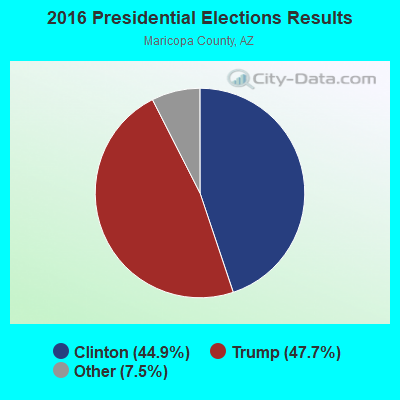
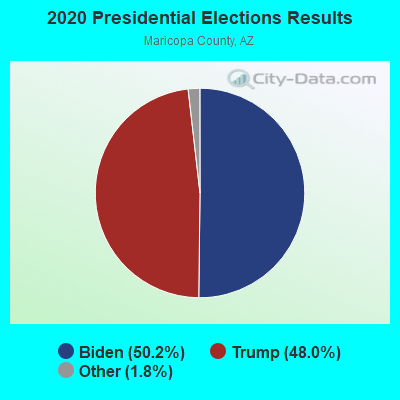
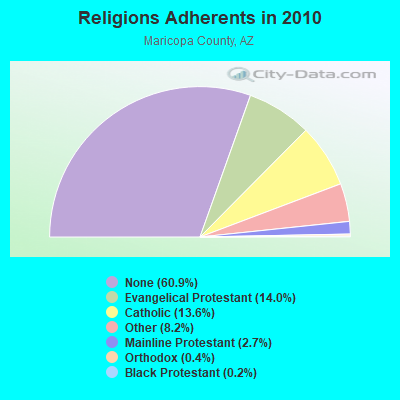
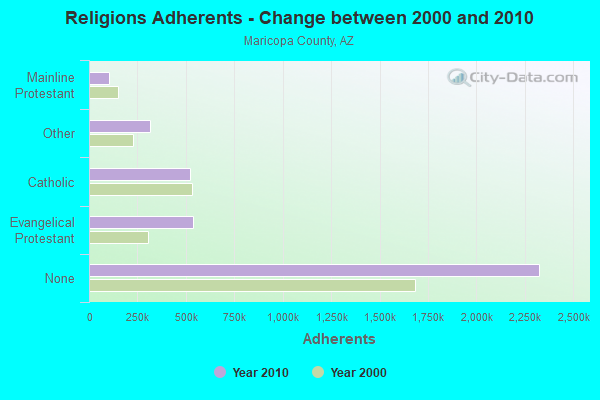
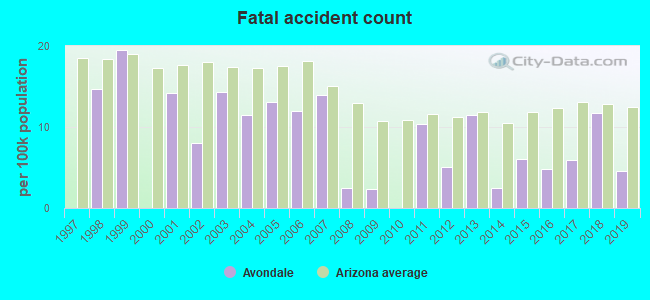
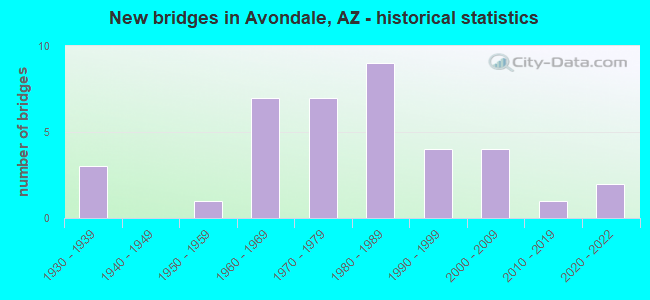
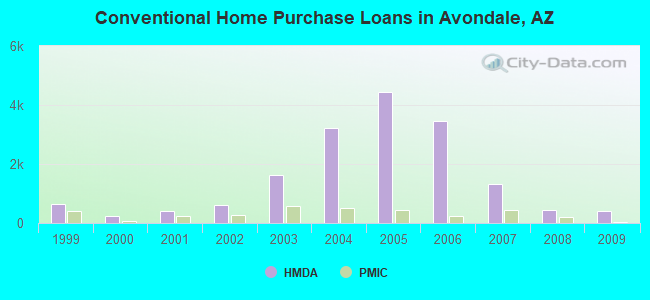
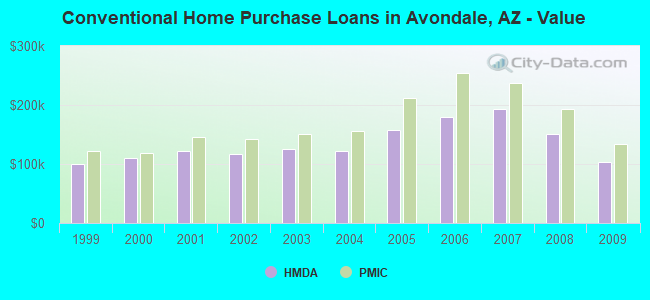
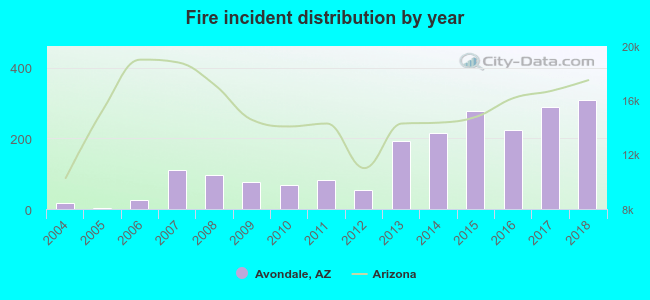 Based on the data from the years 2004 - 2018 the average number of fire incidents per year is 136. The highest number of reported fires - 308 took place in 2018, and the least - 3 in 2005. The data has a rising trend.
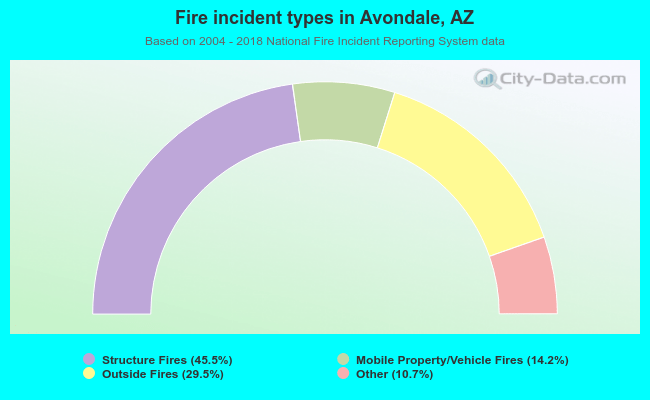 When looking into fire subcategories, the most incidents belonged to: Structure Fires (45.5%), and Outside Fires (29.5%).