Estimated zip code population in 2022: 46,468 Zip code population in 2010: 39,507 Zip code population in 2000: 32,769
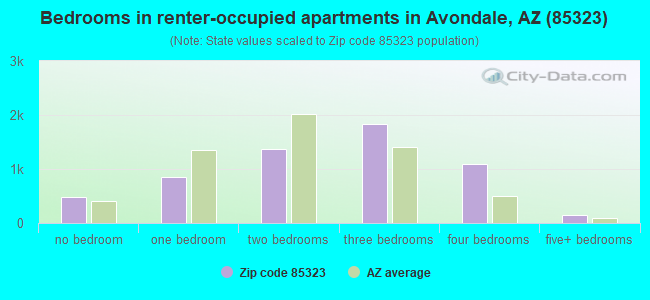
Houses and condos: 14,950 Renter-occupied apartments: 5,726
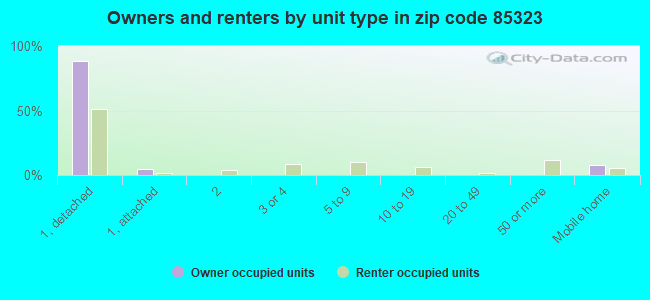
% of renters here:
40%
State:
33%
March 2022 cost of living index in zip code 85323: 100.1 (near average, U.S. average is 100)
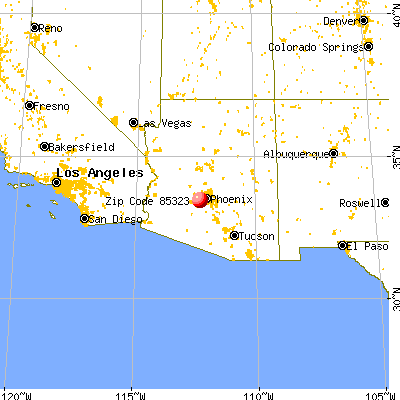
Land area: 18.6 sq. mi. Water area: 0.0 sq. mi.
Population density: 2,500 people per square mile
(average).
OSM Map
General Map
Google Map
MSN Map
OSM Map
General Map
Google Map
MSN Map
OSM Map
General Map
Google Map
MSN Map
OSM Map
General Map
Google Map
MSN Map
Please wait while loading the map...
Real estate property taxes paid for housing units in 2022:
This zip code:
0.4% ($1,565)
Arizona:
0.4% ($1,786)
Median real estate property taxes paid for housing units with mortgages in 2022: $1,656 (0.4%) Median real estate property taxes paid for housing units with no mortgage in 2022: $1,192 (0.4%)
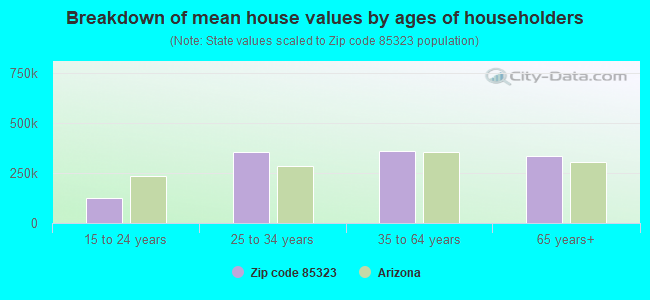
Estimated median house/condo value in 2022: $360,064
85323:
$360,064
Arizona:
$402,800
According to our research of Arizona and other state lists, there were 45 registered sex offenders living in 85323 zip code as of April 27, 2024. The ratio of all residents to sex offenders in zip code 85323 is 918 to 1. The ratio of registered sex offenders to all residents in this zip code is lower than the state average.
Median resident age:
This zip code:
30.9 years
Arizona median age:
38.8 years
Average household size:
This zip code:
3.2 people
Arizona:
2.5 people
Averages for the 2020 tax year for zip code 85323, filed in 2021:
Average Adjusted Gross Income (AGI) in 2020: $44,621 (Individual Income Tax Returns)
Here:
$44,621
State:
$73,499
Salary/wage: $42,836 (reported on 90.5% of returns)
Here:
$42,836
State:
$59,499
(% of AGI for various income ranges: 1290.5% for AGIs below $25k, 4042.3% for AGIs $25k-50k, 7578.6% for AGIs $50k-75k, 11277.4% for AGIs $75k-100k, 19767.9% for AGIs $100k-200k, 66226.7% for AGIs over 200k)
Taxable interest for individuals: $561 (reported on 8.1% of returns)
This zip code:
$561
Arizona:
$2,325
(% of AGI for various income ranges: 2.0% for AGIs below $25k, 2.2% for AGIs $25k-50k, 4.3% for AGIs $50k-75k, 4.8% for AGIs $75k-100k, 58.2% for AGIs $100k-200k, 233.3% for AGIs over 200k)
Ordinary dividends: $1,618 (reported on 3.6% of returns)
Here:
$1,618
State:
$8,711
(% of AGI for various income ranges: 1.9% for AGIs below $25k, 1.9% for AGIs $25k-50k, 8.3% for AGIs $50k-75k, 8.9% for AGIs $75k-100k, 70.1% for AGIs $100k-200k, 350.0% for AGIs over 200k)
Net capital gain/loss in AGI: +$9,524 (reported on 4.4% of returns)
Here:
+$9,524
State:
+$31,332
(% of AGI for various income ranges: 1.5% for AGIs below $25k, 6.3% for AGIs $25k-50k, 26.1% for AGIs $50k-75k, 34.2% for AGIs $75k-100k, 252.6% for AGIs $100k-200k, 17180.0% for AGIs over 200k)
Profit/loss from business: +$7,472 (reported on 14.9% of returns)
Here:
+$7,472
State:
+$13,214
(% of AGI for various income ranges: 126.7% for AGIs below $25k, 93.2% for AGIs $25k-50k, 170.0% for AGIs $50k-75k, 152.1% for AGIs $75k-100k, 543.5% for AGIs $100k-200k)
Taxable individual retirement arrangement distribution: $12,900 (reported on 1.9% of returns)
85323:
$12,900
Arizona:
$23,364
(% of AGI for various income ranges: 9.6% for AGIs below $25k, 18.8% for AGIs $25k-50k, 37.4% for AGIs $50k-75k, 53.4% for AGIs $75k-100k, 230.5% for AGIs $100k-200k)
Total itemized deductions: $27,232 (reported on 3.8% of returns)
Here:
$27,232
State:
$36,308
(% of AGI for various income ranges: 18.3% for AGIs below $25k, 59.4% for AGIs $25k-50k, 192.3% for AGIs $50k-75k, 355.4% for AGIs $75k-100k, 771.8% for AGIs $100k-200k, 6360.0% for AGIs over 200k)
Charity contributions: $5,905 (reported on 2.9% of returns)
Here:
$5,905
State:
$11,955
(% of AGI for various income ranges: 1.7% for AGIs below $25k, 6.7% for AGIs $25k-50k, 28.0% for AGIs $50k-75k, 55.9% for AGIs $75k-100k, 152.9% for AGIs $100k-200k, 1690.0% for AGIs over 200k)
Taxes paid: $4,851 (reported on 3.8% of returns)
85323:
$4,851
State:
$6,820
(% of AGI for various income ranges: 2.3% for AGIs below $25k, 8.6% for AGIs $25k-50k, 38.1% for AGIs $50k-75k, 66.8% for AGIs $75k-100k, 147.6% for AGIs $100k-200k, 980.0% for AGIs over 200k)
Earned income credit: $2,658 (reported on 26.5% of returns)
Here:
$2,658
State:
$2,383
(% of AGI for various income ranges: 143.4% for AGIs below $25k, 107.2% for AGIs $25k-50k, 2.5% for AGIs $50k-75k)
Percentage of individuals using paid preparers for their 2020 taxes: 93.6%
Here:
94%
State:
93%
(% for various income ranges: 93.0% for AGIs below $25k, 94.5% for AGIs $25k-50k, 92.9% for AGIs $50k-75k, 94.0% for AGIs $75k-100k, 93.6% for AGIs $100k-200k, 90.9% for AGIs over 200k)
Averages for the 2012 tax year for zip code 85323, filed in 2013:
Average Adjusted Gross Income (AGI) in 2012: $35,703 (Individual Income Tax Returns)
Here:
$35,703
State:
$57,644
Salary/wage: $34,572 (reported on 92.2% of returns)
Here:
$34,572
State:
$47,932
(% of AGI for various income ranges: 85.4% for AGIs below $25k, 93.5% for AGIs $25k-50k, 91.0% for AGIs $50k-75k, 89.0% for AGIs $75k-100k, 87.4% for AGIs $100k-200k, 52.5% for AGIs over 200k)
Taxable interest for individuals: $355 (reported on 10.3% of returns)
This zip code:
$355
Arizona:
$2,064
(% of AGI for various income ranges: 0.2% for AGIs below $25k, 0.2% for AGIs $75k-100k, 0.1% for AGIs over 200k)
Ordinary dividends: $1,329 (reported on 4.2% of returns)
Here:
$1,329
State:
$7,268
(% of AGI for various income ranges: 0.2% for AGIs below $25k, 0.2% for AGIs $50k-75k, 0.1% for AGIs $75k-100k, 0.4% for AGIs $100k-200k, 0.4% for AGIs over 200k)
Net capital gain/loss in AGI: +$3,219 (reported on 3.5% of returns)
Here:
+$3,219
State:
+$15,530
(% of AGI for various income ranges: 2.5% for AGIs $100k-200k)
Profit/loss from business: +$7,306 (reported on 12.8% of returns)
Here:
+$7,306
State:
+$12,323
(% of AGI for various income ranges: 8.3% for AGIs below $25k, 1.6% for AGIs $25k-50k, 1.3% for AGIs $50k-75k, 1.0% for AGIs $75k-100k, 1.7% for AGIs $100k-200k)
Taxable individual retirement arrangement distribution: $11,829 (reported on 2.7% of returns)
85323:
$11,829
Arizona:
$18,280
(% of AGI for various income ranges: 0.5% for AGIs below $25k, 0.6% for AGIs $25k-50k, 0.8% for AGIs $50k-75k, 1.4% for AGIs $75k-100k, 2.0% for AGIs $100k-200k)
Total itemized deductions: $16,832 (26% of AGI, reported on 19.1% of returns)
Here:
$16,832
State:
$23,651
Here:
25.6% of AGI
State:
20.6% of AGI
(% of AGI for various income ranges: 4.0% for AGIs below $25k, 7.7% for AGIs $25k-50k, 10.4% for AGIs $50k-75k, 11.4% for AGIs $75k-100k, 13.7% for AGIs $100k-200k, 13.6% for AGIs over 200k)
Charity contributions: $2,354 (reported on 14.2% of returns)
Here:
$2,354
State:
$4,114
(% of AGI for various income ranges: 0.3% for AGIs below $25k, 0.7% for AGIs $25k-50k, 1.0% for AGIs $50k-75k, 1.4% for AGIs $75k-100k, 1.8% for AGIs $100k-200k, 1.5% for AGIs over 200k)
Taxes paid: $3,739 (reported on 19.1% of returns)
85323:
$3,739
State:
$6,509
(% of AGI for various income ranges: 0.6% for AGIs below $25k, 1.5% for AGIs $25k-50k, 2.1% for AGIs $50k-75k, 2.7% for AGIs $75k-100k, 3.7% for AGIs $100k-200k, 4.9% for AGIs over 200k)
Earned income credit: $2,724 (reported on 35.1% of returns)
Here:
$2,724
State:
$2,432
(% of AGI for various income ranges: 11.3% for AGIs below $25k, 2.1% for AGIs $25k-50k)
Percentage of individuals using paid preparers for their 2012 taxes: 54.8%
Here:
55%
State:
52%
(% for various income ranges: 55.1% for AGIs below $25k, 55.4% for AGIs $25k-50k, 53.6% for AGIs $50k-75k, 50.6% for AGIs $75k-100k, 56.4% for AGIs $100k-200k, 50.0% for AGIs over 200k)
Averages for the 2004 tax year for zip code 85323, filed in 2005:
Average Adjusted Gross Income (AGI) in 2004: $43,189 (Individual Income Tax Returns)
Here:
$43,189
State:
$50,097
Salary/wage: $41,348 (reported on 94.2% of returns)
Here:
$41,348
State:
$42,146
(% of AGI for various income ranges: 130.0% for AGIs below $10k, 89.9% for AGIs $10k-25k, 92.4% for AGIs $25k-50k, 92.3% for AGIs $50k-75k, 91.5% for AGIs $75k-100k, 81.2% for AGIs over 100k)
Taxable interest for individuals: $622 (reported on 27.5% of returns)
This zip code:
$622
Arizona:
$2,374
(% of AGI for various income ranges: 1.7% for AGIs below $10k, 0.5% for AGIs $10k-25k, 0.4% for AGIs $25k-50k, 0.2% for AGIs $50k-75k, 0.3% for AGIs $75k-100k, 0.6% for AGIs over 100k)
Taxable dividends: $741 (reported on 11.4% of returns)
Here:
$741
State:
$3,888
(% of AGI for various income ranges: 1.0% for AGIs below $10k, 0.2% for AGIs $10k-25k, 0.2% for AGIs $25k-50k, 0.1% for AGIs $50k-75k, 0.2% for AGIs $75k-100k, 0.3% for AGIs over 100k)
Net capital gain/loss: +$5,537 (reported on 10.1% of returns)
Here:
+$5,537
State:
+$17,569
(% of AGI for various income ranges: 0.6% for AGIs below $10k, 0.1% for AGIs $10k-25k, 0.3% for AGIs $25k-50k, 0.4% for AGIs $50k-75k, 0.7% for AGIs $75k-100k, 4.7% for AGIs over 100k)
Profit/loss from business: +$7,341 (reported on 11.5% of returns)
Here:
+$7,341
State:
+$11,088
(% of AGI for various income ranges: 12.2% for AGIs below $10k, 3.9% for AGIs $10k-25k, 1.9% for AGIs $25k-50k, 1.2% for AGIs $50k-75k, 1.2% for AGIs $75k-100k, 2.2% for AGIs over 100k)
IRA payment deduction: $2,501 (reported on 1.7% of returns)
85323:
$2,501
Arizona:
$3,023
(% of AGI for various income ranges: 0.1% for AGIs $10k-25k, 0.1% for AGIs $25k-50k, 0.1% for AGIs $50k-75k, 0.1% for AGIs $75k-100k, 0.1% for AGIs over 100k)
Self-employed pension: $8,367 (reported on 0.1% of returns)
Here:
$8,367
Arizona:
$15,785
Total itemized deductions: $16,491 (25% of AGI, reported on 43.5% of returns)
Here:
$16,491
State:
$19,781
Here:
24.7% of AGI
State:
21.8% of AGI
(% of AGI for various income ranges: 12.5% for AGIs below $10k, 9.0% for AGIs $10k-25k, 15.9% for AGIs $25k-50k, 19.3% for AGIs $50k-75k, 18.4% for AGIs $75k-100k, 16.3% for AGIs over 100k)
Charity contributions deductions: $2,128 (3% of AGI, reported on 37.4% of returns)
Here:
$2,128
State:
$3,389
Here:
3.1% of AGI
State:
3.5% of AGI
(% of AGI for various income ranges: 0.6% for AGIs below $10k, 0.8% for AGIs $10k-25k, 1.5% for AGIs $25k-50k, 2.0% for AGIs $50k-75k, 2.2% for AGIs $75k-100k, 2.3% for AGIs over 100k)
Total tax: $5,002 (reported on 71.7% of returns)
85323:
$5,002
State:
$8,323
(% of AGI for various income ranges: 2.8% for AGIs below $10k, 3.2% for AGIs $10k-25k, 5.3% for AGIs $25k-50k, 7.4% for AGIs $50k-75k, 9.4% for AGIs $75k-100k, 14.8% for AGIs over 100k)
Earned income credit: $1,871 (reported on 20.0% of returns)
Here:
$1,871
State:
$1,786
Percentage of individuals using paid preparers for their 2004 taxes: 60.3%
Here:
60%
State:
60%
(% for various income ranges: 54.7% for AGIs below $10k, 65.8% for AGIs $10k-25k, 61.3% for AGIs $25k-50k, 59.3% for AGIs $50k-75k, 56.1% for AGIs $75k-100k, 56.4% for AGIs over 100k)
Likely homosexual households (counted as self-reported same-sex unmarried-partner households)
Lesbian couples: 0.0% of all households
Gay men: 0.3% of all households
Household received Food Stamps/SNAP in the past 12 months: 2,348 Household did not receive Food Stamps/SNAP in the past 12 months: 12,020
Women who had a birth in the past 12 months: 826 (547 now married, 280 unmarried) Women who did not have a birth in the past 12 months: 12,162 (4,344 now married, 7,838 unmarried)
Housing units in zip code 85323 with a mortgage: 6,307 (253 second mortgage, 13 home equity loan, 132 both second mortgage and home equity loan) Houses without a mortgage: 52
Median monthly owner costs for units with a mortgage: $1,619 Median monthly owner costs for units without a mortgage: $434
Residents with income below the poverty level in 2022:
This zip code:
12.5%
Whole state:
12.5%
Residents with income below 50% of the poverty level in 2022:
This zip code:
6.2%
Whole state:
6.0%
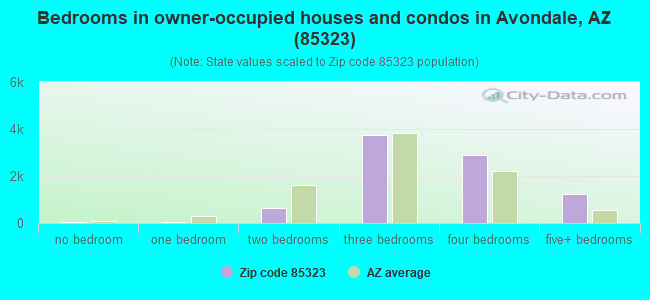
Median number of rooms in houses and condos:
Here:
6.1
State:
6.0
Median number of rooms in apartments:
Here:
4.6
State:
4.1
Notable locations in this zip code not listed on our city pages
Notable locations in zip code 85323: Phoenix International Raceway (A), Avondale Substation (B), Avondale Water Treatment Plant (C), Litchfield Railroad Station (D), Avondale Town Hall (E), Sam Garcia Western Avenue Library (F), Avondale Civic Center Library (G), Avondale Fire Station 173 (H), Avondale Fire Station 171 (I), Avondale Police Department (J). Display/hide their locations on the map
Churches in zip code 85323 include: Hamblen Chapel Evangelical Church (A), First Southern Baptist Church of Avondale (B), Christ Community United Methodist Church (C), Bethesda Church of God in Christ (D), Avondale Apostalic Church Truth Tabernacle (E), Avandale Christian Assembly Church (F), Saint Williams Catholic Church (G), Western Avenue Baptist Church (H), Morning Star Baptist Church (I). Display/hide their locations on the map
7,160 married couples with children.
3,434 single-parent households (1,186 men, 2,248 women).
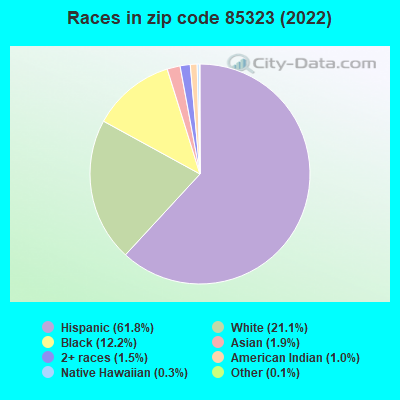
52.7% of residents of 85323 zip code speak English at home.
42.5% of residents speak Spanish at home (63% very well, 19% well, 12% not well, 6% not at all).
0.7% of residents speak other Indo-European language at home (86% very well, 10% well, 4% not well).
1.2% of residents speak Asian or Pacific Island language at home (36% very well, 52% well, 12% not well).
2.2% of residents speak other language at home (79% very well, 11% well, 7% not well, 2% not at all).
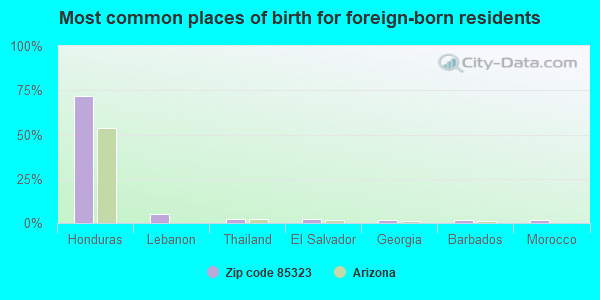
Foreign born population: 9,237 (19.9%) (50.3% of them are naturalized citizens)
This zip code:
19.9%
Whole state:
13.1%
72%Honduras
5%Lebanon
2%Thailand
2%El Salvador
2%Georgia
2%Barbados
2%Morocco
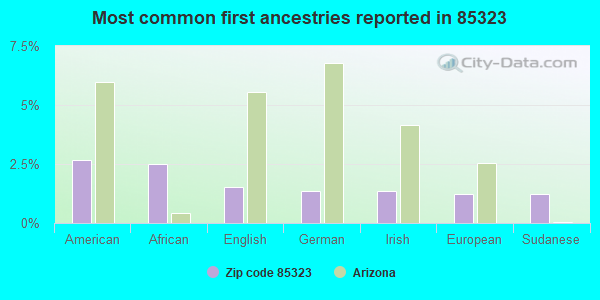
3%American
2%African
2%English
1%German
1%Irish
1%European
1%Sudanese
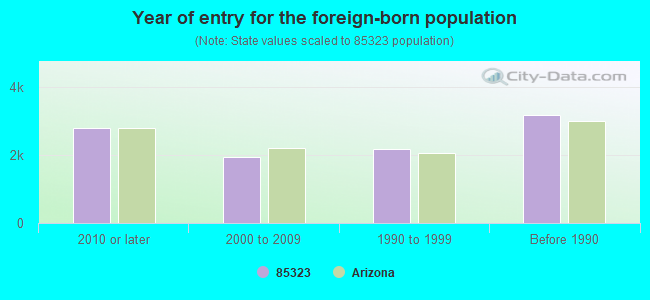
Year of entry for the foreign-born population
2,7872010 or later
1,9352000 to 2009
2,1891990 to 1999
3,185Before 1990
Major facilities with environmental interests located in this zip code:
AGUA FRIA UNION HIGH SCHOOL (530 EAST RILEY DRIVE in AVONDALE, AZ)
(Geographic Names Information System) COMPLIANCE ACTIVITY (Tracking inspections of insecticide, fungicide, and rodenticide, and toxic substances) (National Center for Education Statistics) - STATE ID-201 Organizations: AGUA FRIA UNION HIGH SCHOOL DISTRICT (SCHOOL DISTRICT)
Alternative names: AGUA FRIA HIGH SCHOOL, AGUA FRIA UNION HIGH SD #216
GATEWAY CHEVROLET (9901 W PAPAGO FREEWAY in AVONDALE, AZ)
STATE MASTER (Arizona's Tracking Of The Environment) - AZURITE-15993, AIR PROGRAM Conditionally Exempt Small Quantity Generators, less than 100 kg/month of hazardous waste (Resource Conservation and Recovery Act (tracking hazardous waste)) - notification Organizations: GATEWAY CHEVROLET INC (CONTACT/GENERAL)
, THERMO FLUIDS INC (CONTACT/OWNER)
AVONDALE ELEMENTARY SCHOOL (45 S 3RD AVE in AVONDALE, AZ)
(Geographic Names Information System) (National Center for Education Statistics) - STATE ID-102 Organizations: AVONDALE ELEMENTARY DISTRICT (SCHOOL DISTRICT)
WESTVIEW HIGH SCHOOL (10850 W GARDEN LAKES PKY in AVONDALE, AZ)
(National Center for Education Statistics) - STATE ID-202 Organizations: TOLLESON UNION HIGH SCHOOL DISTRICT (SCHOOL DISTRICT)
CORTE SIERRA ELEMENTARY SCHOOL (3300 N. SANTE FE TRAIL in AVONDALE, AZ)
(National Center for Education Statistics) - STATE ID-108 Organizations: LITCHFIELD ELEMENTARY DISTRICT (SCHOOL DISTRICT)
GARDEN LAKES ELEMENTARY SCHOOL (10825 W GARDEN LAKES PKWY in AVONDALE, AZ)
(National Center for Education Statistics) - STATE ID-016 Organizations: PENDERGAST ELEMENTARY DISTRICT (SCHOOL DISTRICT)
ESTRELLA HIGH SCHOOL (510 N. CENTRAL in AVONDALE, AZ)
(National Center for Education Statistics) - STATE ID-001 Organizations: ESTRELLA PUBLIC CHARTER HIGH SCHOOL DBA ESTRELLA PUBLIC HIGH (SCHOOL DISTRICT)
AVONDALE MIDDLE SCHOOL (1406 N CENTRAL AVE in AVONDALE, AZ)
(National Center for Education Statistics) - STATE ID-105 Organizations: AVONDALE ELEMENTARY DISTRICT (SCHOOL DISTRICT)
AVONDALE PRE-SCHOOL (44 S 3RD AVE in AVONDALE, AZ)
(National Center for Education Statistics) - STATE ID-101 Organizations: AVONDALE ELEMENTARY DISTRICT (SCHOOL DISTRICT)
PALM VALLEY ELEMENTARY (2801 N 135TH AVE in AVONDALE, AZ)
(National Center for Education Statistics) - STATE ID-104 Organizations: LITCHFIELD ELEMENTARY DISTRICT (SCHOOL DISTRICT)
NORTH STAR CHARTER SCHOOL, INC. (2517 N 107TH AVE. in AVONDALE, AZ)
(National Center for Education Statistics) - STATE ID-201
CANYON BREEZE ELEMENTARY (11675 W. ENCANTO BLVD. in AVONDALE, AZ)
(National Center for Education Statistics) - STATE ID-019 Organizations: PENDERGAST ELEMENTARY DISTRICT (SCHOOL DISTRICT)
VULCAN MATERIALS CO (5301 S DYSART RD in AVONDALE, AZ)
Small Quantity Generators, between 100 kg and 1000 kg of hazardous waste/month (Resource Conservation and Recovery Act (tracking hazardous waste)) USED OIL PROGRAM (Resource Conservation and Recovery Act (tracking hazardous waste)) TRI REPORTER (Tracking of toxic chemicals releasing facilities) Business SIC classification: ASPHALT PAVING MIXTURES AND BLOCKS Organizations: VULCAN MATERIALS COMPANY (CONTACT/OPERATOR)
, BRUCE DYER (CONTACT/OWNER)
Alternative names: NEW WEST MATERIALS AVONDALE 409, VULCAN MATERIALS CO - AVONDALE
Housing units lacking complete plumbing facilities: 1.2% Housing units lacking complete kitchen facilities: 0.9%
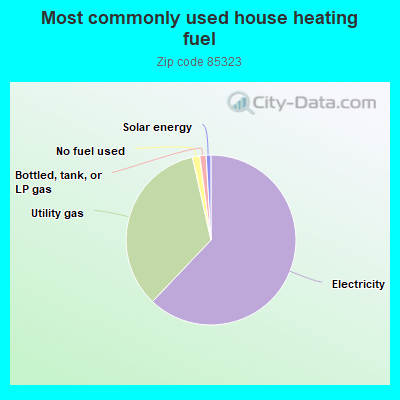
62.1%Electricity
34.4%Utility gas
1.4%No fuel used
1.2%Bottled, tank, or LP gas
0.9%Solar energy
Population in 1990: 12,321. Population change in the 1990s: +20,448 (+166.0%).
Place of birth for U.S.-born residents:
This state: 20,751
Northeast: 1,392
Midwest: 3,321
South: 2,155
West: 8,910
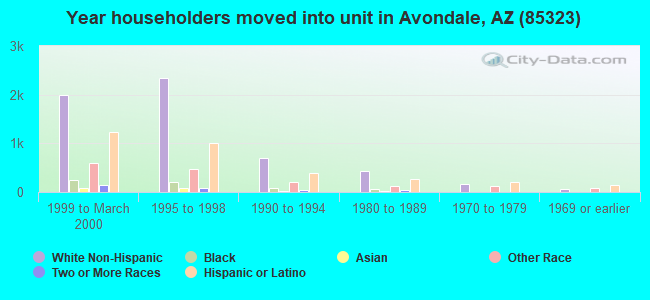
33% of the 85323 zip code residents lived in the same house 5 years ago. Out of people who lived in different houses, 66% lived in this county. Out of people who lived in different counties, 50% lived in Arizona.
86% of the 85323 zip code residents lived in the same house 1 year ago. Out of people who lived in different houses, 60% moved from this county. Out of people who lived in different houses, 5% moved from different county within same state. Out of people who lived in different houses, 26% moved from different state. Out of people who lived in different houses, 8% moved from abroad.
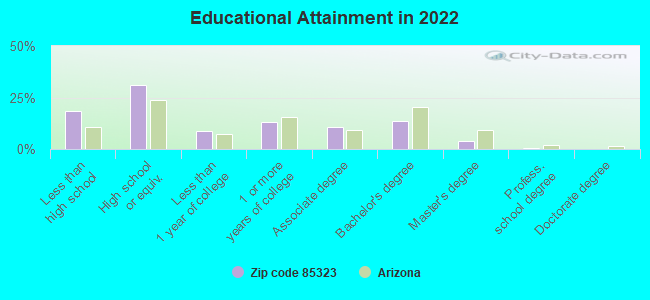
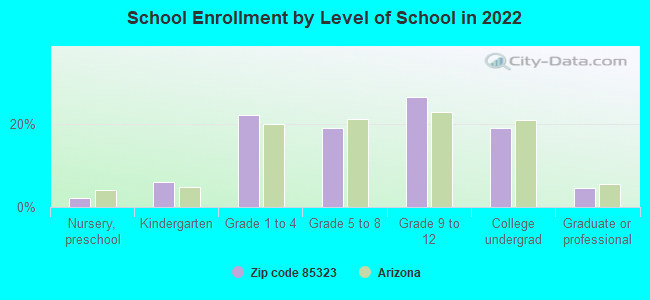
Private vs. public school enrollment:
Students in private schools in grades 1 to 8 (elementary and middle school): 465
Here:
9.3%
Arizona:
10.4%
Students in private schools in grades 9 to 12 (high school): 304
Here:
9.5%
Arizona:
8.8%
Students in private undergraduate colleges: 337
Here:
14.7%
Arizona:
13.1%
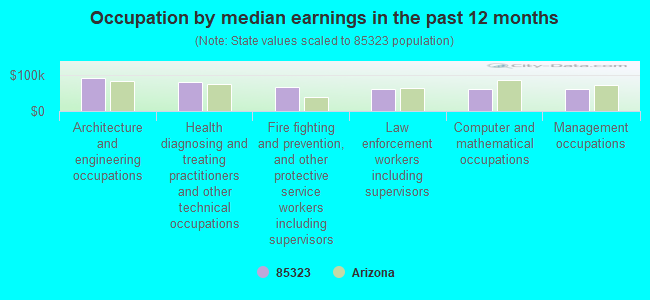
Occupation by median earnings in the past 12 months ($)
92,600Architecture and engineering occupations
79,840Health diagnosing and treating practitioners and other technical occupations
65,417Fire fighting and prevention, and other protective service workers including supervisors
62,162Law enforcement workers including supervisors
60,733Computer and mathematical occupations
60,379Management occupations
Companies with federal contracts located in this zip code (AVONDALE, AZ):
ROSELITA BEGAY (10350 W. MCDOWELL ROAD #3132; small business) : $67,501 in 4 contractsfrom 2004 to 2006
$39,600 with Indian Health Service for Personal Services Contracts. Signed on 2005-09-16. Effective on 2005-10-01. Completion date: 2006-09-30.
$34,000 with Public Health Service for Personal Services Contracts. Signed on 2004-08-20. Effective on 2004-10-01. Completion date: 2005-09-30.
$0 with Indian Health Service for Personal Services Contracts. Signed on 2006-08-29. Completion date: 2005-09-30.
-$6,099 with Public Health Service for Personal Services Contracts. Signed on 2005-09-27. Completion date: 2005-09-30.
COLE INDUSTRIAL EQUIPMENT CORP (3555 NORTH SAILBOAT LANE; small business) : $21,199 in 3 contractsin 2003
$13,556 with Air Force for Maintenance, Repair or Alteration of Real Property -- Family Housing Facilities. Signed on 2003-06-03. Completion date: 2003-06-21.
$4,463 with Air Force for Construction of Structures and Facilities -- Other Non-Building Facilities. Signed on 2003-09-09. Completion date: 2003-10-17.
$3,180 with Army for Specialized Shipping and Storage Containers. Signed on 2003-08-20. Completion date: 2003-09-09.
AMY BURNS (10922 W ASHBROOK PL; small business)
$14,400 with Air Force for Other Professional Services. Signed on 2004-10-01. Completion date: 2005-09-30.
ROBERT W HEARTWELL (10722 W CLOVER WAY; small business)
$7,150 with Air Force for Other Professional Services. Signed on 2004-10-01. Completion date: 2005-09-30.
DENZER MARY (12826 W CLARENDON AVE; small business)
$3,900 with Army for Maintenance, Repair and Rebuilding of Equipment -- Cleaning Equipment and Supplies. Signed on 2003-12-02. Completion date: 2005-09-30.
BURNS, CHRISTOPHER (10922 W ASHBROOK PL; small business)
$2,933 with Air Force for Engineering and Technical Services. Signed on 2004-10-01. Completion date: 2004-10-01.
HARRIS, FEDOLIA B (3504 N 108TH AVE; small business)
$1,925 with Air Force for Chaplain Services. Signed on 2006-06-29. Completion date: 2006-09-30.
Top industries in this zip code by the number of employees in 2005:
2004 - 2018 National Fire Incident Reporting System (NFIRS) incidents
Based on the data from the years 2004 - 2018 the average number of fires per year is 107. The highest number of reported fires - 255 took place in 2018, and the least - 0 in 2006. The data has an increasing trend.
When looking into fire subcategories, the most incidents belonged to: Structure Fires (47.0%), and Outside Fires (30.4%).
Fire incident types reported to NFIRS in Zip Code 85323


 Nearest zip codes: 85353, 85392, 85395, 85037, 85338, 85307.


 Based on the data from the years 2004 - 2018 the average number of fires per year is 107. The highest number of reported fires - 255 took place in 2018, and the least - 0 in 2006. The data has an increasing trend.
 When looking into fire subcategories, the most incidents belonged to: Structure Fires (47.0%), and Outside Fires (30.4%).