When comparing Miami and Fort Lauderdale, the two South Florida cities reveal contrasting aspects while also sharing common ground. Both cities provide diverse cultural experiences, beach-side living, and appealing climates. However, different scales of urbanity, economic environment, lifestyle, and cost differ between them. This comparison will look into different aspects crucial when considering relocation or just a visit, providing a comprehensive understanding of these vibrant cities.
Distance between
Miami, FL and
Fort Lauderdale, FL : 24.6 miles
Miami's population is larger by 142%. Its population has grown by 77,420 people (21.4%) since 2000. The population of Fort Lauderdale has grown by 29,271 people (19.2%) during that time.
Miami has a higher crime rate, both in violent and property crimes, compared to Fort Lauderdale. However, like with most large cities, crime rates vary significantly by neighborhood. Both cities are working actively to reduce crime, with community policing and security measures in place. For tourists, standard safety precautions advisable in big cities apply to both cities.
City-data.com crime index counts serious crimes and violent crime more heavily. It adjusts for the number of visitors and daily workers commuting into cities. (higher means more crime, U.S. average = 301.1)
City-data.com crime index counts serious crimes and violent crime more heavily. It adjusts for the number of visitors and daily workers commuting into cities. (higher means more crime, U.S. average = 301.1)
Sex Offenders
According to our data, there are 1,373 registered sex offenders living in Miami and 648 registered sex offenders living in . The ratio of residents to sex offenders in Miami is 330 to 1; the ratio in Fort Lauderdale is 276 to 1. The number of registered sex offenders compared to the number of residents in Miami is near to than in Fort Lauderdale.
Cost of Living
The cost of living in Miami is higher than in Fort Lauderdale, particularly relating to housing. However, the day-to-day expenses, such as groceries, utilities, and transportation, are relatively comparable. Visitors will also find Miami more expensive for hotels, dining, and entertainment.
Income Tax
There is no state income tax in Florida, which applies to both Miami and Fort Lauderdale. This is a significant factor for those considering relocation, whether they are working or retired.
Property Tax
Property tax rates vary slightly with Miami-Dade County generally having slightly higher rates compared to Broward County. However, homeowners in Florida can benefit from the homestead exemption, reducing their taxable value.
Sales Tax
Both cities share the same Florida state sales tax rate of 6%. However, Miami-Dade County imposes an additional surtax of 1%, while Broward County, where Fort Lauderdale is, does not.
Income
Type
Miami
Fort Lauderdale
Estimated median household income
$48,789
$64,912
Estimated per capita income
$37,223
$51,519
Cost of living index (U.S. average is 100)
110.1
112.2
If you make $50,000 in Miami, you will have to make $50,954 in Fort Lauderdale to maintain the same standard of living.
Geographical Conditions
Both cities are coastal with a robust beach culture. Miami has the well-known South Beach, while Fort Lauderdale has a famous strip of sand known as "The Strip". Both cities are in the hurricane belt and have similar geographical conditions.
Both cities have good educational systems with a range of public, private and charter schools. Miami is home to more higher education institutions, including the University of Miami and Florida International University. Fort Lauderdale, however, also offers quality tertiary education at places like Nova Southeastern University.
Miami has a larger economy with diverse sectors like finance, media, entertainment and international trade. However, Fort Lauderdale also has a vibrant economy and is known for its boating industry, tourism, and a growing tech scene. Job growth is positive in both cities.
Biggest Employers
The largest employers in Miami include Baptist Health South Florida and the University of Miami. In Fort Lauderdale, AutoNation, Citrix Systems, and the Holy Cross Hospital provide many jobs.
There were 102 building permits issued in Miami in 2012 (81 more than in 2011) compared to 202 building permits issued in Fort Lauderdale in 2012 (160 more than in 2011).
In Miami (Miami-Dade County), 61.8% voted for Democrats and 38.0% for Republicans in 2012 Presidential Election. In Fort Lauderdale (Broward County), 67.3% voted for Democrats and 32.3% for Republicans.
Elections
Type
Democrats
Republicans
Other
Year
Miami
Fort Lauderdale
Miami
Fort Lauderdale
Miami
Fort Lauderdale
2020
53.5%
64.8%
46.2%
34.9%
0.3%
0.3%
2016
63.4%
66.2%
33.9%
31.2%
2.7%
2.6%
2012
61.8%
67.3%
38.0%
32.3%
0.3%
0.3%
2008
58.1%
67.5%
41.9%
32.5%
0.0%
0.0%
2004
53.0%
64.6%
46.7%
34.8%
0.3%
0.5%
2000
52.7%
67.7%
46.4%
31.1%
0.9%
1.2%
1996
57.3%
63.5%
37.9%
28.3%
4.8%
8.2%
Breakdown of population affiliated with a religious congregation
Type
Adherents
Congregations
Religion
Miami
Fort Lauderdale
Miami
Fort Lauderdale
CATHOLIC CHURCH
21.8%
16.0%
4.5%
4.4%
SOUTHERN BAPTIST CONVENTION
3.2%
4.2%
21.8%
17.4%
SEVENTH DAY ADVENTIST CHURCH
1.1%
0.9%
4.3%
4.6%
MUSLIM ESTIMATE
0.9%
1.0%
1.0%
1.3%
EPISCOPAL CHURCH
0.5%
0.4%
2.1%
1.6%
AMERICAN BAPTIST CHURCHES IN THE USA
0.0%
0.7%
0.2%
0.2%
Weather
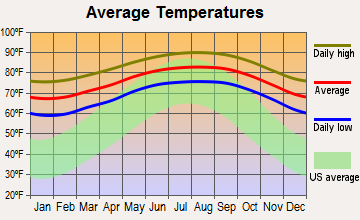
Miami and Fort Lauderdale enjoy a tropical rainforest climate, characterized by warm winters and hotter, wet summers. Hurricane season, from June through November, impacts both cities as they are coastal. However, significant infrastructure and planning exist to mitigate the effects of these storms.
Weather and climate
Type
Miami
Fort Lauderdale
Temperature - Average
77.3°F
75.9°F
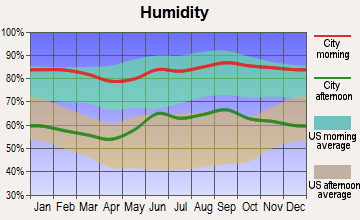
Humidity - Average morning or afternoon humidity
77.3%
77.3%
Humidity - Differences between morning and afternoon humidity
31%
31.1%
Humidity - Maximum monthly morning or afternoon humidity
86%
86%
Humidity - Minimum monthly morning or afternoon humidity
55%
55%
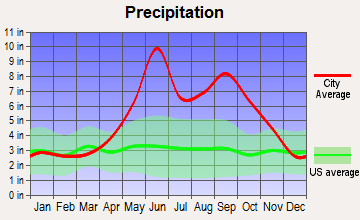
Precipitation - Yearly average
60 in
63.7 in
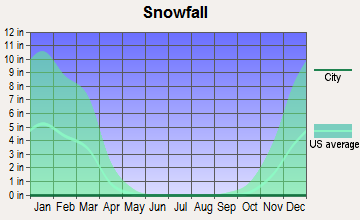
Snowfall - Yearly average
0 in
0 in
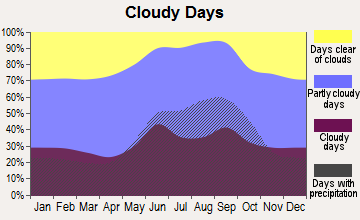
Clouds - Number of days clear of clouds
12.3%
12.4%
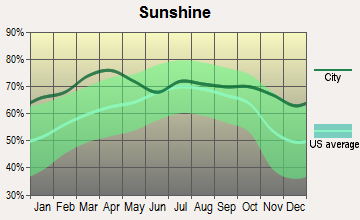
Sunshine amount - Average
76.8%
76.8%
Sunshine amount - Differences during a year
16%
16%
Sunshine amount - Maximum monthly
79%
79%
Sunshine amount - Minimum monthly
63%
63%
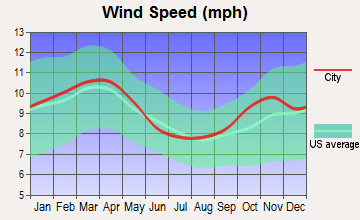
Wind speed - Average
9.1 mph
9.3 mph
Average climate in Miami, Florida
Average climate in Fort Lauderdale, Florida
Air pollution
Type
AQI
CO
NO2
OZONE
PM10
PM25
SO2
Year
Miami
Fort Lauderdale
Miami
Fort Lauderdale
Miami
Fort Lauderdale
Miami
Fort Lauderdale
Miami
Fort Lauderdale
Miami
Fort Lauderdale
Miami
Fort Lauderdale
2018
72
69
0.24
0.48
2.7
13.9
31.8
26.2
15.5
15.7
8.6
9.1
0.3
0.1
2017
80
78
0.27
0.51
3.0
14.9
30.9
25.5
N/A
N/A
8.5
9.9
0.4
0.1
2016
68
65
0.30
0.50
2.9
15.6
32.6
27.4
N/A
N/A
7.2
8.9
0.0
0.0
2015
62
61
0.23
0.40
2.4
6.6
29.0
23.9
N/A
N/A
8.2
8.2
0.0
0.0
2014
71
73
0.21
N/A
3.8
6.6
30.7
24.1
N/A
N/A
8.0
8.0
0.0
0.0
2013
64
62
0.22
N/A
3.1
4.4
30.8
23.9
N/A
N/A
7.9
7.9
0.0
0.0
2012
71
68
0.19
N/A
2.9
5.0
32.1
24.7
N/A
N/A
8.7
8.7
0.0
0.0
2011
72
65
0.16
N/A
3.0
5.6
32.3
24.9
N/A
N/A
8.7
8.7
0.0
0.0
2010
77
69
0.31
N/A
4.2
7.0
32.3
25.8
N/A
N/A
9.1
9.1
0.0
0.0
2009
67
64
0.53
N/A
3.3
6.3
31.9
23.9
N/A
N/A
9.1
9.2
0.0
0.0
2008
95
87
0.55
0.42
3.8
5.3
31.0
23.7
18.0
19.3
10.5
10.5
0.0
0.0
2007
94
89
0.59
0.39
5.0
6.3
33.5
25.1
21.9
19.4
10.5
10.5
0.0
0.0
2006
87
77
0.48
0.54
5.8
7.8
34.6
24.4
22.3
21.4
10.2
10.2
0.0
0.0
2005
75
67
0.55
0.73
6.0
7.8
31.8
22.2
18.8
18.3
8.7
8.7
0.0
0.0
2004
69
64
1.02
0.51
5.9
7.8
31.3
22.1
19.5
18.4
8.5
8.5
0.3
0.3
2003
70
64
0.99
0.49
6.5
8.5
29.5
20.5
N/A
N/A
8.4
8.4
0.4
0.4
2002
75
72
0.71
0.41
6.3
7.1
30.2
21.2
N/A
N/A
8.4
8.4
2.1
2.1
2001
84
83
0.80
0.56
5.9
8.8
30.2
22.2
N/A
N/A
9.1
9.1
1.5
1.5
2000
66
63
0.89
0.51
6.7
9.1
31.1
23.5
N/A
N/A
N/A
N/A
1.3
1.3
Natural disasters
Type
Miami
Fort Lauderdale
Tornado activity compared to U.S. average
63%
73.7%
Earthquake activity compared to U.S. average
1.1%
1.1%
Natural disasters compared to U.S. average
10%
27%
Transportation
While both cities offer public transit options, Miami's system is more comprehensive with Metrorail, Metrobus, and Metromover systems. However, Fort Lauderdale is investing in its transit infrastructure, with the Brightline high-speed rail connecting to Miami.
Transport
Type
Miami
Fort Lauderdale
Amtrak stations
2
1
Amtrak stations nearby
3
3
FAA registered aircraft
1
777
FAA registered aircraft manufacturers and dealers
159
178
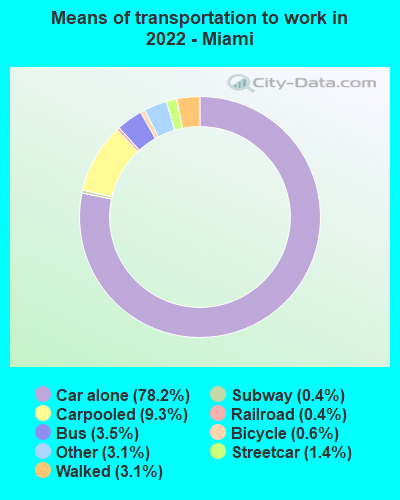
Means of transportation to work
Type
Miami
Fort Lauderdale
Bicycle
0.8%
0.7%
Bus
3.8%
2.3%
Carpooled
8.5%
9.4%
Car alone
81.1%
83.9%
Motorcycle
0.1%
0.1%
Railroad
0.2%
0.2%
Streetcar
0.5%
0.1%
Subway
0.3%
0.1%
Taxicab
0.2%
0.3%
Walked
2.6%
1.4%
Average travel time to work
Type
Miami
Fort Lauderdale
Average
33.7 min
30.6 min
Other means
26.1 min
24.3 min
Public transportation
48.5 min
44.2 min
Private vehicle occupancy
Type
Miami
Fort Lauderdale
Average
1.1
1.1
Drove alone
89%
92%
In 2 person carpool
9.2%
4.3%
In 3 person carpool
0.9%
1.5%
In 4 person carpool
0.4%
1.8%
In 5-6 person carpool
0.3%
0.4%
In 7+ person carpool
0.2%
0%
How many people usually rode to work in the car, truck or van.
Real Estate
Miami real estate is more expensive, featuring high-rise condos with ocean views. Fort Lauderdale offers more affordable options, with an emphasis on single-family homes. Both cities have seen increases in real estate values over the past year.
Neighborhoods
Miami’s neighborhoods, like the upscale Coral Gables and artsy Wynwood, are diverse and distinct. Fort Lauderdale also boasts unique areas, such as Las Olas for shopping and Victoria Park for its historic houses.
Houses and residents
Type
Miami
Fort Lauderdale
Houses
219,775
102,567
Average household size (people)
2.5
2.2
Median year apartment built
1981
1980
Median year house/condo built
1968
1967
Length of stay in the house since moving in
13.8 years
12.2 years
Houses occupied
192,219 (87.5%)
83,021 (80.9%)
Houses occupied by owners
58,463 (30.4%)
45,636 (55%)
Houses occupied by renters
133,756 (69.6%)
37,385 (45%)
Median rent asked for vacant for-rent units
$2,006
$2,515
Median monthly housing costs
$1,456
$1,596
Median price asked for vacant for-sale houses and condos
$1,201,540
$748,970
Estimated median house or condo value
$411,300
$395,500
Median numbers of rooms
3.8
4.2
Median number of rooms in apartments
3.4
3.5
Median number of rooms in houses and condos
5
5.3
Median house price - detached houses
$499,839
$647,246
Median house price - in 2-unit structures
$427,603
$472,086
Median house price - in 3-to-4-unit structures
$107,725
$279,116
Median house price - in 5 or more unit structures
$570,126
$452,065
Median house price - mobile homes
$238,353
$11,509
Median house price - Townhouses or other attached units
$768,446
$481,001
Median house price - All housing units
$550,392
$563,930
Median house age
43
48
Renting percentage
67.7%
45.1%
Housing density (houses/condos per square mile)
6,160.8
3,232.6
House value disparities
31.5%
33.8%
Household income disparities
51.3%
47.8%
Median household income for houses/condes with a mortgage
$92,897
$109,017
Median household income for apartments without a mortgage
$52,201
$67,158
Housing units without a mortgage
686 (2.1%)
680 (2.6%)
Housing units with both a second mortgage and home equity loan
1,692 (5.1%)
2,034 (7.6%)
Housing units with a mortgage
32,656 (97.9%)
25,967 (97.4%)
Housing units with a home equity loan
36 (0.1%)
43 (0.2%)
Housing units with a second mortgage
2,892 (8.7%)
2,270 (8.5%)
House/condo owner moved in on average (years ago)
10
9
House/condo renter moved in on average (years ago)
2
1
Housing units lacking complete kitchen facilities
1.6%
1%
Housing units lacking complete plumbing facilities
0.8%
0.5%
Housing units in structures
Housing units in structures
Miami
Fort Lauderdale
One, detached
22.6%
33.2%
One, attached
9.7%
4.5%
Two
3.3%
4.7%
3 or 4
4.0%
6.9%
5 to 9
5.8%
4.5%
10 to 19
6.9%
5.8%
20 to 49
8.3%
9.2%
50 or more
39.2%
30.3%
Mobile homes
0.2%
1.0%
Median real estate property taxes paid for housing units
Self-employed workers in own not incorporated business
26,340
5,015
State government workers
3,509
2,685
Unpaid family workers
695
65
Industries and Occupations
Miami's economy is driven by tourism, international trade, finance, and media, with the Port of Miami known as the 'Cruise Capital of the World'. Fort Lauderdale also has a strong tourism and marine industry, with increasing tech and film industry presence.
Both cities have excellent healthcare facilities. Miami is home to Baptist Health South Florida, one of the largest employers in Miami-Dade County. In Fort Lauderdale, Broward Health is one of the largest public health systems in the country.
Health (county statistics)
Type
Miami
Fort Lauderdale
General health status score of residents in this county from 1 (poor) to 5 (excellent)
Miami, being bigger, has more developed infrastructure, especially when it comes to skyscrapers and public transportation. However, Fort Lauderdale is investing heavily in infrastructure developments like high-speed rail and expanded public transit.
Infrastructure
Type
Miami
Fort Lauderdale
Hospitals
47
13
TV stations
26
27
Bank branches located here
346
107
Bank institutions located here
53
42
Main business address for public companies
29
17
Drinking water stations with no reported violations in the past
9
0
Drinking water stations with reported violations in the past
HMDA - Conventional home purchase loans - Applications denied
Year
Miami
Fort Lauderdale
1999
0
876
2000
1,368
752
2001
1,354
645
2002
1,274
540
2003
1,618
827
2004
2,862
1,511
2005
4,991
2,418
2006
7,400
2,642
2007
5,318
1,899
2008
3,212
705
2009
888
372
Culture and Food
Miami boasts a rich cultural mix, influenced heavily by its Hispanic population, evident in its festivals and cuisine. Similarly, Fort Lauderdale has a diverse culture with a significant boating community and a growing arts scene.
Sports Teams
Miami is home to several major sports teams, including the Miami Dolphins (NFL), Miami Heat (NBA), and Miami Marlins (MLB). While Fort Lauderdale doesn't have major league teams, it hosts the spring training for the Baltimore Orioles (MLB).


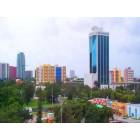


 Miami, FL
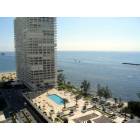
 Fort Lauderdale, FL