Living in Nashville-Davidson, Tennessee, and Huntsville, Alabama, each provides unique experiences and opportunities, both for permanent residents and tourists. Whether considering factors such as crime and safety, weather, cost of living, or cultural amenities, each city offers differing pros and cons. This detailed comparison of both cities highlights key aspects that individuals considering relocation or visitation may find helpful.
Distance between
Nashville-Davidson, TN and
Huntsville, AL : 100.1 miles
Nashville-Davidson's population is larger by 213%. Its population has grown by 133,327 people (24.4%) since 2000. The population of Huntsville has grown by 58,747 people (37.1%) during that time.
Nashville-Davidson's crime rate is comparatively higher than Huntsville, but it primarily varies by neighborhood. The city's comprehensive programs, like the Metro Police Department's Community Engagement Division, work toward building safer communities. In contrast, Huntsville has a lower crime rate, making it comparatively safer, which could be appealing for families contemplating relocation.
Cost of Living
The cost of living in Nashville-Davidson is higher than the national average, primarily due to housing costs. In contrast, Huntsville offers a lower cost of living, with healthcare, housing, and utility costs below the national average, making it an inviting prospect for relocation.
Income Tax
Tennessee does not have a state income tax. Alabama does levy a state income tax, with rates ranging from 2% to 5%.
Property Tax
Property taxes in Nashville-Davidson are higher than in Huntsville. However, both cities have property tax rates lower than the national average.
Sales Tax
Tennessee, including Nashville-Davidson, has a higher combined state and local sales tax rate at 9.55%. Alabama has a lower combined sales tax rate, with Huntsville's rate being approximately 9%.
Income
Type
Nashville-Davidson
Huntsville
Estimated median household income
$64,857
$70,757
Estimated per capita income
$42,268
$42,232
Cost of living index (U.S. average is 100)
90.9
83.8
If you make $50,000 in Huntsville, you will have to make $54,236 in Nashville-Davidson to maintain the same standard of living.
Geographical Conditions
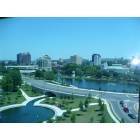
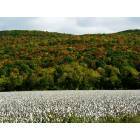
Nashville-Davidson sits along the Cumberland River, with hills and green spaces. Huntsville, situated in the Tennessee River Valley, is surrounded by hills and is near the Appalachian Mountains.
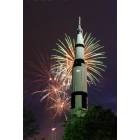
Nashville-Davidson is home to top-ranked universities like Vanderbilt University and provides a variety of public and private K-12 options. Huntsville, known as "The Rocket City," is renowned for its emphasis on STEM education, boasting the US Space & Rocket Center and the highest number of engineers per capita in the US.
Both cities enjoy a vibrant economy. Nashville-Davidson's economy is based on healthcare, education, music, and entertainment. Huntsville's economy, on the other hand, is strongly tied to technology, aerospace, and defense sectors.
Biggest Employers
The biggest employers in Nashville-Davidson are Vanderbilt University and Medical Center, Nissan North America, and HCA Holdings, Inc. In Huntsville, NASA, the U.S Army's Redstone Arsenal, and Huntsville Hospital are the largest employers.
There were 3,932 building permits issued in Nashville-Davidson in 2012 (2854 more than in 2011) compared to 1,483 building permits issued in Huntsville in 2012 (465 more than in 2011).
In Nashville-Davidson (Davidson County), 58.5% voted for Democrats and 39.9% for Republicans in 2012 Presidential Election. In Huntsville (Madison County), 40.2% voted for Democrats and 58.9% for Republicans.
Elections
Type
Democrats
Republicans
Other
Year
Nashville-Davidson
Huntsville
Nashville-Davidson
Huntsville
Nashville-Davidson
Huntsville
2020
65.0%
44.8%
32.6%
52.8%
2.3%
2.4%
2016
60.1%
38.4%
34.1%
54.8%
5.7%
6.8%
2012
58.5%
40.2%
39.9%
58.9%
1.6%
1.0%
2008
60.0%
41.9%
39.0%
56.9%
1.0%
1.2%
2004
54.9%
40.2%
44.6%
59.0%
0.4%
0.8%
2000
57.9%
42.6%
40.4%
54.9%
1.7%
2.5%
1996
79.3%
41.9%
18.1%
50.0%
2.6%
8.1%
Breakdown of population affiliated with a religious congregation
Type
Adherents
Congregations
Religion
Nashville-Davidson
Huntsville
Nashville-Davidson
Huntsville
SOUTHERN BAPTIST CONVENTION
14.1%
19.9%
19.6%
21.8%
CATHOLIC CHURCH
4.9%
4.2%
2.3%
1.4%
EPISCOPAL CHURCH
1.5%
1.0%
1.8%
1.4%
SEVENTH DAY ADVENTIST CHURCH
1.1%
1.9%
1.7%
2.5%
COPTIC ORTHODOX CHURCH
1.0%
0.0%
0.5%
0.0%
MUSLIM ESTIMATE
0.8%
0.3%
1.4%
0.7%
PRESBYTERIAN CHURCH IN AMERICA
0.8%
0.7%
0.9%
1.4%
CUMBERLAND PRESBYTERIAN CHURCH
0.4%
0.2%
1.3%
1.9%
LUTHERAN CHURCH
0.3%
0.3%
0.9%
1.2%
EVANGELICAL LUTHERAN CHURCH IN AMERICA
0.2%
0.5%
0.8%
0.9%
AMERICAN BAPTIST CHURCHES IN THE USA
0.1%
0.6%
0.3%
0.2%
Weather
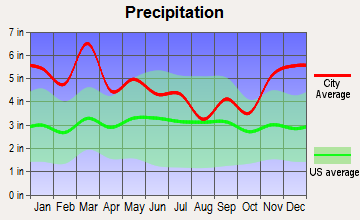
Both cities experience a humid subtropical climate, with Nashville-Davidson experiencing slightly colder winters and hotter summers. For tourists, late spring and early fall are the best times to visit both cities due to the pleasant weather, offering opportunities for outdoor activities and events.
Weather and climate
Type
Nashville-Davidson
Huntsville
Temperature - Average
58.5°F
60.2°F
Humidity - Average morning or afternoon humidity
75.9%
76.7%
Humidity - Differences between morning and afternoon humidity
38%
39%
Humidity - Maximum monthly morning or afternoon humidity
89%
90%
Humidity - Minimum monthly morning or afternoon humidity
51%
51%
Precipitation - Yearly average
49 in
56.7 in
Snowfall - Yearly average
17.8 in
7.2 in
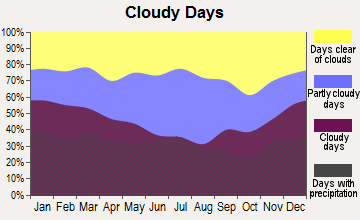
Clouds - Number of days clear of clouds
17.1%
16.7%
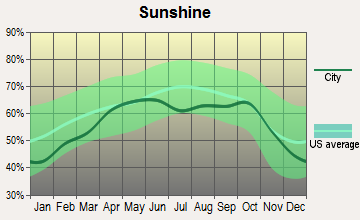
Sunshine amount - Average
59.7%
60.9%
Sunshine amount - Differences during a year
23%
20.2%
Sunshine amount - Maximum monthly
65%
64.5%
Sunshine amount - Minimum monthly
42%
44.3%
Wind speed - Average
7.7 mph
7.8 mph
Average climate in Nashville-Davidson, Tennessee
Average climate in Huntsville, Alabama
Air pollution
Type
AQI
CO
NO2
OZONE
PB
PM10
PM25
SO2
Year
Nashville-Davidson
Huntsville
Nashville-Davidson
Nashville-Davidson
Huntsville
Nashville-Davidson
Huntsville
Nashville-Davidson
Nashville-Davidson
Nashville-Davidson
Huntsville
Nashville-Davidson
Huntsville
2018
71
66
0.40
N/A
13.8
N/A
24.1
31.9
N/A
N/A
15.2
N/A
9.2
9.3
0.2
N/A
2017
70
60
0.38
N/A
14.4
N/A
26.8
30.4
N/A
N/A
15.3
N/A
8.7
6.7
0.1
N/A
2016
90
74
0.42
N/A
16.1
N/A
26.4
33.4
N/A
N/A
N/A
N/A
10.1
7.8
0.0
N/A
2015
68
67
0.43
N/A
15.5
N/A
23.6
30.2
N/A
N/A
N/A
N/A
10.8
7.7
0.1
N/A
2014
66
60
N/A
N/A
N/A
N/A
26.3
31.5
N/A
N/A
N/A
N/A
9.8
N/A
1.4
N/A
2013
62
60
N/A
N/A
N/A
N/A
N/A
32.5
N/A
N/A
N/A
N/A
9.7
N/A
N/A
N/A
2012
81
81
N/A
N/A
N/A
N/A
28.3
34.0
N/A
N/A
N/A
N/A
11.0
N/A
2.3
N/A
2011
81
82
N/A
N/A
N/A
N/A
25.9
33.9
N/A
N/A
N/A
N/A
11.0
N/A
1.7
N/A
2010
80
82
N/A
N/A
N/A
N/A
24.3
32.4
N/A
N/A
N/A
N/A
12.2
11.1
2.2
N/A
2009
72
73
N/A
N/A
N/A
N/A
22.5
31.3
N/A
N/A
N/A
N/A
11.5
12.2
2.4
N/A
2008
81
70
N/A
N/A
N/A
N/A
25.7
30.4
N/A
N/A
N/A
N/A
13.4
N/A
2.5
N/A
2007
99
85
N/A
N/A
N/A
N/A
27.4
32.1
N/A
N/A
N/A
N/A
15.5
N/A
2.7
N/A
2006
93
84
0.69
N/A
N/A
N/A
24.9
31.1
N/A
N/A
N/A
N/A
14.9
N/A
2.9
N/A
2005
104
81
0.56
N/A
N/A
N/A
23.5
28.6
N/A
N/A
N/A
N/A
16.9
N/A
3.1
N/A
2004
83
80
0.61
N/A
N/A
N/A
22.0
28.1
0.006
N/A
N/A
N/A
N/A
N/A
2.6
N/A
2003
93
82
0.67
N/A
N/A
5.3
18.5
27.5
0.005
N/A
N/A
N/A
15.8
N/A
3.8
1.6
2002
92
83
0.67
N/A
N/A
N/A
20.2
26.6
N/A
N/A
N/A
N/A
15.3
N/A
4.3
N/A
2001
95
80
0.89
N/A
N/A
N/A
19.5
27.3
N/A
N/A
N/A
N/A
15.6
N/A
4.5
N/A
2000
97
95
0.74
N/A
N/A
N/A
19.8
29.5
N/A
N/A
N/A
N/A
N/A
N/A
4.1
N/A
Natural disasters
Type
Nashville-Davidson
Huntsville
Tornado activity compared to U.S. average
169.1%
246.2%
Earthquake activity compared to U.S. average
296.1%
262.1%
Natural disasters compared to U.S. average
17%
17%
Transportation
Nashville-Davidson offers a more extensive public transit system, including buses and bikes, and shorter commute times. Huntsville's public transit system is less developed, and commute times can be longer, although traffic is typically less congested.
Transport
Type
Nashville-Davidson
Huntsville
Amtrak stations nearby
1
0
FAA registered aircraft
0
280
FAA registered aircraft manufacturers and dealers
0
5
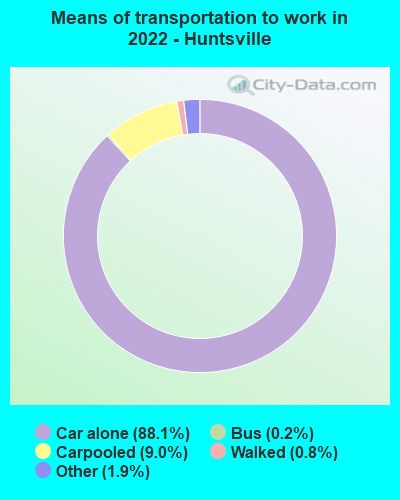
Means of transportation to work
Type
Nashville-Davidson
Huntsville
Bicycle
0.3%
0.1%
Bus
1.2%
0.2%
Carpooled
9.8%
6.5%
Car alone
85.5%
91.5%
Taxicab
0.1%
0.2%
Walked
1.8%
0.9%
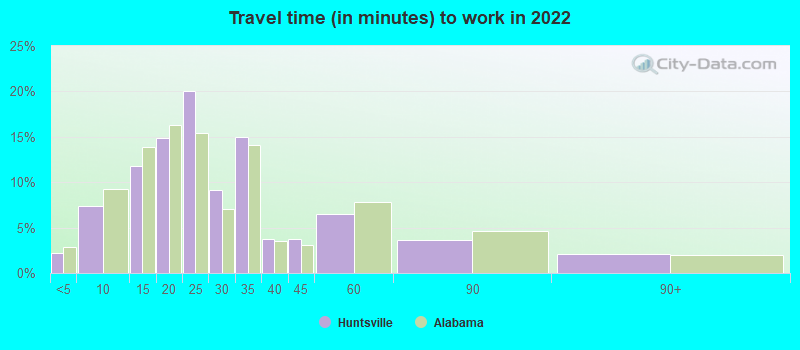
Average travel time to work
Type
Nashville-Davidson
Huntsville
Average
31.3 min
28.5 min
Other means
23.4 min
19.3 min
Public transportation
38.9 min
31.7 min
Private vehicle occupancy
Type
Nashville-Davidson
Huntsville
Average
1.2
1.1
Drove alone
88.7%
93.2%
In 2 person carpool
8.5%
4.7%
In 3 person carpool
1.6%
1.3%
In 4 person carpool
0.7%
0.6%
In 5-6 person carpool
0.5%
0.2%
How many people usually rode to work in the car, truck or van.
Real Estate
Real estate in Nashville-Davidson is pricier, with increasing property values. In contrast, Huntsville offers affordable housing options, making it attractive for new families and retirees.
Neighborhoods
Nashville-Davidson's neighborhoods range from urban locales like The Gulch to historic areas such as East Nashville. Huntsville offers a mix of historic districts like Five Points and modern suburban areas like Jones Valley.
Houses and residents
Type
Nashville-Davidson
Huntsville
Houses
331,262
104,141
Average household size (people)
2.3
2.3
Median year apartment built
1986
1985
Median year house/condo built
1984
1983
Length of stay in the house since moving in
12.2 years
12.6 years
Houses occupied
305,247 (92.1%)
96,551 (92.7%)
Houses occupied by owners
162,426 (53.2%)
59,015 (61.1%)
Houses occupied by renters
142,821 (46.8%)
37,536 (38.9%)
Median rent asked for vacant for-rent units
$1,391
$1,286
Median monthly housing costs
$1,291
$935
Median price asked for vacant for-sale houses and condos
$221,129
$246,721
Estimated median house or condo value
$346,700
$250,400
Median numbers of rooms
5.2
6
Median number of rooms in apartments
4.2
4.3
Median number of rooms in houses and condos
6.3
7.3
Median house price - detached houses
$437,686
$257,633
Median house price - in 2-unit structures
$320,904
$66,368
Median house price - in 3-to-4-unit structures
$319,119
$111,845
Median house price - in 5 or more unit structures
$305,249
$246,169
Median house price - mobile homes
$133,346
$113,555
Median house price - Townhouses or other attached units
$328,258
$196,303
Median house price - All housing units
$412,434
$253,177
Median house age
35
39
Renting percentage
44.6%
42%
Housing density (houses/condos per square mile)
699.9
598.4
House value disparities
31%
36.8%
Household income disparities
45.4%
45%
Median household income for houses/condes with a mortgage
$93,092
$100,571
Median household income for apartments without a mortgage
$68,871
$69,689
Housing units without a mortgage
3,189 (2.8%)
806 (2.3%)
Housing units with both a second mortgage and home equity loan
10,988 (9.6%)
2,456 (6.9%)
Housing units with a mortgage
110,850 (97.2%)
35,004 (97.7%)
Housing units with a home equity loan
333 (0.3%)
0 (0%)
Housing units with a second mortgage
13,192 (11.6%)
2,651 (7.4%)
House/condo owner moved in on average (years ago)
9
10
House/condo renter moved in on average (years ago)
1
1
Housing units lacking complete kitchen facilities
1.3%
2%
Housing units lacking complete plumbing facilities
0.5%
1.1%
Housing units in structures
Housing units in structures
Nashville-Davidson
Huntsville
One, detached
50.9%
67.1%
One, attached
8.4%
3.5%
Two
3.3%
2.0%
3 or 4
3.1%
5.2%
5 to 9
7.1%
6.3%
10 to 19
8.7%
6.6%
20 to 49
5.3%
3.2%
50 or more
11.9%
5.3%
Mobile homes
1.2%
0.9%
Boats, RVs, vans, etc.
0.1%
0.0%
Median real estate property taxes paid for housing units
Self-employed workers in own not incorporated business
31,952
5,111
State government workers
15,693
4,814
Unpaid family workers
463
668
Industries and Occupations
Nashville-Davidson is known for healthcare, music, and higher education jobs. In contrast, Huntsville is a hub for technology, aerospace, and defense jobs, housing one of NASA's largest fields, the Marshall Space Flight Center.
Nashville-Davidson is a healthcare hub with top-tier hospitals, including Vanderbilt University Medical Center. Huntsville has a robust healthcare system, with the Huntsville Hospital System being one of Alabama's leading providers.
Health (county statistics)
Type
Nashville-Davidson
Huntsville
General health status score of residents in this county from 1 (poor) to 5 (excellent)
Nashville-Davidson offers better infrastructure, with well-developed transportation, a large airport, and musical landmarks. Huntsville's infrastructure focus is primarily vocational, with a strong presence of government and private research institutions.
HMDA - Conventional home purchase loans - Applications denied
Year
Nashville-Davidson
Huntsville
1999
2,397
536
2000
1,451
393
2001
1,130
234
2002
1,075
259
2003
2,231
261
2004
2,731
393
2005
3,231
556
2006
3,720
607
2007
2,419
425
2008
952
178
2009
532
104
Culture and Food
Nashville-Davidson, often called "Music City," offers a vibrant music scene, rich history, and famous culinary delights, including hot chicken and barbecue. Huntsville, although smaller, boasts an increasing art scene, craft breweries, and the famous "Rocket City" space heritage.
Sports Teams
Nashville-Davidson hosts professional sports teams, such as the NFL's Titans and the NHL's Predators. Meanwhile, Huntsville offers minor league sports, featuring the MiLB's Rocket City Trash Pandas and the SPHL's Huntsville Havoc.


 Nashville-Davidson, TN and
  Huntsville, AL : 100.1 miles