Philadelphia, PA vs Kendale Lakes-Lindgren Acres, FL
###### Overview
Comparing Philadelphia, PA with Kendale Lakes-Lindgren Acres, FL is quite interesting as both cities have distinctive personalities. Though Philadelphia is known for its historical significance and vibrant nightlife, Kendale Lakes-Lindgren Acres provides a peaceful and suburban environment. Different factors such as crime rates, weather, cost of living, and quality of education can greatly influence someone's decision to relocate or visit either city.
###### Crime/Safety
Philadelphia has a higher crime rate than Kendale Lakes-Lindgren Acres. Nevertheless, crime rates often vary greatly by neighborhood. Both cities, however, have taken significant measures to deter criminal activities and improve safety for both residents and tourists.
###### Weather
In terms of weather, Philadelphia has a temperate climate with four distinct seasons. Kendale Lakes-Lindgren Acres, lying in a subtropical zone, experiences warm temperatures throughout the year but can face frequent hurricanes.
###### Cost of Living
While Philadelphia is relatively affordable for a northeastern US city, cost of living is even lower in Kendale Lakes-Lindgren Acres. This is especially palpable when it comes to housing costs.
###### Education
Philadelphia has a stronger reputation for education, with world-renowned institutions like the University of Pennsylvania. In contrast, Kendale Lakes-Lindgren Acres does not have as many high-ranking educational institutions, but boasts good K-12 public schools.
###### Work and Economy
Philadelphia has a more diverse economy with robust healthcare, education, and finance industries. Kendale Lakes-Lindgren Acres, although smaller, also provides common employment opportunities in sectors like retail, health care, and education.
###### Infrastructure
Philadelphia has a well-developed infrastructure, including historic landmarks and modern amenities. Kendale Lakes-Lindgren Acres is a suburban community with a good road network, ample green spaces, and decent public amenities.
###### Industries and Occupations
In Philadelphia, the most common industries include healthcare, education, and finance, while Kendale Lakes-Lindgren Acres' economy is driven more by retail, healthcare, and education.
###### Biggest Employers
The largest employers in Philadelphia are the Federal and City government, the School District of Philadelphia, and the University of Pennsylvania. In Kendale Lakes-Lindgren Acres, Miami-Dade County School District and various retail stores are among the top employers.
###### Real-Estate
Real estate is more expensive in Philadelphia than in Kendale Lakes-Lindgren Acres, due to its status as a major city. Kendale Lakes-Lindgren Acres offers affordable housing options, typically in suburban-style neighborhoods.
###### Neighborhoods
Philadelphia is famously a city of neighborhoods, with each one offering a unique charm. Kendale Lakes-Lindgren Acres, on the other hand, is more residential with less variation between neighborhoods.
###### Transportation/Public Transit/Commuting
Philadelphia’s public transportation system is extensive and includes buses, trolleys, and the Southeastern Pennsylvania Transportation Authority (SEPTA) trains. Kendale Lakes-Lindgren Acres does not have such extensive public transportation but is served by the Miami-Dade Transit buses.
###### City/State Sales Tax
In Pennsylvania, the state sales tax is 6%, with Philadelphia adding a 2% city sales tax. In Florida, the state sales tax is 6%, and Miami-Dade County has an additional 1% discretionary sales surtax.
###### City/State Income Tax
Pennsylvania levies a flat income tax rate of 3.07%, with Philadelphia residents paying an additional city wage tax. Florida, however, has no state income tax.
###### City/State Property Tax
Property taxes tend to be higher in Philadelphia than in Kendale Lakes-Lindgren Acres, reflecting higher property values and city services.
###### Culture/Food
Philadelphia’s rich history brings a vibrant cultural scene, famous for its Philly cheesesteaks and Italian cuisine. Kendale Lakes-Lindgren Acres offers a blend of cultures, reflected in its diverse food options, largely influenced by Latin America.
###### Sports Teams
Philadelphia is a city passionate about its sports teams, including the Eagles (NFL), Phillies (MLB), 76ers (NBA), and Flyers (NHL). Kendale Lakes-Lindgren Acres doesn't have its own sports teams but is within reach of Miami's teams.
###### Geographical Conditions
Philadelphia lies in the Atlantic Coastal Plain, with a landscape of rolling hills and valleys. Kendale Lakes-Lindgren Acres is a suburban community with a flat landscape and several man-made lakes.
###### Health Care
Philadelphia is home to premier healthcare institutions like the University of Pennsylvania Health System. Kendale Lakes-Lindgren Acres has access to Miami's healthcare facilities, including Kendall Regional Medical Center.
###### Summary
In sum, Philadelphia offers a bustling urban environment with rich historical and cultural experiences, a diverse job market, and access to world-class education and healthcare. Kendale Lakes-Lindgren Acres, in contrast, provides a more laid-back, suburban lifestyle, lower cost of living, and sunny weather year-round. Individuals, especially those looking to relocate, should carefully consider these factors according to their lifestyle and personal preferences.
In Philadelphia (Philadelphia County), 85.2% voted for Democrats and 14.0% for Republicans in 2012 Presidential Election. In Kendale Lakes-Lindgren Acres (Miami-Dade County), 61.8% voted for Democrats and 38.0% for Republicans.
Elections
Type
Democrats
Republicans
Other
Year
Philadelphia
Kendale Lakes-Lindgren Acres
Philadelphia
Kendale Lakes-Lindgren Acres
Philadelphia
Kendale Lakes-Lindgren Acres
2020
81.2%
53.5%
17.9%
46.2%
0.9%
0.3%
2016
82.3%
63.4%
15.3%
33.9%
2.4%
2.7%
2012
85.2%
61.8%
14.0%
38.0%
0.8%
0.3%
2008
83.2%
58.1%
16.4%
41.9%
0.4%
0.0%
2004
80.6%
53.0%
19.4%
46.7%
0.0%
0.3%
2000
80.4%
52.7%
18.1%
46.4%
1.5%
0.9%
1996
77.4%
57.3%
16.0%
37.9%
6.6%
4.8%
Breakdown of population affiliated with a religious congregation
Type
Adherents
Congregations
Religion
Philadelphia
Kendale Lakes-Lindgren Acres
Philadelphia
Kendale Lakes-Lindgren Acres
CATHOLIC CHURCH
24.8%
21.8%
8.8%
4.5%
AMERICAN BAPTIST CHURCHES IN THE USA
3.8%
0.0%
6.7%
0.2%
MUSLIM ESTIMATE
2.6%
0.9%
3.1%
1.0%
SOUTHERN BAPTIST CONVENTION
2.2%
3.2%
9.9%
21.8%
EPISCOPAL CHURCH
0.8%
0.5%
3.8%
2.1%
EVANGELICAL LUTHERAN CHURCH IN AMERICA
0.6%
0.2%
3.1%
1.3%
PRESBYTERIAN CHURCH IN AMERICA
0.4%
0.1%
1.4%
1.0%
SEVENTH DAY ADVENTIST CHURCH
0.4%
1.1%
1.7%
4.3%
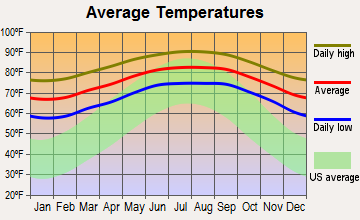
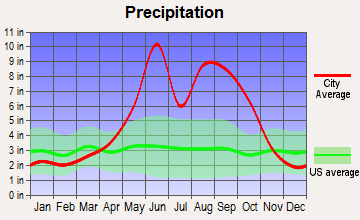
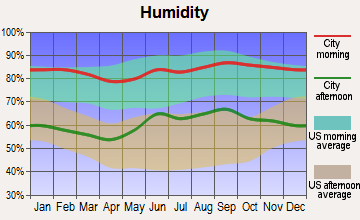
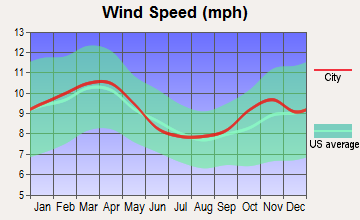
Weather and climate
Type
Philadelphia
Kendale Lakes-Lindgren Acres
Temperature - Average
54.8°F
75.9°F
Humidity - Average morning or afternoon humidity
69.9%
77.3%
Humidity - Differences between morning and afternoon humidity
34%
31%
Humidity - Maximum monthly morning or afternoon humidity
82%
86%
Humidity - Minimum monthly morning or afternoon humidity
48%
55%
Precipitation - Yearly average
45.7 in
61.5 in
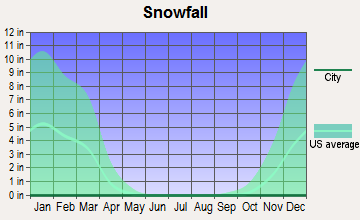
Snowfall - Yearly average
45.1 in
0 in
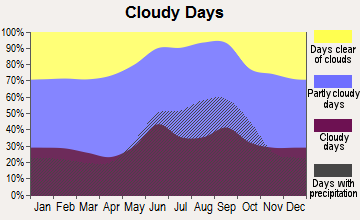
Clouds - Number of days clear of clouds
15.4%
12.3%
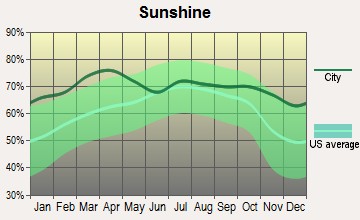
Sunshine amount - Average
59.8%
76.8%
Sunshine amount - Differences during a year
18%
16%
Sunshine amount - Maximum monthly
63%
79%
Sunshine amount - Minimum monthly
45%
63%
Wind speed - Average
10 mph
9.1 mph
Average climate in Philadelphia, Pennsylvania
Average climate in Kendale Lakes-Lindgren Acres, Florida
Air pollution
Type
AQI
CO
NO2
OZONE
PB
PM10
PM25
SO2
Year
Philadelphia
Kendale Lakes-Lindgren Acres
Philadelphia
Kendale Lakes-Lindgren Acres
Philadelphia
Kendale Lakes-Lindgren Acres
Philadelphia
Kendale Lakes-Lindgren Acres
Philadelphia
Philadelphia
Philadelphia
Kendale Lakes-Lindgren Acres
Philadelphia
Kendale Lakes-Lindgren Acres
2018
99
76
0.37
N/A
10.7
2.7
24.3
31.8
N/A
N/A
17.2
N/A
9.2
8.6
0.9
0.3
2017
105
78
0.32
0.13
11.0
3.0
25.3
30.9
0.004
N/A
22.3
N/A
8.9
9.0
1.0
0.4
2016
99
78
0.30
0.18
13.6
2.9
25.1
32.6
0.007
N/A
23.2
N/A
9.5
10.2
1.4
0.0
2015
110
64
0.34
0.20
15.8
2.4
22.6
29.0
0.007
N/A
23.9
N/A
10.5
8.4
1.8
0.0
2014
105
75
0.34
0.25
16.8
3.8
23.1
30.7
0.027
N/A
23.0
N/A
11.7
8.9
2.2
0.0
2013
105
66
0.27
0.16
16.7
3.1
22.5
30.8
0.029
N/A
31.0
N/A
10.5
8.2
1.5
0.0
2012
111
75
0.29
0.18
17.8
2.9
23.0
32.1
0.040
N/A
14.6
N/A
11.7
9.3
1.5
0.0
2011
113
73
0.28
0.10
19.9
3.0
24.3
32.3
0.039
N/A
16.9
N/A
9.8
9.6
1.9
0.0
2010
116
79
0.30
0.40
20.1
4.2
23.0
32.3
0.009
N/A
21.7
N/A
12.2
9.5
2.6
0.0
2009
95
65
0.32
0.48
18.9
3.3
19.7
31.9
0.011
N/A
18.0
N/A
11.9
9.3
2.9
0.0
2008
112
92
0.30
0.55
19.8
3.8
19.1
31.0
0.010
N/A
16.8
N/A
13.9
10.2
3.8
0.0
2007
128
86
0.42
0.67
21.6
5.0
23.3
33.5
0.019
N/A
17.5
N/A
12.3
10.3
4.2
0.0
2006
112
89
0.52
0.60
21.4
5.8
22.5
34.6
0.016
N/A
18.3
N/A
13.1
10.9
4.2
0.0
2005
108
77
0.58
0.58
24.4
6.0
20.8
31.8
0.018
N/A
19.7
N/A
N/A
10.4
5.0
0.0
2004
102
77
0.58
0.88
24.1
5.9
18.9
31.3
0.023
N/A
19.1
N/A
N/A
11.0
5.2
0.3
2003
103
62
0.62
0.78
23.8
6.5
19.7
29.5
0.034
N/A
19.6
N/A
N/A
N/A
5.4
0.4
2002
128
55
0.56
0.68
26.8
6.3
21.2
30.2
0.035
N/A
18.3
N/A
N/A
N/A
4.9
2.1
2001
119
62
0.63
0.84
27.9
5.9
20.0
30.2
0.014
N/A
20.6
N/A
N/A
N/A
5.6
1.5
2000
111
66
0.68
0.91
26.7
6.7
19.0
31.1
0.034
N/A
N/A
N/A
N/A
N/A
5.5
1.3
Natural disasters
Type
Philadelphia
Kendale Lakes-Lindgren Acres
Tornado activity compared to U.S. average
96.6%
59.2%
Earthquake activity compared to U.S. average
34.4%
1.1%
Natural disasters compared to U.S. average
22%
10%
Transport
Type
Philadelphia
Kendale Lakes-Lindgren Acres
Amtrak stations
2
0
Amtrak stations nearby
3
3
FAA registered aircraft
347
0
FAA registered aircraft manufacturers and dealers
2
0
Means of transportation to work
Type
Philadelphia
Kendale Lakes-Lindgren Acres
Bicycle
2%
0.2%
Bus
11.7%
1.1%
Carpooled
8.7%
13.9%
Car alone
60%
79.8%
Motorcycle
0.1%
0.1%
Railroad
0.7%
0.1%
Streetcar
4.2%
0%
Subway
2.8%
0.7%
Taxicab
0.2%
0.1%
Walked
7.8%
0.7%
Average travel time to work
Type
Philadelphia
Kendale Lakes-Lindgren Acres
Average
34.3 min
37.2 min
Houses and residents
Type
Philadelphia
Kendale Lakes-Lindgren Acres
Houses
733,015
99,850
Average household size (people)
2.5
3.2
Houses occupied
660,921 (90.2%)
95,931 (96.1%)
Houses occupied by owners
348,935 (52.8%)
73,396 (76.5%)
Houses occupied by renters
311,986 (47.2%)
22,535 (23.5%)
Median rent asked for vacant for-rent units
$1,301
$1,945
Median price asked for vacant for-sale houses and condos
$260,453
$863,170
Estimated median house or condo value
$220,700
$413,428
Median number of rooms in apartments
4.2
5.7
Median number of rooms in houses and condos
6.2
5.6
Housing density (houses/condos per square mile)
5,426.1
685.4
Household income disparities
49.5%
37.1%
Housing units without a mortgage
8,484 (4%)
7,880 (13%)
Housing units with both a second mortgage and home equity loan
18,029 (8.5%)
138 (0.2%)
Housing units with a mortgage
202,880 (96%)
52,892 (87%)
Housing units with a home equity loan
1,280 (0.6%)
4,328 (7.1%)
Housing units with a second mortgage
22,966 (10.9%)
7,482 (12.3%)
Housing units lacking complete kitchen facilities
3.7%
0.4%
Housing units lacking complete plumbing facilities
 Philadelphia, PA
 Kendale Lakes-Lindgren Acres, FL