Phoenix, AZ and Bakersfield, CA both present unique living experiences with distinct advantages and challenges. From differing climates to varied job markets, education opportunities, and cultural experiences, each city offers a unique lifestyle for residents and visitors alike. Exploring city differences in crime/safety, weather, cost of living, education, work and economy, and more can provide a clearer understanding of what each city has to offer and help individuals make informed decisions about relocation or visits.
Distance between
Phoenix, AZ and
Bakersfield, CA : 415.8 miles
Phoenix's population is larger by 299%. Its population has grown by 303,524 people (23.0%) since 2000. The population of Bakersfield has grown by 160,558 people (65.0%) during that time.
Phoenix has a higher crime rate compared to the national average, especially in property-related crimes. However, it's worth noting some neighborhoods have lower crime rates than others. Bakersfield also has a significant crime rate, primarily property crime, although violent crime has been trending downwards recently. Both cities provide local law enforcement agencies with tools and resources to combat crime and keep the community safe.
City-data.com crime index counts serious crimes and violent crime more heavily. It adjusts for the number of visitors and daily workers commuting into cities. (higher means more crime, U.S. average = 301.1)
City-data.com crime index counts serious crimes and violent crime more heavily. It adjusts for the number of visitors and daily workers commuting into cities. (higher means more crime, U.S. average = 301.1)
Sex Offenders
According to our data, there are 3,582 registered sex offenders living in Phoenix and 1,108 registered sex offenders living in . The ratio of residents to sex offenders in Phoenix is 451 to 1; the ratio in Bakersfield is 340 to 1. The number of registered sex offenders compared to the number of residents is a smaller in Phoenix than in Bakersfield.
Cost of Living
The cost of living in Phoenix is somewhat lower than the national average, highlighted by affordable housing costs. Conversely, Bakersfield's cost of living is relatively higher due to California's generally high cost of living, although it remains one of the more affordable cities in the state.
Income Tax
In Phoenix, income tax follows the Arizona state tax brackets, which range from 2.59% to 4.50%. Bakersfield residents are subject to California's progressive state income tax, which spans from 1% to 13.3% depending on income.
Property Tax
Phoenix has a lower than average property tax rate at just over 0.6%. Bakersfield's property tax rates also stay relatively low for California, averaging around 0.7%.
Sales Tax
Phoenix has a relatively high combined sales tax rate at approximately 8.6%, whereas Bakersfield, like the rest of California, boasts a steep state sales tax, pegged at 7.25%, with a total sales tax rate reaching up to 8.25% with local taxes.
Income
Type
Phoenix
Bakersfield
Estimated median household income
$68,435
$66,666
Estimated per capita income
$35,073
$29,363
Cost of living index (U.S. average is 100)
101.2
92.6
If you make $50,000 in Bakersfield, you will have to make $54,644 in Phoenix to maintain the same standard of living.
Geographical Conditions
Phoenix is in a desert valley surrounded by mountains and is known for its scenic landscapes and hiking trails. Bakersfield lies near the southern end of the San Joaquin Valley, an agricultural powerhouse, and is relatively close to both the mountains and coast.
Both cities boast a wide range of educational opportunities. Phoenix is home to several universities, mainly Arizona State University, and has a multitude of options for K-12 education. Bakersfield houses California State University, Bakersfield, and features a strong K-12 school system as well.
Phoenix has a robust and diverse economy, driven by sectors like real estate, finance, manufacturing, and health care. Its job growth outpaces the national average. Bakersfield's economy is driven primarily by agriculture, oil production, and manufacturing. It also offers significant opportunities in health care and education.
Biggest Employers
Phoenix is home to several Fortune 500 companies, including PetSmart and Avnet. Additionally, Banner Health and Walmart are among the city's largest employers. In Bakersfield, the largest employers are the County of Kern, The Giumarra Companies, and Bolthouse Farms.
There were 4,922 building permits issued in Phoenix in 2012 (3970 more than in 2011) compared to 1,121 building permits issued in Bakersfield in 2012 (699 more than in 2011).
In Phoenix (Maricopa County), 43.6% voted for Democrats and 54.3% for Republicans in 2012 Presidential Election. In Bakersfield (Kern County), 40.3% voted for Democrats and 57.0% for Republicans.
Elections
Type
Democrats
Republicans
Other
Year
Phoenix
Bakersfield
Phoenix
Bakersfield
Phoenix
Bakersfield
2020
50.2%
43.7%
48.0%
53.9%
1.8%
2.4%
2016
44.9%
40.4%
47.7%
53.1%
7.5%
6.5%
2012
43.6%
40.3%
54.3%
57.0%
2.1%
2.7%
2008
44.0%
40.1%
54.5%
57.9%
1.5%
1.9%
2004
42.4%
32.7%
57.0%
67.0%
0.6%
0.3%
2000
43.0%
36.3%
53.4%
60.8%
3.6%
2.9%
1996
44.5%
36.6%
47.2%
53.8%
8.2%
9.7%
Breakdown of population affiliated with a religious congregation
Type
Adherents
Congregations
Religion
Phoenix
Bakersfield
Phoenix
Bakersfield
CATHOLIC CHURCH
13.6%
29.3%
4.3%
4.9%
SOUTHERN BAPTIST CONVENTION
1.9%
3.2%
6.5%
12.0%
EVANGELICAL LUTHERAN CHURCH IN AMERICA
0.8%
0.0%
2.0%
0.3%
LUTHERAN CHURCH
0.5%
0.4%
1.5%
2.0%
SEVENTH DAY ADVENTIST CHURCH
0.4%
0.6%
2.0%
2.9%
EPISCOPAL CHURCH
0.3%
0.0%
1.3%
0.7%
VINEYARD USA
0.3%
0.0%
0.6%
0.3%
MUSLIM ESTIMATE
0.2%
0.5%
1.0%
0.7%
Weather
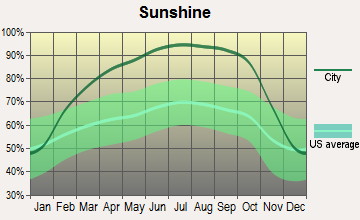
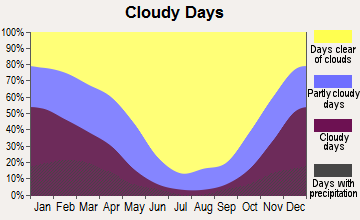
Phoenix is renowned for its hot desert climate, with intensely hot summers and mild winters. It also enjoys more than 300 sunny days per year, making it a favored destination for sun-seekers. On the other hand, Bakersfield sports a semi-arid climate, featuring hot summers and mild, wet winters. Its geographical location in the southern Central Valley also subjects it to occasional smog.
Weather and climate
Type
Phoenix
Bakersfield
Temperature - Average
71.5°F
64.9°F
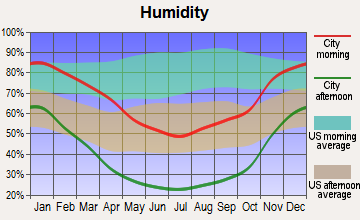
Humidity - Average morning or afternoon humidity
37.5%
53.5%
Humidity - Differences between morning and afternoon humidity
48%
59%
Humidity - Maximum monthly morning or afternoon humidity
60%
80%
Humidity - Minimum monthly morning or afternoon humidity
12%
21%
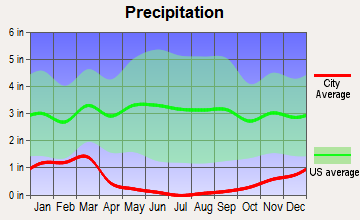
Precipitation - Yearly average
8.7 in
6.5 in
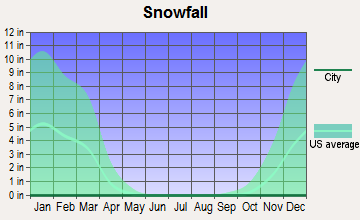
Snowfall - Yearly average
0 in
0 in
Clouds - Number of days clear of clouds
35.3%
31.8%
Sunshine amount - Average
92.8%
80.8%
Sunshine amount - Differences during a year
16%
31.1%
Sunshine amount - Maximum monthly
95%
89.5%
Sunshine amount - Minimum monthly
79%
58.4%
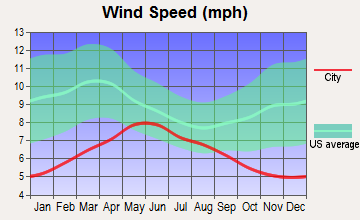
Wind speed - Average
6.6 mph
6.8 mph
Average climate in Phoenix, Arizona
Average climate in Bakersfield, California
Air pollution
Type
AQI
CO
NO2
OZONE
PB
PM10
PM25
SO2
Year
Phoenix
Bakersfield
Phoenix
Bakersfield
Phoenix
Bakersfield
Phoenix
Bakersfield
Bakersfield
Phoenix
Bakersfield
Phoenix
Bakersfield
Phoenix
2018
156
135
0.38
0.28
15.2
12.3
28.5
32.3
0.004
N/A
34.8
53.7
8.6
15.7
0.6
N/A
2017
120
141
0.41
0.29
15.9
12.7
28.6
32.9
0.004
N/A
34.9
68.2
7.6
15.8
1.4
N/A
2016
114
127
0.44
0.27
15.8
11.7
27.3
31.0
0.004
N/A
30.6
N/A
7.7
14.5
0.4
N/A
2015
102
144
0.46
0.29
17.6
11.8
27.1
32.2
0.003
N/A
26.2
N/A
7.9
16.2
0.9
N/A
2014
117
141
0.46
0.28
19.6
13.3
27.6
31.5
N/A
N/A
37.0
53.0
8.5
17.9
1.1
N/A
2013
130
134
0.43
0.30
19.9
14.3
27.9
31.0
0.003
N/A
35.3
N/A
8.4
21.7
0.9
N/A
2012
157
145
0.44
N/A
21.2
14.6
28.1
32.4
0.004
N/A
41.9
N/A
8.8
17.2
1.3
N/A
2011
203
126
0.47
N/A
20.0
15.0
28.3
29.3
0.004
N/A
41.3
43.9
9.6
17.8
0.9
N/A
2010
100
147
0.48
N/A
19.9
14.4
26.9
29.3
0.003
N/A
31.2
39.2
8.3
17.2
0.9
N/A
2009
108
170
0.52
0.37
20.1
16.6
25.6
28.0
0.005
N/A
38.2
41.5
N/A
20.8
1.8
N/A
2008
106
171
0.48
0.48
21.4
17.4
26.6
27.8
N/A
N/A
39.6
57.0
N/A
22.7
2.4
N/A
2007
129
167
0.54
0.55
23.5
18.5
25.2
26.2
0.007
N/A
47.6
43.0
N/A
23.0
2.4
N/A
2006
131
157
0.66
0.56
25.3
19.2
24.4
29.6
N/A
N/A
50.8
N/A
N/A
18.0
2.3
N/A
2005
109
165
0.74
0.53
25.9
19.3
22.2
28.2
N/A
N/A
44.6
N/A
N/A
21.5
2.5
N/A
2004
98
163
0.77
0.51
25.5
19.9
23.4
27.1
N/A
N/A
32.8
N/A
N/A
21.3
1.4
N/A
2003
101
170
0.90
0.56
26.8
21.2
23.7
29.1
N/A
N/A
42.6
N/A
N/A
24.4
1.4
N/A
2002
111
170
0.98
0.60
28.7
22.5
23.6
26.9
0.006
N/A
41.8
N/A
N/A
29.5
1.6
N/A
2001
106
150
1.00
0.73
28.6
18.2
22.3
29.6
0.006
N/A
37.8
39.6
N/A
N/A
1.5
N/A
2000
117
130
1.14
0.77
29.9
23.4
24.6
28.8
0.006
N/A
45.6
39.6
N/A
N/A
1.7
N/A
Natural disasters
Type
Phoenix
Bakersfield
Tornado activity compared to U.S. average
18.3%
2.7%
Earthquake activity compared to U.S. average
2,597.6%
7,870.5%
Natural disasters compared to U.S. average
16%
29%
Transportation
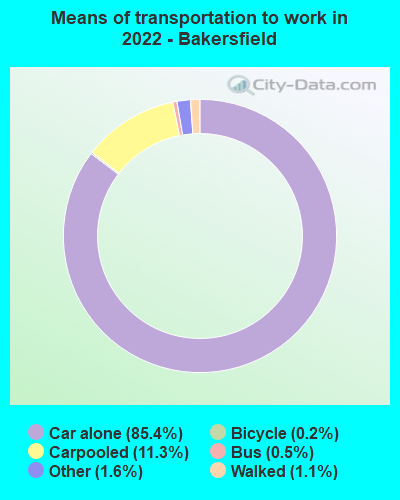
Phoenix provides a light rail system, buses, and popular rideshare services, with a reasonable average commute time. Bakersfield is heavily car-dependent given its wide geographical dispersion, with limited public transit options but manageable commuting times within the city.
Transport
Type
Phoenix
Bakersfield
Amtrak stations
3
1
Amtrak stations nearby
3
1
FAA registered aircraft
1
433
FAA registered aircraft manufacturers and dealers
15
12
Means of transportation to work
Type
Phoenix
Bakersfield
Bicycle
0.4%
0.2%
Bus
1.8%
0.3%
Carpooled
12.2%
8.7%
Car alone
81.8%
87.4%
Motorcycle
0.4%
0.3%
Railroad
0.2%
0%
Taxicab
0.1%
0.1%
Walked
1.4%
0.8%
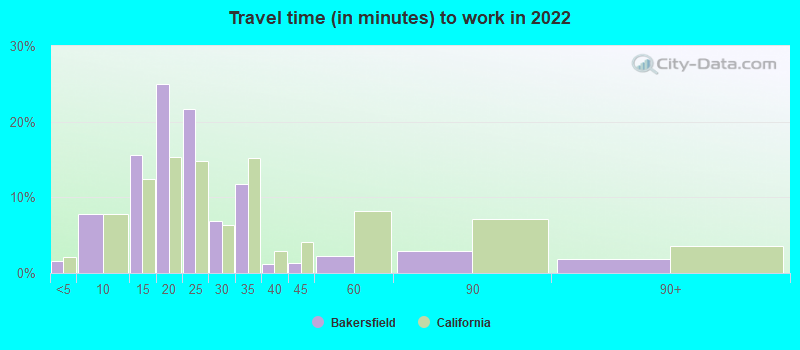
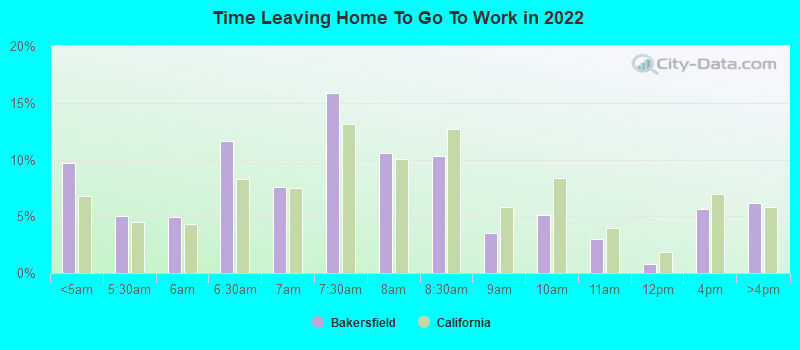
Average travel time to work
Type
Phoenix
Bakersfield
Average
28.6 min
21.5 min
Other means
26.4 min
22.2 min
Public transportation
45.1 min
44.6 min
Private vehicle occupancy
Type
Phoenix
Bakersfield
Average
1.2
1.2
Drove alone
86.4%
89.3%
In 2 person carpool
9.6%
6.2%
In 3 person carpool
2%
2.9%
In 4 person carpool
1.5%
1%
In 5-6 person carpool
0.3%
0.5%
In 7+ person carpool
0.3%
0.1%
How many people usually rode to work in the car, truck or van.
Real Estate
Phoenix real estate leans more affordable than the national average and maintains a healthy rate of appreciation. Meanwhile, Bakersfield offers affordable housing options relative to the rest of California, but higher than Phoenix, with an upward trend in property appreciation.
Neighborhoods
Phoenix houses diverse neighborhoods ranging from the upscale Paradise Valley and Arcadia to the trendy and artistic Roosevelt Row. Bakersfield has a mix of suburban and urban neighborhoods such as the popular Westchester and River Oaks.
Houses and residents
Type
Phoenix
Bakersfield
Houses
644,625
134,270
Average household size (people)
2.8
3.1
Median year apartment built
1987
1984
Median year house/condo built
1983
1994
Length of stay in the house since moving in
11.1 years
11.8 years
Houses occupied
602,039 (93.4%)
128,007 (95.3%)
Houses occupied by owners
354,237 (58.8%)
78,398 (61.2%)
Houses occupied by renters
247,802 (41.2%)
49,609 (38.8%)
Median rent asked for vacant for-rent units
$1,605
$1,220
Median monthly housing costs
$1,284
$1,384
Median price asked for vacant for-sale houses and condos
$375,817
$366,859
Estimated median house or condo value
$352,600
$318,600
Median numbers of rooms
5.2
5.2
Median number of rooms in apartments
4
4.1
Median number of rooms in houses and condos
6.1
5.9
Median house price - detached houses
$452,968
$371,576
Median house price - in 2-unit structures
Over $1,000,000
$254,175
Median house price - in 3-to-4-unit structures
$229,335
$299,855
Median house price - in 5 or more unit structures
$299,875
$221,915
Median house price - mobile homes
$159,046
$92,500
Median house price - Townhouses or other attached units
$300,398
$244,694
Median house price - All housing units
$429,075
$356,236
Median house age
36
32
Renting percentage
42.4%
40.3%
Housing density (houses/condos per square mile)
1,357.5
1,187.2
House value disparities
30.8%
29.3%
Household income disparities
43.9%
44.3%
Median household income for houses/condes with a mortgage
$96,609
$98,668
Median household income for apartments without a mortgage
$63,626
$60,298
Housing units without a mortgage
3,634 (1.5%)
376 (0.7%)
Housing units with both a second mortgage and home equity loan
12,949 (5.2%)
1,793 (3.1%)
Housing units with a mortgage
246,434 (98.5%)
56,648 (99.3%)
Housing units with a home equity loan
624 (0.2%)
0 (0%)
Housing units with a second mortgage
16,890 (6.8%)
2,474 (4.3%)
House/condo owner moved in on average (years ago)
8
9
House/condo renter moved in on average (years ago)
1
2
Housing units lacking complete kitchen facilities
1.2%
2.1%
Housing units lacking complete plumbing facilities
0.7%
0.2%
Housing units in structures
Housing units in structures
Phoenix
Bakersfield
One, detached
60.3%
71.5%
One, attached
4.9%
3.9%
Two
1.4%
1.3%
3 or 4
4.4%
7.8%
5 to 9
5.0%
3.8%
10 to 19
5.3%
2.0%
20 to 49
4.1%
2.2%
50 or more
11.3%
5.1%
Mobile homes
3.1%
2.3%
Boats, RVs, vans, etc.
0.2%
0.0%
Median real estate property taxes paid for housing units
Self-employed workers in own not incorporated business
48,122
11,506
State government workers
30,385
10,997
Unpaid family workers
1,048
161
Industries and Occupations
In Phoenix, the leading industries include health care, retail, and hospitality, with ample opportunities in managerial, sales, and office occupations. Bakersfield's economy leans heavily towards agriculture, oil, manufacturing, and education, yielding a wide variety of occupation choices.
Phoenix is a significant health care hub, boasting some of the best hospitals in the nation like the Mayo Clinic. Bakersfield provides a variety of reputable health care facilities, with Adventist Health Bakersfield leading the charge.
Phoenix features a well-developed infrastructure with significant investment in public transportation, roads, and airports. Bakersfield, while improving, has traditionally battled with the infrastructure demands of a growing city, including congestion and air quality issues.
Infrastructure
Type
Phoenix
Bakersfield
Hospitals
48
18
TV stations
22
9
Arenas or stadiums
2
1
Bank branches located here
263
65
Bank institutions located here
41
19
Main business address for public companies
41
2
Drinking water stations with no reported violations in the past
2
7
Drinking water stations with reported violations in the past
HMDA - Conventional home purchase loans - Applications denied
Year
Phoenix
Bakersfield
1999
5,846
392
2000
4,847
393
2001
3,823
297
2002
3,472
372
2003
5,750
1,104
2004
9,848
2,188
2005
15,879
3,038
2006
18,392
3,393
2007
9,797
2,036
2008
3,130
565
2009
1,614
289
Culture and Food
Phoenix boasts a rich Southwestern culture, with a vibrant art scene, diverse culinary offerings, and an array of festivals and events. Bakersfield prides itself on its strong local music scene, most notably the "Bakersfield Sound," and a variety of dining options, including acclaimed Basque cuisine.
Sports Teams
Phoenix is a major sports hub, hosting teams in all four major leagues, such as the Phoenix Suns (NBA) and Arizona Cardinals (NFL). Bakersfield, while lacking major league teams, embraces minor league sports, featuring the Bakersfield Condors (hockey).


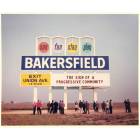

 Phoenix, AZ
 Bakersfield, CA