Phoenix, Arizona, and Urban Honolulu, Hawaii, offer diverse living experiences. Phoenix, known for its sunny weather and thriving business culture, offers a cost-effective living with competitive employment opportunities. Honolulu, a dream destination for many, is renowned for its stunning natural beauty, unique Hawaiian culture, and beachside living. While comparing crime and safety, weather, cost of living, educational opportunities, work and economy, infrastructure, industries and occupations, significant employers, real estate, neighborhoods, transportation, taxes, culture, food, sports teams, geographical conditions, and health care, the living conditions and lifestyle in these cities will be analyzed.
When it comes to safety, both cities show contrasting statistics. Phoenix tends to have a higher crime rate compared to the national average in the US. This is however not universally distributed across the city; some neighborhoods are safer than others. On the contrary, Urban Honolulu's crime rate is below the national average, making it generally safer for residents and tourists alike.
Cost of Living
Living in Phoenix is more affordable when compared to Urban Honolulu. The cost of basic necessities, housing, and general expenses are lower in Phoenix. However, Honolulu, because of its island location and higher service demand driven by tourism, has a higher cost of living.
Income Tax
Residents in Phoenix have to pay a state income tax, but Honolulu residents enjoy the advantage of paying no state income tax in Hawaii.
Property Tax
Phoenix residents face a relatively high property tax rate compared to Urban Honolulu. However, property value is generally higher in Honolulu.
Sales Tax
Phoenix, located in Arizona, has a higher combined state and local sales tax rate (8.6%) compared to Urban Honolulu's (4.5%).
Income
Type
Phoenix
Urban Honolulu
Estimated median household income
$68,435
$90,704
Estimated per capita income
$35,073
$39,573
Cost of living index (U.S. average is 100)
101.2
128.3
If you make $50,000 in Phoenix, you will have to make $63,389 in Urban Honolulu to maintain the same standard of living.
Geographical Conditions
Phoenix is located in the Sonoran Desert surrounded by mountains. On the other hand, Urban Honolulu is on the island of Oahu with tropical landscapes, mountains, and beautiful beaches.
Both Phoenix and Urban Honolulu offer robust education systems with good public and private schools. Both cities are also home to renowned colleges and universities—Arizona State University in Phoenix and University of Hawai'i at Manoa in Urban Honolulu.
Phoenix has a diverse and vibrant economy with job opportunities spread across industries such as health care, financial services, and retail trade. Meanwhile, Honolulu's economy greatly relies on tourism, defense, and research industries.
Biggest Employers
The largest employers in Phoenix include Banner Health, Wells Fargo, and American Airlines. For Urban Honolulu, the key employers are Altres Industrial, Hawaiian Airlines, and the US Department of Defense.
In Phoenix (Maricopa County), 43.6% voted for Democrats and 54.3% for Republicans in 2012 Presidential Election. In Urban Honolulu (Honolulu County), 68.9% voted for Democrats and 29.8% for Republicans.
Elections
Type
Democrats
Republicans
Other
Year
Phoenix
Urban Honolulu
Phoenix
Urban Honolulu
Phoenix
Urban Honolulu
2020
50.2%
62.7%
48.0%
35.8%
1.8%
1.5%
2016
44.9%
61.5%
47.7%
31.6%
7.5%
6.9%
2012
43.6%
68.9%
54.3%
29.8%
2.1%
1.3%
2008
44.0%
70.1%
54.5%
28.8%
1.5%
1.1%
2004
42.4%
51.1%
57.0%
48.3%
0.6%
0.6%
2000
43.0%
54.6%
53.4%
39.6%
3.6%
5.7%
1996
44.5%
56.3%
47.2%
33.6%
8.2%
10.1%
Breakdown of population affiliated with a religious congregation
Type
Adherents
Congregations
Religion
Phoenix
Urban Honolulu
Phoenix
Urban Honolulu
CATHOLIC CHURCH
13.6%
18.2%
4.3%
5.2%
SOUTHERN BAPTIST CONVENTION
1.9%
1.5%
6.5%
9.7%
EVANGELICAL LUTHERAN CHURCH IN AMERICA
0.8%
0.2%
2.0%
1.1%
LUTHERAN CHURCH
0.5%
0.1%
1.5%
0.8%
SEVENTH DAY ADVENTIST CHURCH
0.4%
0.5%
2.0%
2.6%
EPISCOPAL CHURCH
0.3%
0.5%
1.3%
2.7%
VINEYARD USA
0.3%
0.0%
0.6%
0.1%
Weather
Phoenix is known for its desert climate with extremely hot summers and mild winters. Meanwhile, Honolulu experiences a tropical climate, characterized by warm weather year-round. For tourists, weather may impact their choice of city depending upon the time of year.
Weather and climate
Type
Phoenix
Urban Honolulu
Temperature - Average
71.5°F
74.7°F
Humidity - Average morning or afternoon humidity
37.5%
70.5%
Humidity - Differences between morning and afternoon humidity
48%
27%
Humidity - Maximum monthly morning or afternoon humidity
60%
79%
Humidity - Minimum monthly morning or afternoon humidity
12%
52%
Precipitation - Yearly average
8.7 in
58.7 in
Snowfall - Yearly average
0 in
0 in
Clouds - Number of days clear of clouds
35.3%
14.9%
Sunshine amount - Average
92.8%
71%
Sunshine amount - Differences during a year
16%
19%
Sunshine amount - Maximum monthly
95%
75%
Sunshine amount - Minimum monthly
79%
56%
Wind speed - Average
6.6 mph
11.1 mph
Average climate in Phoenix, Arizona
Air pollution
Type
AQI
CO
NO2
OZONE
PB
PM10
PM25
SO2
Year
Phoenix
Urban Honolulu
Phoenix
Urban Honolulu
Phoenix
Urban Honolulu
Phoenix
Urban Honolulu
Urban Honolulu
Phoenix
Urban Honolulu
Phoenix
Urban Honolulu
Phoenix
Urban Honolulu
2018
156
43
0.38
0.44
15.2
3.9
28.5
25.8
N/A
N/A
34.8
12.8
8.6
3.8
0.6
0.1
2017
120
46
0.41
0.49
15.9
4.4
28.6
24.8
N/A
N/A
34.9
11.9
7.6
3.5
1.4
0.4
2016
114
46
0.44
0.59
15.8
3.9
27.3
24.8
N/A
N/A
30.6
13.7
7.7
3.2
0.4
0.3
2015
102
53
0.46
0.53
17.6
3.5
27.1
24.0
N/A
N/A
26.2
11.7
7.9
4.5
0.9
0.4
2014
117
45
0.46
0.41
19.6
3.4
27.6
21.6
N/A
N/A
37.0
13.3
8.5
4.6
1.1
1.2
2013
130
53
0.43
0.41
19.9
3.0
27.9
26.4
N/A
N/A
35.3
12.0
8.4
5.6
0.9
1.1
2012
157
58
0.44
0.32
21.2
2.9
28.1
24.7
N/A
N/A
41.9
12.4
8.8
5.6
1.3
0.6
2011
203
57
0.47
0.38
20.0
2.9
28.3
28.4
N/A
N/A
41.3
12.8
9.6
6.1
0.9
0.6
2010
100
68
0.48
0.38
19.9
3.4
26.9
N/A
0.002
N/A
31.2
N/A
8.3
5.9
0.9
1.1
2009
108
58
0.52
0.42
20.1
4.3
25.6
N/A
0.003
N/A
38.2
N/A
N/A
5.8
1.8
0.7
2008
106
19
0.48
0.45
21.4
4.2
26.6
N/A
0.002
N/A
39.6
N/A
N/A
N/A
2.4
0.6
2007
129
23
0.54
0.52
23.5
4.7
25.2
N/A
0.001
N/A
47.6
N/A
N/A
N/A
2.4
0.5
2006
131
21
0.66
0.24
25.3
4.9
24.4
N/A
0.003
N/A
50.8
N/A
N/A
N/A
2.3
1.1
2005
109
19
0.74
0.42
25.9
5.0
22.2
N/A
0.001
N/A
44.6
N/A
N/A
N/A
2.5
0.7
2004
98
18
0.77
0.60
25.5
4.8
23.4
N/A
0.001
N/A
32.8
N/A
N/A
N/A
1.4
0.5
2003
101
21
0.90
0.62
26.8
4.7
23.7
N/A
0.002
N/A
42.6
N/A
N/A
N/A
1.4
0.5
2002
111
19
0.98
0.64
28.7
4.9
23.6
N/A
N/A
N/A
41.8
N/A
N/A
N/A
1.6
0.9
2001
106
21
1.00
0.62
28.6
4.5
22.3
N/A
N/A
N/A
37.8
N/A
N/A
N/A
1.5
0.7
2000
117
21
1.14
0.68
29.9
4.9
24.6
N/A
N/A
N/A
45.6
N/A
N/A
N/A
1.7
0.4
Natural disasters
Type
Phoenix
Urban Honolulu
Tornado activity compared to U.S. average
18.3%
3.7%
Earthquake activity compared to U.S. average
2,597.6%
1,250.1%
Natural disasters compared to U.S. average
16%
16%
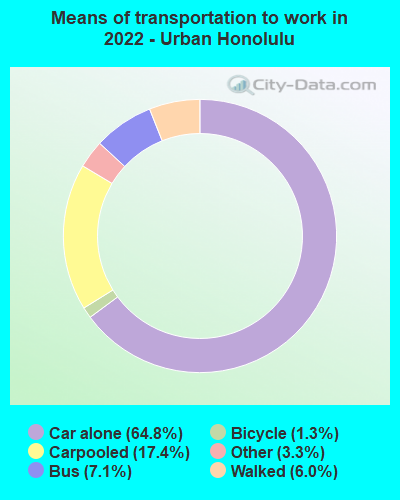
Transportation
Phoenix offers a light rail system, buses, ride-hailing services, and plenty of highway space for commuting. Honolulu, on the other hand, primarily relies on TheBus system, biking, walking, car sharing, and driving for commuting.
Transport
Type
Phoenix
Urban Honolulu
Amtrak stations
3
0
Amtrak stations nearby
3
0
FAA registered aircraft
1
0
FAA registered aircraft manufacturers and dealers
15
0
Means of transportation to work
Type
Phoenix
Urban Honolulu
Bicycle
0.4%
0.9%
Bus
1.8%
6.3%
Carpooled
12.2%
15.5%
Car alone
81.8%
69.3%
Motorcycle
0.4%
0%
Railroad
0.2%
0%
Taxicab
0.1%
0%
Walked
1.4%
5.4%
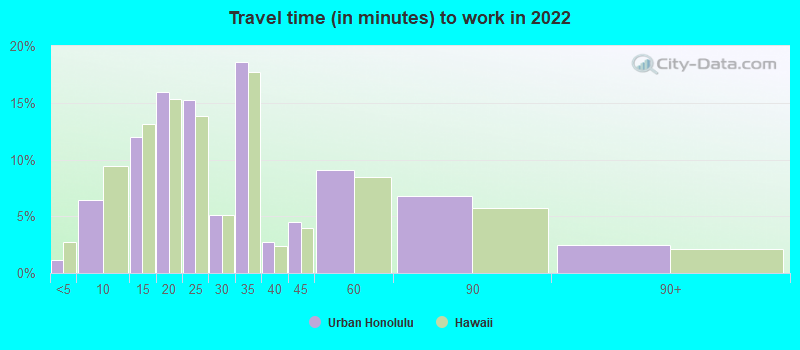
Average travel time to work
Type
Phoenix
Urban Honolulu
Average
28.6 min
29.3 min
Private vehicle occupancy
Type
Phoenix
Urban Honolulu
Average
1.2
1.3
Drove alone
86.4%
78.5%
In 2 person carpool
9.6%
16.2%
In 3 person carpool
2%
2.9%
In 4 person carpool
1.5%
1.6%
In 5-6 person carpool
0.3%
0.8%
In 7+ person carpool
0.3%
0%
How many people usually rode to work in the car, truck or van.
Real Estate
Compared to Honolulu, the real estate market in Phoenix is more affordable. People moving to Phoenix will find a wide range of housing options at lower prices, while in Urban Honolulu, ocean-view properties carry a premium price tag.
Neighborhoods
Both Phoenix and Honolulu boast diverse neighborhoods. In Phoenix, neighborhoods like Ahwatukee Foothills and Desert View offer upscale housing. In Urban Honolulu, neighborhoods like Manoa and Hawaii Kai offer a mix of residential options and ample amenities.
Houses and residents
Type
Phoenix
Urban Honolulu
Houses
644,625
157,427
Average household size (people)
2.8
2.5
Median year apartment built
1987
1974
Median year house/condo built
1983
1973
Length of stay in the house since moving in
11.1 years
16.7 years
Houses occupied
602,039 (93.4%)
138,398 (87.9%)
Houses occupied by owners
354,237 (58.8%)
68,458 (49.5%)
Houses occupied by renters
247,802 (41.2%)
69,940 (50.5%)
Median rent asked for vacant for-rent units
$1,605
$1,712
Median monthly housing costs
$1,284
$1,665
Median price asked for vacant for-sale houses and condos
$375,817
$238,020
Estimated median house or condo value
$352,600
$781,600
Median numbers of rooms
5.2
3.8
Median house price - detached houses
$452,968
Over $1,000,000
Median house price - in 2-unit structures
Over $1,000,000
$940,827
Median house price - in 3-to-4-unit structures
$229,335
$766,061
Median house price - in 5 or more unit structures
$299,875
$539,250
Median house price - mobile homes
$159,046
Over $1,000,000
Median house price - Townhouses or other attached units
$300,398
Over $1,000,000
Median house price - All housing units
$429,075
$941,281
Median house age
36
47
Renting percentage
42.4%
56.2%
House value disparities
30.8%
27%
Household income disparities
43.9%
45%
Median household income for houses/condes with a mortgage
$96,609
$117,430
Median household income for apartments without a mortgage
$63,626
$69,945
Housing units without a mortgage
3,634 (1.5%)
1,696 (4.1%)
Housing units with both a second mortgage and home equity loan
12,949 (5.2%)
6,219 (15.1%)
Housing units with a mortgage
246,434 (98.5%)
39,383 (95.9%)
Housing units with a home equity loan
624 (0.2%)
319 (0.8%)
Housing units with a second mortgage
16,890 (6.8%)
7,901 (19.2%)
House/condo owner moved in on average (years ago)
8
14
House/condo renter moved in on average (years ago)
1
3
Housing units lacking complete kitchen facilities
1.2%
2.6%
Housing units lacking complete plumbing facilities
0.7%
0.8%
Housing units in structures
Housing units in structures
Phoenix
Urban Honolulu
One, detached
60.3%
26.2%
One, attached
4.9%
7.2%
Two
1.4%
2.4%
3 or 4
4.4%
3.3%
5 to 9
5.0%
5.2%
10 to 19
5.3%
6.2%
20 to 49
4.1%
11.4%
50 or more
11.3%
38.0%
Mobile homes
3.1%
0.1%
Boats, RVs, vans, etc.
0.2%
0.0%
Median real estate property taxes paid for housing units
Self-employed workers in own not incorporated business
48,122
10,949
State government workers
30,385
19,544
Unpaid family workers
1,048
446
Industries and Occupations
Phoenix supports various industries including technology, finance, manufacturing, and healthcare. However, the primary industries in Urban Honolulu are tourism, defense, and research and development, with many opportunities in hospitality and defense.
Both Phoenix and Urban Honolulu offer reputable healthcare services. Phoenix has state-of-the-art medical facilities like the Mayo Clinic while Honolulu offers respected health organizations like the Queen's Health System.
Health (county statistics)
Type
Phoenix
Urban Honolulu
General health status score of residents in this county from 1 (poor) to 5 (excellent)
Phoenix has a robust infrastructure including an extensive highway system, an international airport, and urban development projects, plus a developing public transit system. Urban Honolulu has comprehensive infrastructure as well with a focus on tourism-friendly facilities.
Infrastructure
Type
Phoenix
Urban Honolulu
TV stations
22
15
Culture and Food
Phoenix offers a rich blend of American, Mexican, and Native American cultures while Honolulu showcases a unique Hawaiian culture mixed with Asian influences. Food enthusiasts will enjoy the diverse culinary scenes of both cities.
Sports Teams
For sports enthusiasts, Phoenix is home to teams in all four major professional sports leagues. In contrast, Honolulu does not host any major professional sports teams but does host the Honolulu Marathon and the Triple Crown of Surfing.


 Phoenix, AZ and
  Urban Honolulu, HI : 2,905.3 miles